Accurately measuring cell viability and concentration with good reproducibility is essential, whether cells are being used to manufacture a therapeutic drug product or for pharmacological drug efficacy testing.
Automated cell counters are only able to count cells according to the technology they use and their specific configuration, which means that results may vary widely when examined in comparison with alternative automated systems or the common manual technique involving a microscope and haemocytometer.
For example, when calculating cell concentration, some people will only consider cells as ‘viable’ if the cells are larger than a specific diameter. This approach ignores any smaller cells, even if these smaller cells possess other characteristics which would indicate that they are viable.
Later in this article, an example is given which explores how identifying viable cells solely by minimum diameter may introduce variability of around 33% in the reported cell concentration. This article outlines how to best avoid these common difficulties in settings where a user adopts a new, automated method of cell counting.
Introduction
For therapeutic protein production, ensuring the correct concentration of cells within the bioreactor is essential. This not only ensures maximum yield, but also helps to avoid overcrowding which can lead to programmed cell death (apoptosis).
For pharmacological drug efficacy testing, it is important to ensure consistency in the concentration of cells in each test sample. This helps the results of the efficacy testing of the drug to remain unaffected by any potential variability of cell viability and concentration within the samples themselves.
In either case, however, there is no ‘correct’ means of identifying the cells. Users will likely have optimized their processes based on their own, specific cell counting techniques. Some users will only count cells as ‘viable’ if they are larger than a certain diameter, failing to count smaller cells, even if they do appear to be viable.
This article outlines the way in which identifying viable cells by minimum diameter alone may introduce variability of approximately 33% in the reported cell concentration. To give another example, some users will count a clump of cells as representing one single cell, while others will attempt to count individual cells in the clump.
When considering a move to an automated cell counting method, the way in which the automated system differentiates viable cells from non-viable cells or cell debris should be considered, as well as understanding the effect this may have on the overall process.
What is the 'correct' answer?
When counting cells, there is no ‘correct answer’. However, the majority of users tend to follow the guidance provided in EP2.7.291 and USP<1046>,2 both of which refer to viable cell counting via the dye exclusion method, going on to suggest Trypan Blue as a suitable dye.
Perhaps the most commonly employed technique is the manual method, which makes use of the haemocytometer slide and a microscope. Variation in results between users is often high with this method, however,3 prompting many users to consider an automated method instead.
It is important to take into account the way in which the automated method identifies and counts cells, and to comprehend its effect on the process, should results be different between the manual and automated methods.
Sources of variability in the manual haemocytometer method
A number of steps are involved in the manual haemocytometer method. Each individual step may lead to variability, so this needs to be considered when shifting to an automated method. Common steps include:
- Accurate pipetting
- Aspiration cycles
- Dye quantity
- Dye mixing cycles
- Size of cells
- Clumps
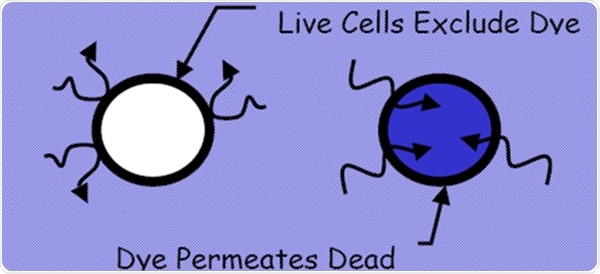
Figure 1. Dye exclusion method from EP 2.7.29 and USP <1046>. Image Credit: Beckman Coulter Life Sciences
Accurate pipetting is vital. The haemocytometer slide volume is generally 1nL, so, in order to report viable cell concentration/mL, the cell count viewed through the microscope must be multiplied by a factor of 100,000 to convert nL to mL. This means that even the smallest error in the pipetting volume (therefore, cells dispensed onto the slide) will be extremely magnified when the concentration/mL is calculated.
Aspiration may be beneficial in resuspending cells and breaking up clumps. It should be noted though, that techniques do vary between users, leading to variation in the resuspension and breaking of clumps. Additionally, some cells are especially delicate, and undue aspiration could actually rupture the membranes of viable cells, allowing dye to enter and ultimately resulting in under-counting.
Inaccurate dye addition will adversely affect the accuracy of the final cell concentration calculation. This occurs in the same way that variations in volume via inaccurate pipetting of the sample does, because the dye functions effectively as a sample diluent.
Variations in the dye concentration may also affect the effective penetration of the dye into any dead or dying cells.
Similarly, differences in the number of dye mixing cycles may impact on the penetration of the dye into the dead and dying cells, as it takes some time for the dye to penetrate these cells. Therefore, variations in mixing cycles may result in the cells being exposed to the dye for differing amounts of time.
In cases where the health of the viable cells has a significant impact on either pharmacology experiments or the yield of therapeutic proteins, most users only count cells as viable if they are larger than a specific size. As can be seen here, dye exclusion is often not the sole criteria when defining cell viability.
Lastly, some users may try to identify and count each individual cell in a clump of cells, while others may count the clump of cells as if this was a single cell.
Where these issues cause small variations in the way the cells are counted, this can have considerable effects on the calculation of concentration/mL. This is primarily because of the substantial multiplication factor between nL and mL.
This prompts particularly noticeable effects as the cell concentration/mL increases in the bioreactor and cells are more likely to clump together.
Avoiding the common pitfalls
As outlined above, even small variations in the way the cells are counted via the manual haemocytometer method can lead to substantial variations in the calculated viable cell concentration/mL.
Based on this issue alone, many people who work with cell counting applications have moved to automated cell counting methods as part of their search for more reproducible results, better controlled pharmacology experiments or improved manufacturing production yield.
Some common pitfalls do exist, however. For example, an automated counter should be capable of being adjusted, allowing it to identify the number of viable cells in the same way that the user would normally work when employing a haemocytometer and microscope for this task.
The same principle applies if a new instrument is being used to replace an existing automated counting system. It must be able to count the number of viable cells in the same way as the automated counting system it is replacing, or at least be adjustable to accommodate this existing method.
Should the automated cell counter not be adaptable enough in its counting method, it will return a different cell concentration result to the previous method used with the same sample of cells. This, of course, can potentially affect pharmacology experiment results or production yield.
The automated cell counter displayed in Figure 2 utilizes imaging alongside a series of user-adjustable parameters to ascertain which cells are and are not viable. The counter enables the user to review each image taken, with the analyzer in this example being set to take 50 images before averaging the results.
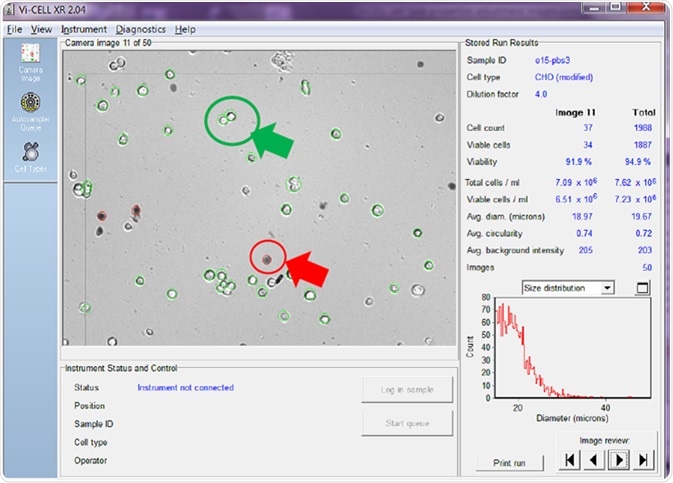
Figure 2. Viable cells are circled in green and non-viable in red. Image Credit: Beckman Coulter Life Sciences
The cell counter identifies viable cells by circling them in green, while non-viable cells are circled in red.
The right-hand side of the screenshot shows the counter calculating the total cell count/mL, with the total viable cell count/mL displayed for both the image being reviewed alongside an average of all of the images taken.
The automated counter should be adjustable to accommodate the following cell attributes:
- Cell minimum diameter
- Cell maximum diameter
- Cell brightness
- Cell sharpness
- Viable cell spot area/size
- Cell circularity
- Cell decluster degree
The cell minimum and maximum diameter settings allow the user to select the size of cells that would normally be counted as being viable. Figure 3 highlights cell images that have been analyzed using a minimum cell diameter for viable cell identification of 6 microns.
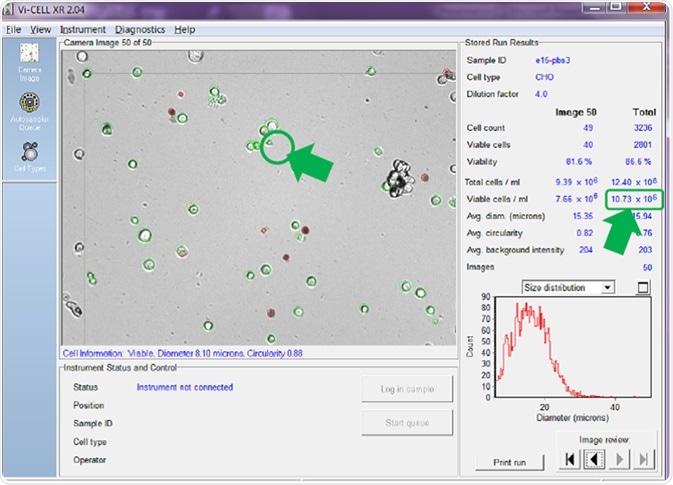
Figure 3. Minimum viable cell diameter set to 6 microns. Image Credit: Beckman Coulter Life Sciences
With the minimum diameter set to 6 microns, the cell counter counts small cells like the one circled, which possesses a diameter of just 8.10 microns (Figure 3). Using this setting, the counter has identified 10.73 x 10⁶ viable cells/mL - an average value across the 50 images.
If the minimum diameter is adjusted to 15 microns (prompting the counter to only count larger cells as viable) before re-analyzing the same set of recorded images, a very different cell concentration per mL is calculated and reported (Figure 4).
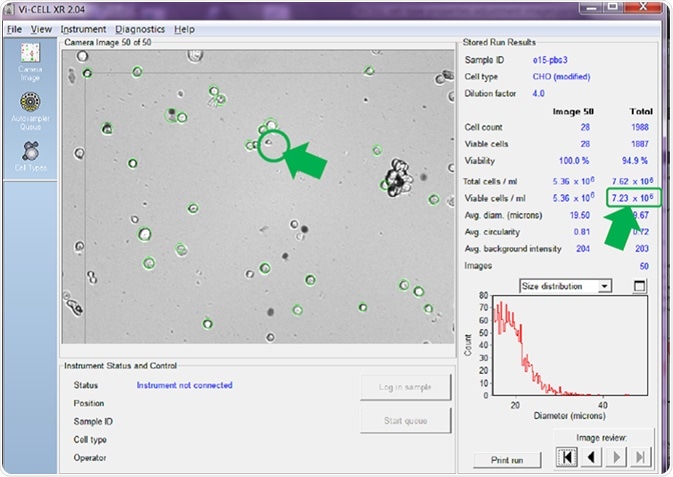
Figure 4. Same images re-analyzed with minimum viable cell diameter set. Image Credit: Beckman Coulter Life Sciences
A comparison between Figure 3 and Figure 4 reveals that the counter has no longer identified the smaller cell in image number 50 as viable. This is confirmed by it not being circled in green.
There has also been a reduction in cells in the same set of images that are counted as viable, therefore reducing the average calculated viable cell concentration for all 50 images. Figure 3 reported 10.73 x 10⁶ viable cells/mL while Figure 4 reported just 7.23 x 10⁶ viable cells/mL - a difference of 3.5 x 10⁶ viable cells/mL, or a reduction of nearly 33%.
The cell brightness, cell sharpness and viable cell spot area/size settings are used to define how a viable cell is identified – for example, whether or not a slightly darker cell should be counted as viable or not.
The cell circularity option assists the counter in discriminating between cell debris and healthy, viable cells. This setting should be used with caution however, especially where viable cells of the cell type used are not naturally spherical in shape.
Lastly, the cell decluster degree setting defines whether the counter whether to count individual cells in a clump or cluster, towards to the total cell counts/mL, rather than counting the clump as a single cell.
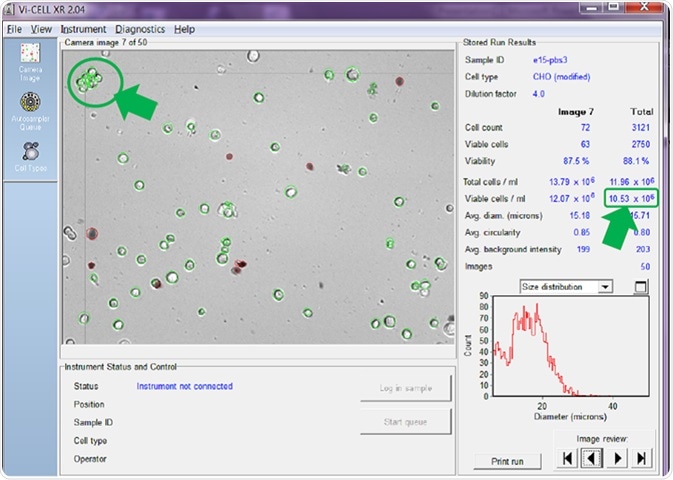
Figure 5. Counter set to count individual cells in clumps to 15 microns. Image Credit: Beckman Coulter Life Sciences
In Figure 5, the counter is set to attempt to count every cell in a clump as an individual cell. As can be seen, with this setting active, a viable cell concentration of 10.53 x 10⁶ cells/mL is reported.
The clump of cells arrowed in the top left of the image confirms that each individual cell has been circled in green, and therefore added to the overall viable cell count.
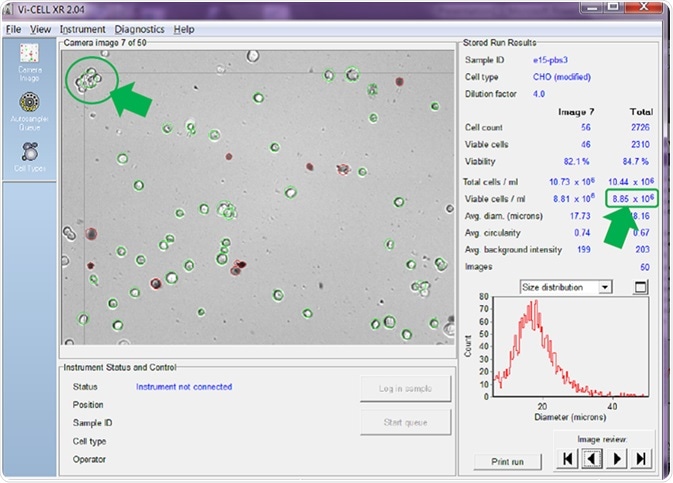
Figure 6. Counter set to count cells in clumps as one single cell. Image Credit: Beckman Coulter Life Sciences
If the counter is adjusted to count a clump of viable cells as a single cell before re-analyzing the same set of images, the answer is quite different (Figure 6).
The results very much depend on the number of cell clumps present in the sample, but, in the examples provided above, counting cells in clumps rather than regarding these as individual cells has reduced the reported total viable cell concentration from 10.53 x 10⁶ cells/mL (Figure 5) to 8.85 x 10⁶ cells/mL (Figure 6) - a reduction of around 16%.
This setting becomes increasingly important as the viable cell concentration increases, because this in itself will cause cells to become clumped together more frequently.
Working with a specific combination of the counter settings outlined above enables users to adjust the way the automated counter counts the cells, encouraging it to closely match the way the user would count using a microscope. Similarly, leveraging the options provided can provide a closer match to the count results of the older counter which the new, automated counter is replacing.
About Beckman Coulter Life Sciences
Beckman Coulter Life Sciences is dedicated to empowering discovery and scientific breakthroughs. The company’s global leadership and world-class service and support delivers sophisticated instrument systems, reagents and services to life science researchers in academic and commercial laboratories, enabling new discoveries in biology-based research and development.
A leader in centrifugation and flow cytometry, Beckman Coulter has long been an innovator in particle characterization and laboratory automation, and its products are used at the forefront of important areas of investigation, including genomics and proteomics.
Primary activity / Product lines
- Flow Cytometry
- Centrifugation
- Particle Counting and Characterization
- Liquid Handling and Robotics
- Nucleic Acid Sample Preparation
Sponsored Content Policy: News-Medical.net publishes articles and related content that may be derived from sources where we have existing commercial relationships, provided such content adds value to the core editorial ethos of News-Medical.Net which is to educate and inform site visitors interested in medical research, science, medical devices and treatments.