When manufacturing using bioprocesses for production, precise and reliable tools are required for monitoring and control of bioreactors. Many bioprocess engineers depend on a critical monitoring parameter, viable cell density. Although this parameter may appear simple, the basic principles affecting its measurement are slightly complex and can create unanticipated results.
However, one major concern shared by bioprocess manufacturers is instrument-to-instrument variability, which denotes the projected coefficient of variance of a measurement performed on two similar tools with two similar samples.
There are a number of factors which can result in instrument-to-instrument variability. These factors include pipetting errors, instrument service history, sample concentration and volume, sample temperature history, and underlying measurement principle, amongst others. Given that viable cell density is a compound parameter, the variability of each of the key measurements, i.e. viability and concentration, should be considered individually.
Amongst the various methods available for cellular viability measurement, the trypan blue analysis is a popular and validated method. This article recommends best practices to reduce instrument-to-instrument variability for Beckman Coulter’s Vi-CELL automated cell viability analyzer and also shows what degree of variability can be anticipated in almost ideal conditions.
Sample Preparation
The Vi-CELL cell viability analyzer performs sample preparation and sample analysis. Its user-friendly design makes it easy to load and analyze several types of cells. Reagents are premade and discarded automatically. In this analysis, operators must simply ensure that reagents are loaded and that a sample of more than 0.500mL is loaded into a cup.
As and when the sample carousel turns around, cells that are suspended are aspirated and combined with suitable quantities of trypan blue stain and other reagents to ensure consistent measurements. Additionally, the number of aspiration cycles can be modified so that the cell aggregates break away which can otherwise lead to incorrect results. Schematic of the sample preparation process is shown in Figure 1.
Figure 1. Schematic of the sample preparation process. Image credt: Beckman Coulter
Sample Analysis
For sample analysis, software algorithms are used that examine cell images and utilize a wide range of parameters to ascertain the presence of cells and also to determine whether these cells are viable or not. After a cell boundary is detected, the pixels within that boundary are analyzed by the software to determine if the cell has been stained with trypan blue. When all the cell boundaries have been classified as stained or unstained, the instrument reports total viability and total cell concentration. A schematic of the image analysis process is shown in Figure 2.
Figure 2. Schematic of the image analysis process. Image credt: Beckman Coulter
Users can also customize cell types within the Vi-CELL software. The most appropriate way to improve sample analysis is to select a default cell type and check the precision of the viability and count measurements via visual analysis of the individual image. Also, the image analysis parameters should remain consistent so that there is a good agreement between the instruments. A screen shot of the cell type menu is shown in Figure 3.
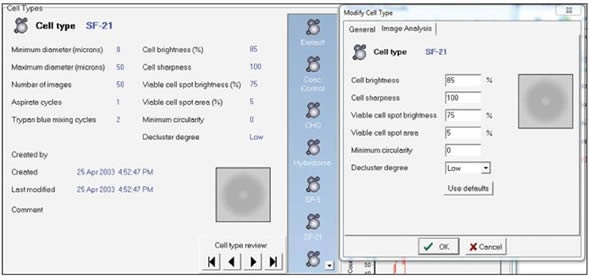
Figure 3. Screen shot of the cell type menu. Image credt: Beckman Coulter
Understanding Viable Cell Density
Viable cell density arises from the measurement of the cell concentration and the total cellular viability.
Cellular viability expressed as a percentage (viability) x total cellular concentration expressed as cells per mL (conc.) = viable cell density (VCD)
From the above theory of error propagation, the projected variance for the compound variable is quantified as follows, where Pxy is the correlation coefficient between x and y variables, and Gx is the standard deviation of the x variable.
Cell Concentration
Cellular concentration is a more complex parameter to determine with low variance. A number of factors such as cellular debris and uniformity of cellular suspension can contribute to measurement error. For example, for a total cellular concentration of approximately 2.83x10⁶ cells per mL, there may be a total of 40 cells in each image, which means only 2,000 cells were actually counted.
On the other hand, this number is much higher when compared to the number of cells counted with hemacytometers and slide-based systems. This is because the Vi-CELL cell viability analyzer utilizes a constantly flowing sample and hence is able to analyze a larger volume than other standard systems.
Cell Viability
Measurement of the cell viability involves fewer sources of error, because it is mainly based on determining the ratio of stained to unstained cells. However, this ratio should be the same even when there are variations in the total number of cells. The Vi-CELL instrument is designed to reduce the major sources of variance in cell viability.
Evaluation of Instrument-to-Instrument Variability for Viability and Concentration
The Vi-CELL automated cell viability analyzer can provide reliable results both in cell viability and total cell concentration measurements. To demonstrate the capability of this instrument, a range of experiments were performed to test three types of systems. Concentration controls from Beckman Coulter, viability and concentration controls from a third party source, and live Chinese hamster ovary (CHO) cells were tested in all the three systems.
Methods and Materials
Materials included were three Vi-CELL instruments, which were serviced and calibrated by means of Vi-CELL concentration control. This Vi-CELL concentration control was then tested on all the three systems for 20 measurements each, with each measurement containing 50 images per sample. Next, three Viacheck concentration controls were used, and 10 repetitions were carried out on each instrument for the concentration controls. Then, five Viacheck Viability controls were utilized, and 4 repeat samples were tested for each experiment for the viability controls. CHO cells at three different viabilities were obtained and their viability was modified. A total of 10 samples per cell type per instrument were examined. For data analysis, the standard and mean deviation of each instrument was determined, including the coefficient of variance of all means, and the mean of all means.
Results and Discussion
Overall, the three Vi-CELL systems provided reliable results. It should be noted that the increased and average sample size have a major impact on the final variance. The differences in each measurement can be due to those described above.
Nevertheless, the coefficient of variance of means is merely 5.9% for this sample and this proves that accurate measurements are possible when suitable methods are employed. Also, the averaged measurements are tighter when compared to the coefficient of variance claimed by bead producers.
Most importantly, it should be noted that the coefficients of variance in case of cell viability are usually less than the coefficients of variance from the total cell concentration.
Recommendations
The following parameters have been proposed to alleviate concerns over instrument-to-instrument variability:
- Precise and consistent image processing parameters must be used
- Each sample should have the same handling history
- Multiple measurements should be performed whenever possible
- Orthogonal technique should be used to cross check results
- Instruments should be serviced regularly
Conclusion
The Vi-CELL automated cell viability analyzer shows excellent instrument-to-instrument comparisons based on the large number of different samples. Nevertheless, important recommendations must be followed to reduce variability. Ideal results can thus be obtained by gaining a better insight into the different variability factors affecting viability and total cell concentration.
 About Beckman Coulter
Beckman Coulter develops, manufactures and markets products that simplify, automate and innovate complex biomedical tests. More than a quarter of a million Beckman Coulter instruments operate in laboratories around the world, supplying critical information for improving patient health and reducing the cost of care.
Sponsored Content Policy: News-Medical.net publishes articles and related content that may be derived from sources where we have existing commercial relationships, provided such content adds value to the core editorial ethos of News-Medical.Net which is to educate and inform site visitors interested in medical research, science, medical devices and treatments.