Single-cell OMICs have gained significant momentum in recent years, largely due to the development of pioneering mass spectrometry tools with high sensitivity levels.
These developments are timely and important because recent discoveries have shown that morphologically and even genetically identical cells exhibit considerable heterogeneity on a transcriptomic, metabolomic, proteomic, and lipidomic level.
Single-cell analysis is becoming increasingly key to probing population heterogeneity, allowing researchers to answer previously unanswerable biological questions. Unlike transcriptomic approaches, which rely on signal amplification, mass spectrometry-based lipidomic or metabolomic approaches are still relatively new.
This article examines the feasibility of performing single-cell lipidomics on the Xevo™ MRT MS. This instrument offers excellent dynamic range and sensitivity, enabling the accurate identification of lipids in single-cell MS experiments.
Experimental
Sample preparation
THP-1 was cultivated in a 75 mL flask containing RPMI-1640, 10% fetal bovine serum (FBS), 1% Sodium Pyruvate, 1% Non-Essential Amino Acids, 1% Glutamax, and 1% Kanamycin. The flask was incubated at 37 °C and 5% CO2.
A total of 20 µL of THP-1 cells was collected before being added to trypan blue (0.4%, 20 µL). Cells were counted using a disposable hemacytometer (C-CHIP DHC-N01, NanoEntek) before harvesting via centrifugation and washing with DPBS twice. They were then diluted to a density of 1x10⁶/mL.
The cells were centrifuged, and the supernatant was removed before centrifugation and removal of residual DPBS.
Bulk THP-1 cells were extracted in IPA containing 100 ng/ml EquiSPLASH™ (Avanti Lipids) to achieve a final concentration of 5000 cells/µL.
This was shaken on a shaker set to 800 RPM and maintained at a temperature of 5 °C for 1 hour. The pellet was then vortexed and returned to the shaker for 1 hour before being centrifuged at 12,000 RPM for 6 minutes.
The supernatant was then transferred to a TruView™ LCMS total recovery vial (Waters, p/n: 186005669CV) before the sample was further diluted to 500, 50, 5, and 0.5 cells/µL concentrations.
Liquid chromatography (LC)
LC analysis was completed using an ACQUITY™ Premier LC System fitted with a binary solvent manager, column heater, and sample manager. Chromatographic separations were done using Waters ACQUITY™ Premier UPLC™ C18 CSH™, 1.7 µm, 2.1 x 100 mm (p/n: 186009461).
The mobile phase was made up of 60:39:1 ACN:Water:1M ammonium formate +0.1% Formic Acid (A) and 90:9:1 IPA:ACN:1M ammonium formate +0.1% formic acid (B). An active gradient of 10 minutes was used, with a total run time of 12 minutes.
The sample manager was set to a temperature of 8 °C, while the column heater was at 55 °C. The column was directly attached to the probe instead of connecting this via the switching valve. A total of 2 µL of the THP-1 cell dilution was injected onto the column.
Table 1. 12-minute UPLC gradient for CSH, 1.7 µm, 2.1 x 100 mm. Source: Waters Corporation
| # |
Time (mins) |
Flow (ml/min) |
% A |
% B |
Curve |
| 1 |
Initial |
0.40 |
50 |
50 |
Initial |
| 2 |
0.5 |
0.40 |
47 |
53 |
6 |
| 3 |
4.0 |
0.40 |
45 |
55 |
6 |
| 4 |
7.0 |
0.40 |
35 |
65 |
6 |
| 5 |
7.5 |
0.40 |
20 |
80 |
1 |
| 6 |
10.0 |
0.40 |
1 |
99 |
6 |
| 7 |
11.0 |
0.40 |
1 |
99 |
1 |
| 8 |
12.0 |
0.40 |
50 |
50 |
1 |
Mass spectrometry (MS)
MS analysis was completed using the Xevo™ MRT MS, with the MS operated with electrospray ionization set to positive (ESI+) ion mode. Capillary voltage was set to 2.8 kV, cone voltage was set to 40 V, source temperature was set to 120 °C, and desolvation temperature was set to 500 °C.
A cone gas (N2) flow rate of 50 liters per hour and a desolvation gas flow rate of 750 liters per hour were used. The acquisition rate was set to 10 Hz, and data were acquired as an MSE continuum.
The quadrupole was operated in manual profile (400, 600, 850 m/z), and lockmass (leucine enkephalin, m/z 556.27658) was delivered using an external pump at 10 µL per minute.
Table 2. MS parameters. Source: Waters Corporation
| MS system |
Xevo MRT |
| Ionization polarity |
Positive |
| Capillary voltage |
2.8 kV |
| Sampling cone |
40 V |
| Source temperature |
120 °C |
| Desolvation temperature |
500 °C |
| Cone gas flow |
50 L/Hr |
| Desolvation flow |
750 L/Hr |
| StepWave mode |
Default transmission |
| Data format |
MSE continuum |
| Acquisition range |
50-1200 Da |
| Quadrupole |
Manual profile - 400, 600, 850 m/z |
| Scan speed |
10 Hz |
| Fragmentation CE |
20-40 eV (ramp profile) |
Data analysis
The mzML files were imported into Lipostar (v 2.1.7b3 x64). This was completed with a peak picking threshold of 20,000 and 45,000 for MS and MS2, respectively. Data was searched against either the in-house Waters™ database or the Lipid Maps database (LMSD). Default settings for scoring, with any non-identified compounds filtered out of the analysis.
Compound measurements acquired via this method were exported before being imported into MetaboAnalyst for further statistical analysis and data visualization.5
Results and discussion
Cells were extracted in triplicate with IPA containing 100 ng/ml EquiSPLASH. These were then diluted over 5 orders of magnitude to achieve 1, 10, 100, 1000, and 10,000 cells per injection.
Blanks were also prepared, featuring 100% IPA and EquiSPLASH at 100 ng/ml. These were analyzed using an Xevo™ MRT MS coupled to an ACQUITY™ Premier UPLC operating on the waters_connect™ software platform.
Data was exported in mzML format before processing via Lipostar. This was done using an in-house lipid maps database (LMSD).
Plumb et al. (2020) have previously described the rapid 12-minute LC method used here, which was coupled with MSE acquisition at 10 Hz on the Xevo™ MRT MS.
This approach offered impressive sensitivity at the single-cell level, and because mzML export was written into the acquisition method editor, it was possible to easily transfer and analyze data on a range of third-party applications.
Data acquired on the Xevo™ MRT via Lipostar can be directly accessed using the API client configuration, or mzML files can be imported in the manner described here.
Lipostar processed data with a blank filter, with variables annotated using the selected database. Lipostar allows users to filter lipid annotations by the overall confidence score, which is derived from the weighted average of accurate mass, fragmentation, and isotope pattern.
Identifications with a high confidence score were exported, with lipids removed where these were identified from the standard sample (EquiSPLASH 100 ng/ml) and found to have a peak area > peak area in 1 cell.
Figure 1 shows the average number of identified curated lipids for the triplicate injections of THP-1 extracted cells. These were found to range from 496 (in-house DB)/692 (LMSD) for 10,000 cells to 136 (in-house DB)/169 (LMSD) for a single cell.
Both databases resulted in the most significant increase in identifications between 100 and 1,000 cells (79–82% increase), suggesting that a bulk sample of 1,000 cells is enough to create a database for this cell line. This number also complements lipid identification for more diluted samples, such as a single cell.
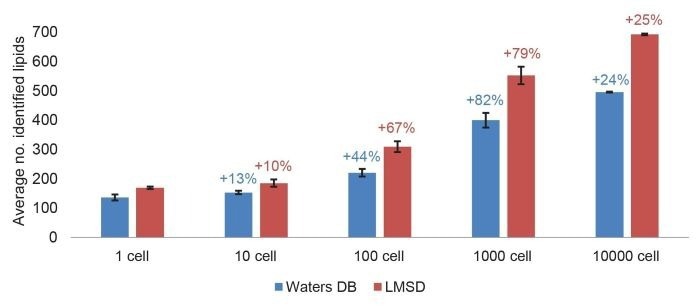
Figure 1. Average number of identified lipids in a THP-1 cell dilution. Annotated using Lipostar with an in-house database and LMSD, annotations with ≥2 confidence level were analyzed. Lipids identified in the standard (EquiSPLASH 100 ng/mL) with a peak area > peak area in 1-cell were removed. Standard deviation bars are plotted. The percentage increase in the number of identifications across the dilution series is denoted in the text. Image Credit: Waters Corporation
It was possible to track lipids over five orders of magnitude from 10,000 cells to a single cell equivalent, showcasing the extended dynamic range of the Xevo™ MRT MS. Figure 2 visualizes this assertion with the lipid PC (36:2).
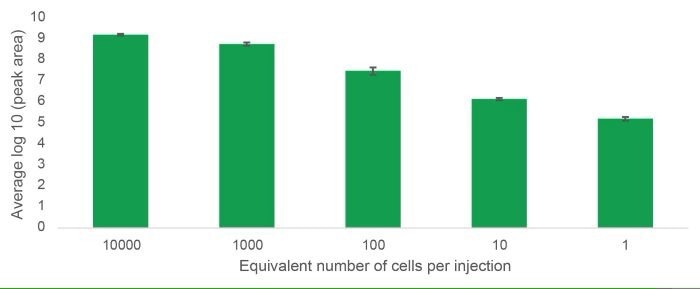
Figure 2. The average log10 peak area of the lipid PC (36:2) from triplicate injections of THP-1 cells diluted over five orders of magnitude from 10,000 cells to the equivalence of one cell. Image Credit: Waters Corporation
Raw MS1 spectra were visualized in the LC-MS toolkit application, revealing clearly defined peaks both at the 100-cell and single-cell levels (Figure 3). Mass accuracy was also found to be consistently below 500 ppb, ensuring this lipid's reliable, robust identification.
The Xevo™ MRT MS achieves excellent mass accuracy at extremely low concentrations, vastly reducing the number of tentative annotations. Combined with MS2 fragmentation data, these powerful capabilities afford analysts new confidence in returned identifications.
![(Top) MS1 spectrum of PC (36:2) from a 100-cell injection showing its isotopic distribution. (Bottom left) MS1 [M+H]+ peak of PC (36:2) detected in 100 cells (280 ppb). (Bottom right) MS1 [M+H]+ peak of PC (36:2) detected in the equivalence of a single cell (90 ppb). Acquired on the Xevo MRT MS and visualized in LC-MS toolkit (waters _connect). Expected [M+H]+ of PC (36:2)=786.60073](https://www.news-medical.net/images/appnotes/ImageForAppNote_5674_17453842696984423.jpg)
Figure 3. (Top) MS1 spectrum of PC (36:2) from a 100-cell injection showing its isotopic distribution. (Bottom left) MS1 [M+H]+ peak of PC (36:2) detected in 100 cells (280 ppb). (Bottom right) MS1 [M+H]+ peak of PC (36:2) detected in the equivalence of a single cell (90 ppb). Acquired on the Xevo MRT MS and visualized in LC-MS toolkit (waters _connect). Expected [M+H]+ of PC (36:2)=786.60073. Image Credit: Waters Corporation
Lipostar could also be used to further interrogate fragment ions and database matching of identified lipids. For example, Lipostar software identified the feature at [email protected] with a confidence level of three stars (74.33), determining this to be the [M+Na]+ adduct of the lipid PE(36:1).
The MS2 spectrum was identified with two matching fragment ions (627.533 and 341.304), with further probing of this spectrum via in silico fragmentation with MS/MS validator discovering a further 11 fragments that matched to this compound (Figure 4).
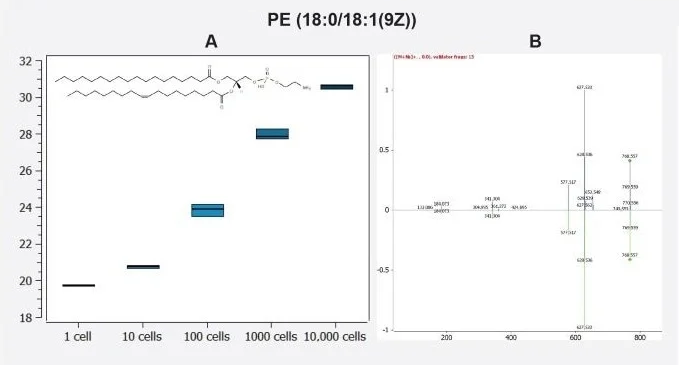
Figure 4. A) A box plot showing the log10 peak area of the lipid PE (36:1) from triplicate injections of THP-1 cells diluted over five orders of magnitude from 10,000 cells to the equivalent of 1 cell. B) Matched 13 MS2 fragments identified with MS/MS validator in the Lipostar Software. Image Credit: Waters Corporation
Conclusion
The study presented here showcased the potential of the Xevo™ MRT Mass Spectrometer coupled with an ACQUITY™ Premier LC for single-cell mass spectrometry, with more than 150 lipids routinely identifiable from samples comparable to a single cell.
The instrument’s excellent mass accuracy of less than 500 ppb affords its users a good degree of confidence in lipid identifications, especially when used in conjunction with the Lipostar software from Mass Analytica.
This powerful combination offers a seamless, robust pipeline suitable for the annotation and identification of lipids, as highlighted with PC (36:2) and PE (36:1) (Figure 3 and Figure 4, respectively).
The Xevo™ MRT MS offers excellent sensitivity over five orders of magnitude, representing an ideal solution for single-cell lipidomic analyses when paired with the powerful Lipostar software.
References and further reading
- Seydel, C. (2021). Single-cell metabolomics hits its stride. Nature Methods. https://doi.org/10.1038/s41592-021-01333-x.
- Carter, B. and Zhao, K. (2021). The epigenetic basis of cellular heterogeneity. Nature Reviews Genetics, (online) 22(4), pp.235–250. https://doi.org/10.1038/s41576-020-00300-0.
- Randolph, C.E., et al. (2023). Mass spectrometry-based single-cell lipidomics: Advancements, challenges, and the path forward. TrAC Trends in Analytical Chemistry, 169, pp.117350–117350. https://doi.org/10.1016/j.trac.2023.117350.
- Liebisch, G., et al. (2020). Update on LIPID MAPS classification, nomenclature, and shorthand notation for MS-derived lipid structures. Journal of Lipid Research, 61(12), pp.1539–1555. https://doi.org/10.1194/jlr.s120001025.
- Pang, Z., et al. (2024). MetaboAnalystR 4.0: a unified LC-MS workflow for global metabolomics. Nature Communications, (online) 15(1), p.3675. https://doi.org/10.1038/s41467-024-48009-6.
- Goracci, L., et al. (2024). MARS: A Multipurpose Software for Untargeted LC–MS-Based Metabolomics and Exposomics. Analytical Chemistry. https://doi.org/10.1021/acs.analchem.3c03620.
Acknowledgements
Produced from materials originally authored by Scarlet Ferrinho, Nyasha Munjoma, Preeti Mourya, Shazneil Briones, Lee A. Gethings, Robert S. Plumb, Oliver Cexus, and Paul A. Townsend.
About Waters Corporation
At Waters, we unlock the potential of science by solving problems that matter. Our software and instruments ensure the safety of the medicines we take, the purity of the food we eat and the water we drink, and the quality and durability of products we use every day. Together with our customers, in labs around the world, we deliver scientific insights to improve human health and well-being, helping to leave the world better than we found it.
Sponsored Content Policy: News-Medical.net publishes articles and related content that may be derived from sources where we have existing commercial relationships, provided such content adds value to the core editorial ethos of News-Medical.Net which is to educate and inform site visitors interested in medical research, science, medical devices and treatments.