Sponsored Content by SCIEXReviewed by Maria OsipovaAug 5 2026
This article introduces a sensitive approach for peptide quantitation in extracted rat plasma using a nanoflow LC- Zeno MRMHR method. Peptide quantitation as low as 2.5 attomoles on column for the lower limit of quantitation (LLOQ) was reached (Figure 1), with exceptional precision, linearity, and reproducibility.
Background
As the pharmaceutical sector transitions toward increasingly potent peptide drugs, discovery-phase bioanalysis faces the dual challenge of stringent sensitivity requirements and limited sample availability. Nanoflow LC allows for improved ionization efficiency, delivering a robust strategy for achieving enhanced detection sensitivity, especially for low-abundance peptides.
In parallel, high-resolution mass spectrometry (HRMS), with its superior mass precision and resolving power, enables more effective discrimination between target analytes and interfering background components. This ability substantially minimizes matrix-related interferences, thus enhancing quantitative precision and analytical robustness.
Combining nanoflow ionization with HRMS provides an attractive solution for dependable, sensitive, and precise peptide quantitation in intricate biological matrices.
In this study, the ZenoTOF 8600 system was used to quantitate a series of synthetic peptides in matrix. Several hardware enhancements to the ion source, the front end of the mass analyzer, and an advanced optical detector considerably improved the MS/MS sensitivity and %CV for low-level quantitation.
This article outlines the application of the Zeno MRMHR approach to assess sensitivity and specificity for peptide quantification on an HRMS platform.
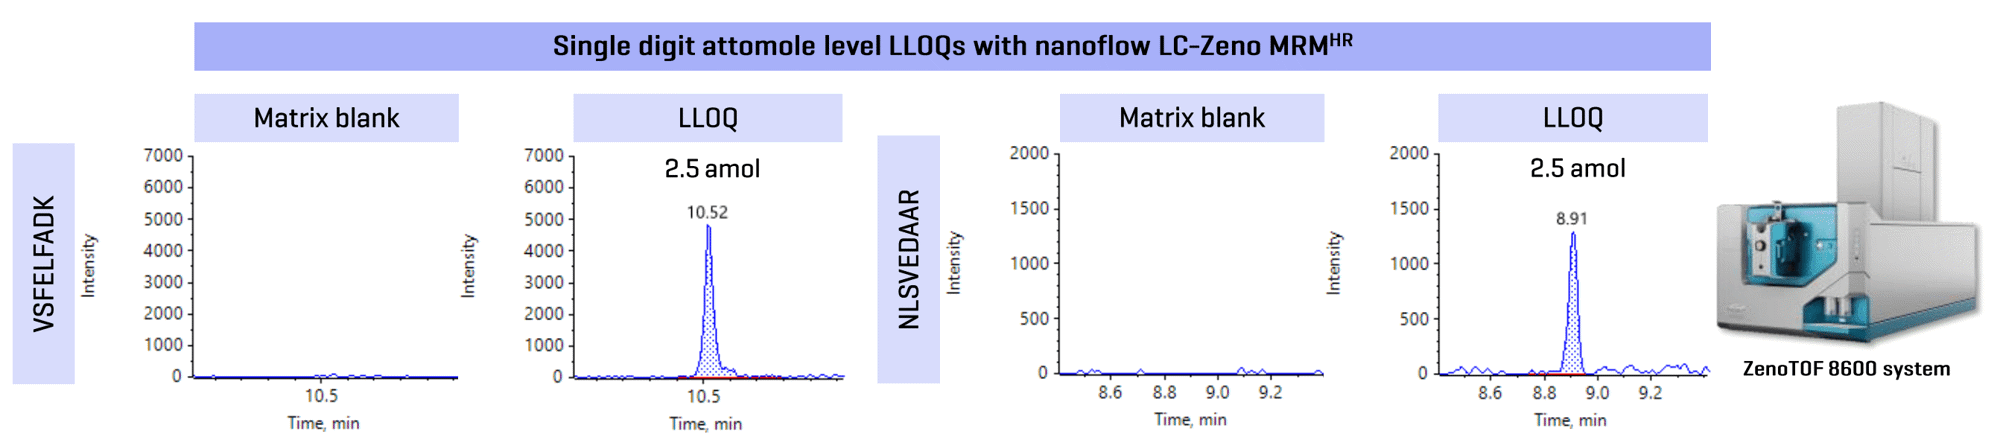
Figure 1. Representative extracted ion chromatograms (XICs) of matrix blanks and LLOQ samples for peptides VSFELFADK and NLSVEDAAR are shown. No matrix interferences were observed at the retention time of the analyte. Image Credit: SCIEX
Key advantages of nanoflow-based peptide quantitation via the ZenoTOF 8600 system
- Elevated sensitivity quantitation at nanoflow rate: Achieve an LLOQ as low as 2.5 amol for peptide quantitation with the ZenoTOF 8600 system.
- Sophisticated hardware upgrades for enhanced ion transmission efficiency: Attain remarkable sensitivity for peptide quantitation with advanced front-end technology, delivering outstanding performance on the ZenoTOF 8600 system.
- Satisfy crucial quantitative performance standards: Reach precise quantitative performance with %CV <5% across all concentration levels over an LDR of up to 4.8 orders of magnitude.
- Simplified data management: Easily acquire, process, and manage data using SCIEX OS software on a single platform.
Introduction
Peptide quantitation in therapeutic discovery is driven by the need to identify low-level peptides in minimal sample volumes and highly intricate biological matrices. During peptide evaluation, co-eluting matrix constituents can introduce substantial interferences, resulting in ion suppression, reduced analytical selectivity, and decreased quantitative precision, especially for low-abundance analytes.
HRMS delivers a powerful and effective approach for overcoming these challenges. Its superior mass precision and resolving power enable accurate discrimination between target peptides and closely related matrix-derived ions that are indistinguishable at lower resolution.
By effectively minimizing matrix-related background contributions, high-resolution detection improves selectivity, enhances data robustness, and boosts confidence in quantitative outcomes. For this reason, HRMS provides a practical and dependable approach for peptide evaluation in intricate biological matrices.
When combined with a low-flow strategy, such as nanoflow LC, this approach substantially improves ionization efficiency in mass spectrometry by minimizing the solvent flow entering the ion source.
At reduced flow rates, spray droplets formed during nebulization are smaller and experience more efficient desolvation, supporting enhanced ion formation compared to standard flow conditions. This highly efficient ionization procedure lowers ion suppression and increases the proportion of analyte ions transferred into the gas phase, improving sensitivity.
As a result, nanoflow ionization is especially useful for the detection and quantitation of low-abundance analytes in complex biological samples, particularly when sample amounts are restricted during the pharmaceutical discovery phase or in proteomics studies.
Methods
Sample preparation: Rat plasma samples underwent protein precipitation by adding methanol in threefold excess relative to the plasma volume. After vortex mixing, samples underwent centrifugation at room temperature to eliminate precipitated proteins.
The resulting clear supernatant was collected and diluted four-fold with a 2:2:0.1 (v/v/v) mixture of acetonitrile, acetic acid, and formic acid in water. A set of 10 peptides was then spiked into the diluted rat plasma extracts, followed by serial dilution to establish calibration curves for quantitative analysis.1
Nanoflow LC conditions: The M-Class system (Waters) was employed to separate analytes in direct-injection mode. A 1 μL sample was injected for analysis. The mobile phase A was composed of water with 0.1% formic acid in water, while mobile phase B consisted of 0.1% formic acid in acetonitrile.
Analytes were separated at an operating flow rate of 300 nL/min using an IonOpticks Aurora Elite C18 column (15 cm × 75 µm). The column oven temperature was configured to 60 °C. Table 1 illustrates the chromatographic conditions for analyte separation.
Table 1. Chromatographic conditions for analyte separation. Source: SCIEX
| Time [min] |
Mobile phase A [%] |
Mobile phase B [%] |
| 0 |
98 |
2 |
| 0.2 |
98 |
2 |
| 10 |
60 |
40 |
| 14 |
45 |
55 |
| 14.5 |
15 |
85 |
| 20 |
15 |
85 |
| 20.5 |
98 |
2 |
| 25 |
98 |
2 |
Mass spectrometry conditions: Samples were analyzed in triplicate. Method details, such as source and gas parameters and MS conditions, are as described in Table 2. Sample analysis was performed on the ZenoTOF 8600 system (SCIEX) using Zeno MRMHR, with an ion source configured for a <1 μL/min nanoflow electrode.
Table 2. Source and MS conditions on the ZenoTOF 8600 system. Source: SCIEX
| Parameter |
MS |
MS/MS |
| Scan mode |
TOF MS |
MRMHR |
| Polarity |
Positive |
| Nano gas 1 |
10 psi |
| Curtain gas |
35 psi |
| Nano cell temperature |
250 °C |
| Nano spray voltage |
2250 V |
| CAD gas |
7 |
| Start mass [m/z] |
300 |
100 |
| Stop mass [m/z] |
1500 |
1500 |
| Q1 resolution |
NA |
Unit |
| Accumulation time |
0.1 s |
0.01 s |
| Zeno trap |
N/A |
On |
| Zeno threshold |
N/A |
1000000 |
| Time bins to sum |
8 |
8 |
Data processing: Evaluation was performed using SCIEX OS software, version 4.0.0. The MQ4 algorithm was used to integrate peaks, and a 1/x2 weighting factor was applied for the quantification of all peptides in the peptide mixture. An XIC peak width of 0.05 Da was used for quantitation.
Quantitative performance for peptide analysis with the ZenoTOF 8600 system using a nanoflow LC
The quantitative performance of nanoflow LC with the ZenoTOF 8600 system was assessed by evaluating 10 peptides in extracted rat plasma. The peptide mixture was spiked into processed rat plasma at varying concentrations. Each concentration level underwent analysis in triplicate.
Samples were analyzed using Zeno MRMHR mode, which enables data acquisition over a range of fragment ions. This feature automatically selects and sums select fragment ions for optimal assay sensitivity through SCIEX OS software.2 For this research, the sum of three fragment ions was used to quantify all peptides.
As demonstrated in Figure 2, the on-column LLOQ for peptides GGPFSDSYR, VLDALQAIK, SADFTNFDPR, EGHLSPDIVAEQK, ESDTSYVSLK, GYSIFSYATK, FEDENFILK, and FSTVAGESGSADTVR were 7.1, 7.1, 7.1, 4.2, 12.7, 12.7, 7.6, and 7.6 amol, respectively.
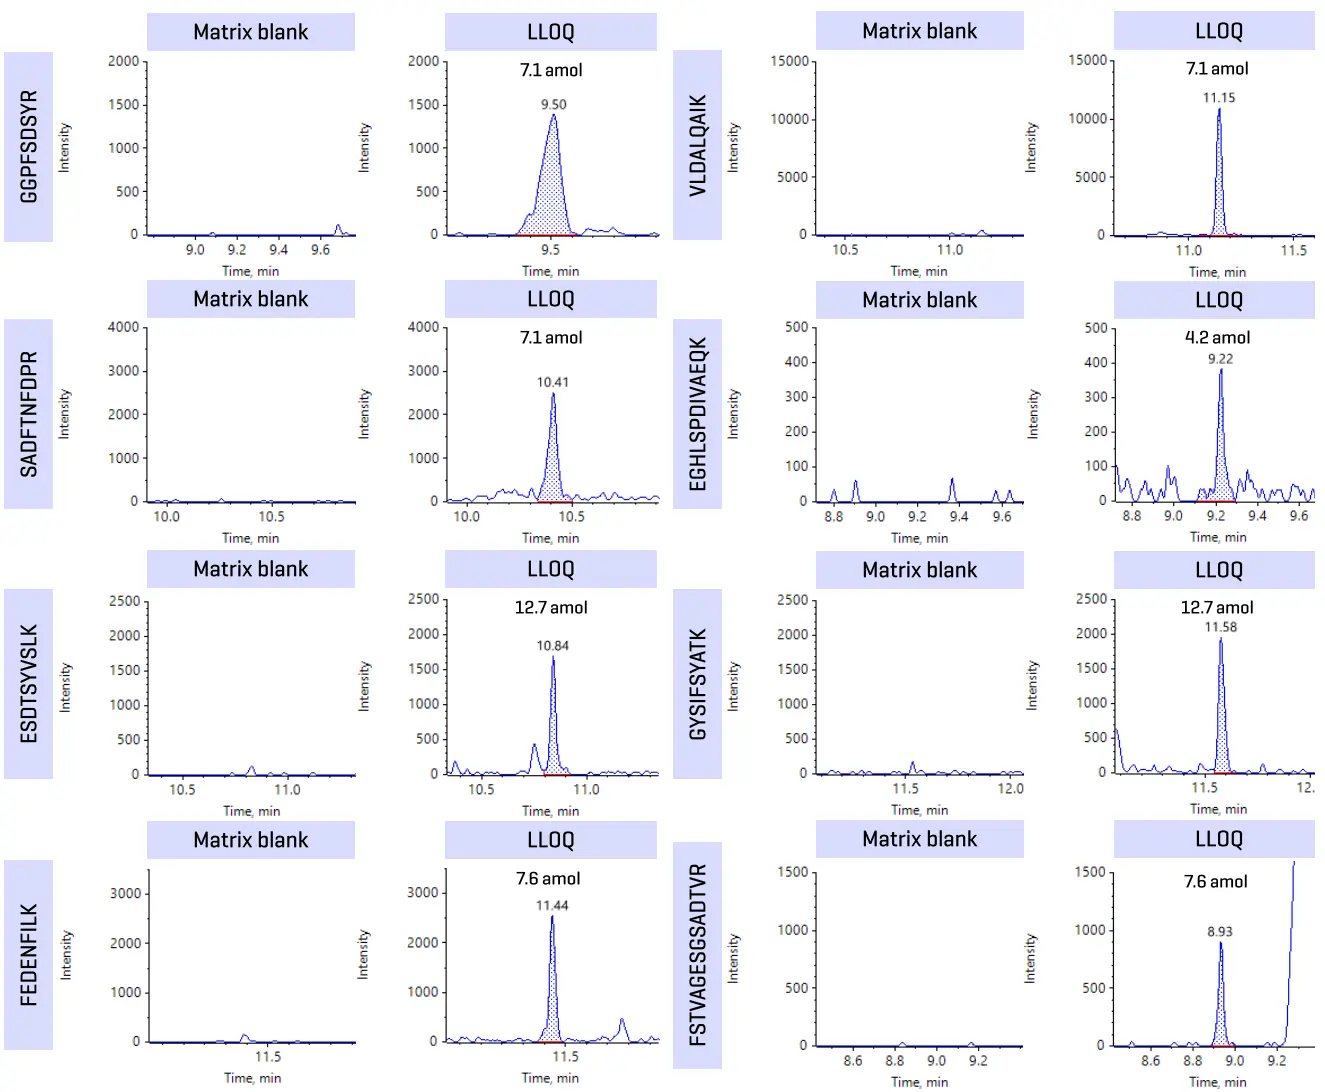
Figure 2. XICs of the matrix blank and LLOQ of 10 peptides in extracted rat plasma. A sum of three fragment ions was applied for quantitation for all peptides. Image Credit: SCIEX
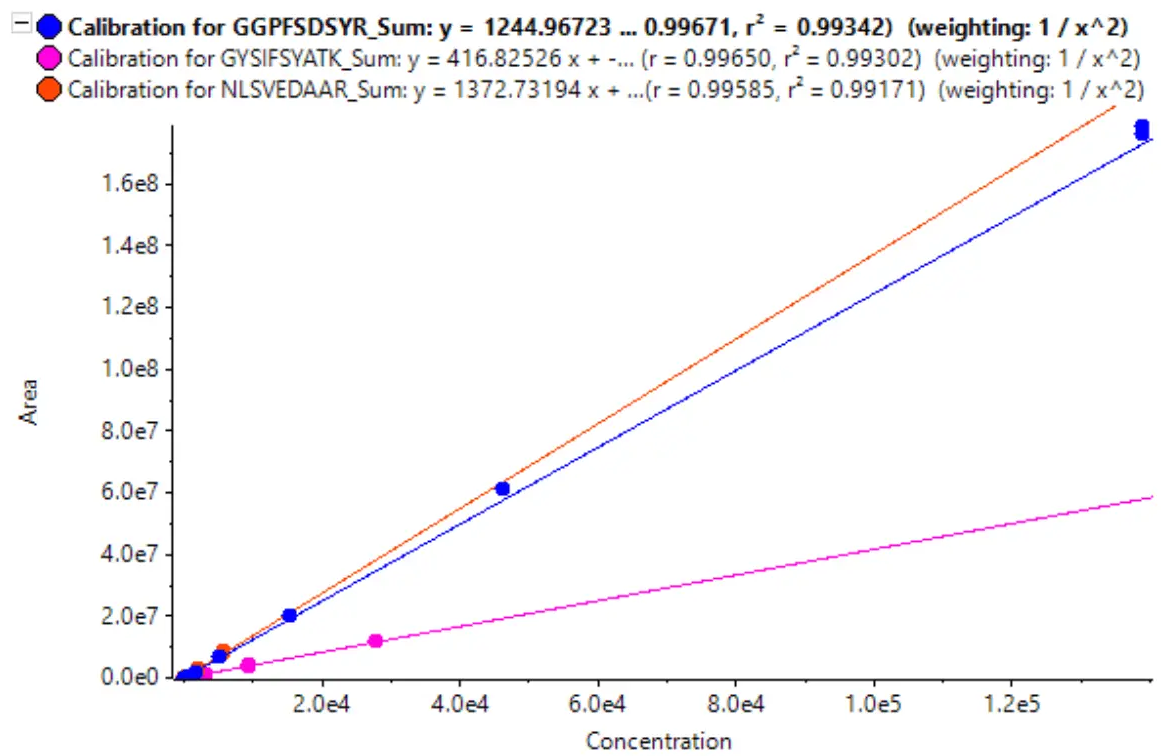
Figure 3. Calibration curves for quantifying three representative peptides with a weighing factor 1/x2 using nanoflow LC. Peptides GGPFSDSYR, GYSIFSYATK, and NLSVEDAAR showed a wide linear range where a sum of three fragment ions was applied for quantitation. Image Credit: SCIEX
Figure 3 presents calibration curves from the analysis of three representative peptides. Overall, an LDR of up to 4.8 orders of magnitude was achieved for peptide evaluation via nanoflow LC, highlighting the measurement of a wide variety of concentrations (Table 3).
For the bioanalytical performance assessment, the LLOQ was calculated based on criteria of %CV <20% and accuracy between 80% and 120%. For concentrations greater than the LLOQ, the %CV needed to be less than 15%, with accuracy between 85% and 115%.3 Figure 4 illustrates the precision and accuracy values for three example peptides across the measured linear range.
The computed concentrations for all calibration points were within ±13% of the nominal value, with %CV <5%, exhibiting high reproducibility. Low‑attomole sensitivity was attained for all 10 peptides in this research via nanoflow LC.
Overall, a highly sensitive technique for peptide quantitation was shown.
Table 3. Summary of the quantitative performance on the ZenoTOF 8600 system using nanoflow LC. Samples were analyzed in triplicate. Source: SCIEX
| Peptide IDL |
LOQ [amol] |
ULOQ [fmol] |
LDR [orders] |
| GGPFSDSYR |
7.1 |
138.9 |
4.3 |
| VLDALQAIK |
7.1 |
46.3 |
3.8 |
| SADFTNFDPR |
7.1 |
416.7 |
4.8 |
| EGHLSPDIVAEQK |
4.2 |
27.8 |
3.8 |
| ESDTSYVSLK |
12.7 |
83.3 |
3.8 |
| GYSIFSYATK |
12.7 |
27.8 |
3.3 |
| FEDENFILK |
7.6 |
5.6 |
2.9 |
| VSFELFADK |
2.5 |
5.6 |
3.3 |
| FSTVAGESGSADTVR |
7.6 |
5.6 |
2.9 |
| NLSVEDAAR |
2.5 |
5.6 |
3.3 |
|
Row |
Component name |
Actual concentration |
Num. values |
Mean |
Standard deviation |
Percent CV |
Average accuracy across replicates |
| ▶ |
1 |
GGPFSDSYR_Sum |
7.056 |
3 of 3 |
7.375 |
0.323 |
4.38 |
105. |
| |
2 |
GGPFSDSYR_Sum |
21.169 |
3 of 3 |
19.326 |
0.170 |
0.878 |
91.3 |
| |
3 |
GGPFSDSYR_Sum |
63.507 |
3 of 3 |
55.526 |
0.391 |
0.705 |
87.4 |
| |
4 |
GGPFSDSYR_Sum |
190.520 |
3 of 3 |
180.806 |
5.069 |
2.80 |
94.9 |
| |
5 |
GGPFSDSYR_Sum |
571.559 |
3 of 3 |
542.365 |
24.257 |
4.47 |
94.9 |
| |
6 |
GGPFSDSYR_Sum |
1714.678 |
3 of 3 |
1747.544 |
18.726 |
1.07 |
102. |
| |
7 |
GGPFSDSYR_Sum |
5144.033 |
3 of 3 |
5663.747 |
28.068 |
0.496 |
110. |
| |
8 |
GGPFSDSYR_Sum |
15432.099 |
3 of 3 |
16317.693 |
151.050 |
0.926 |
106. |
| |
9 |
GGPFSDSYR_Sum |
46296.296 |
3 of 3 |
49405.163 |
55.047 |
0.111 |
107. |
| |
10 |
GGPFSDSYR_Sum |
138888.889 |
3 of 3 |
142334.074 |
1118.885 |
0.786 |
102. |
|
Row |
Component name |
Actual concentration |
Num. values |
Mean |
Standard deviation |
Percent CV |
Average accuracy across Replicates |
| ▶ |
1 |
GYSIFSYATK_Sum |
12.701 |
3 of 3 |
13.159 |
0.647 |
4.92 |
104. |
| |
2 |
GYSIFSYATK_Sum |
38.104 |
3 of 3 |
35.492 |
1.245 |
3.51 |
93.1 |
| |
3 |
GYSIFSYATK_Sum |
114.312 |
3 of 3 |
102.603 |
3.907 |
3.81 |
89.8 |
| |
4 |
GYSIFSYATK_Sum |
342.936 |
3 of 3 |
319.897 |
23.429 |
7.32 |
93.3 |
| |
5 |
GYSIFSYATK_Sum |
1028.807 |
3 of 3 |
1058.271 |
20.737 |
1.96 |
103. |
| |
6 |
GYSIFSYATK_Sum |
3086.420 |
3 of 3 |
3191.891 |
34.831 |
1.09 |
103. |
| |
7 |
GYSIFSYATK_Sum |
9259.259 |
3 of 3 |
10181.114 |
324.751 |
3.19 |
110. |
| |
8 |
GYSIFSYATK_Sum |
27777.778 |
3 of 3 |
28880.915 |
485.652 |
1.68 |
104. |
|
Row |
Component name |
Actual concentration |
Num. values |
Mean |
Standard deviation |
Percent CV |
Average accuracy across replicates |
| ▶ |
1 |
NLSVEDAAR_Sum |
2.540 |
3 of 3 |
2.618 |
0.067 |
2.56 |
103. |
| |
2 |
NLSVEDAAR_Sum |
7.621 |
3 of 3 |
7.250 |
0.288 |
3.97 |
95.1 |
| |
3 |
NLSVEDAAR_Sum |
22.862 |
3 of 3 |
20.329 |
0.428 |
2.10 |
88.9 |
| |
4 |
NLSVEDAAR_Sum |
68.587 |
3 of 3 |
64.988 |
2.690 |
4.14 |
94.8 |
| |
5 |
NLSVEDAAR_Sum |
205.761 |
3 of 3 |
195.017 |
6.081 |
3.12 |
94.8 |
| |
6 |
NLSVEDAAR_Sum |
617.284 |
3 of 3 |
648.172 |
12.786 |
1.97 |
105. |
| |
7 |
NLSVEDAAR_Sum |
1851.852 |
3 of 3 |
1967.133 |
149.167 |
7.58 |
106. |
| |
8 |
NLSVEDAAR_Sum |
5555.556 |
3 of 3 |
6228.538 |
88.833 |
1.43 |
112. |
Figure 4. Quantitative performance of three representative peptides. Accuracy and precision successfully met the bioanalytical criteria across all concentration levels. For the analysis of peptides GGPFSDSYR, GYSIFSYATK, and NLSVEDAAR, a sum of three fragment ions was applied. Image Credit: SCIEX
Compliance-ready SCIEX OS software
The same capabilities for regulated bioanalysis in SCIEX OS software can be used on the ZenoTOF 8600 system, ensuring high fidelity during method transfers while maintaining crucial compliance features.
SCIEX OS software is a closed system that requires electronic record and signature storage in adherence to 21 CFR Part 11. SCIEX OS software can access raw data files from any visible storage location within a closed network through designated processing workstations.
Figure 5 depicts the SCIEX OS software features employed for audit trail monitoring, data acquisition and processing, and user access configuration. The audit trail feature allows critical user actions to be audited while locking in data integrity.
The central administrator console (CAC) feature enables acquisition and processing to be centralized on a single platform, maximizing efficiency for multi-instrument labs, regardless of compliance requirements. The configuration module permits users to assign roles and access as the administrator, method developer, analyst, and reviewer.
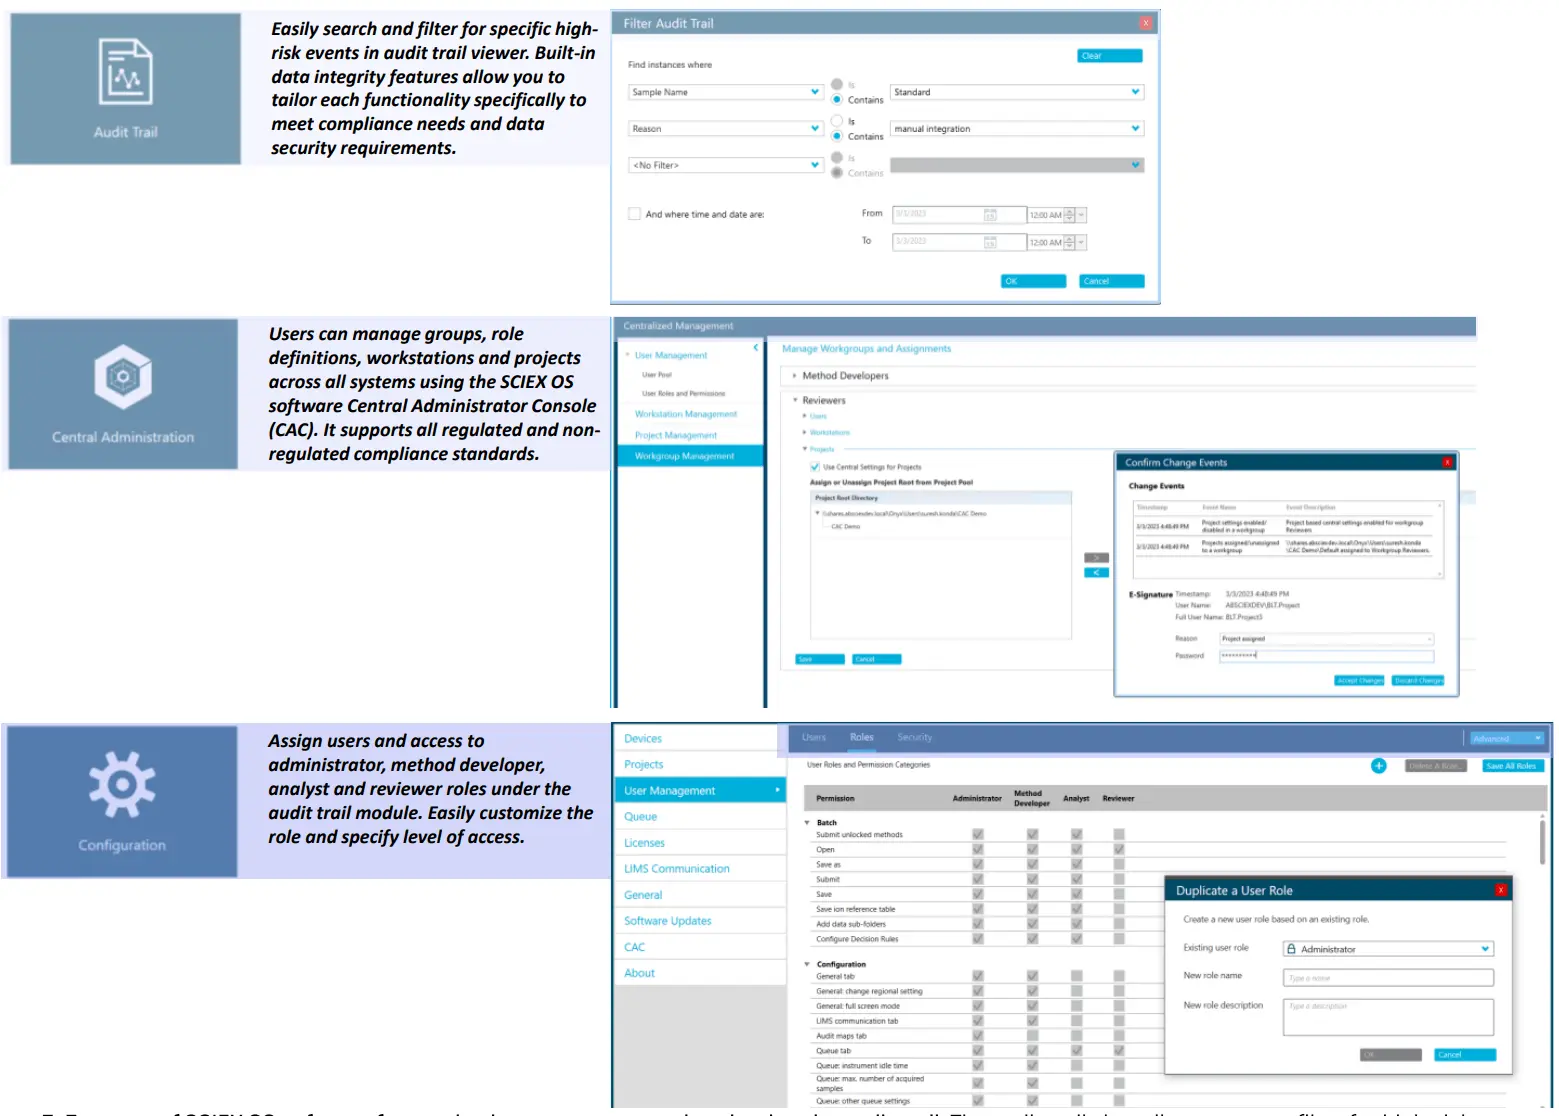
Figure 5. Features of SCIEX OS software for monitoring user access and evaluating the audit trail. The audit trail view allows users to easily filter high-risk events and enables data integrity features to meet compliance requirements. The software features a central administrator console (CAC) to manage users and groups, role definitions, workstations, and projects across all systems. The CAC feature supports both regulated and non-regulated compliance standards. The configuration module enables users to quickly set up roles and access levels for the administrator, method developer, analyst, and reviewer. Image Credit: SCIEX
Conclusions
- LLOQs as low as single-digit amol (on-column) levels were reached for peptide quantitation via nanoflow LC with the ZenoTOF 8600 system.
- A streamlined Zeno MRMHR strategy was exhibited by collecting multiple high-intensity product ions from TOF MS/MS spectra, which underwent automatic evaluation and summation with SCIEX OS software on the ZenoTOF 8600 system to optimize sensitivity.
- Precise quantitative performance was reached with %CV <5% across all concentration levels over an LDR of up to 4.8 orders of magnitude.
- Data management and compliance-readiness (21 CFR Part 11) capabilities were demonstrated through SCIEX OS software to facilitate quantitative evaluation on the ZenoTOF 8600 system.
Acknowledgments
Produced from materials originally authored by Pengyi Hou, Eshani Galermo, Dandan Si, Zhimin Long, Zoe Zhang, and Bingjie Liu, SCIEX, China; SCIEX, USA.
References and further reading
- SCIEX (2018). Enhanced sensitivity and quantitative performance featuring a novel quadrupole time of flight mass spectrometer. Available at: https://sciex.com/tech-notes/pharma/bioanalysis-pk/enhanced-sensitivity-and-quantitative-performance-featuring-a-novel-quadrupole-time-of-flight-mass-spectrometer.
- SCIEX (2018). Automated peptide fragment ion selection and summation for streamlined HRMS quantitative workflows. Available at: https://sciex.com/tech-notes/pharma/bioanalysis-pk/automated-peptide-fragment-ion-selection-and-summation-for-streamlined-hrms-quantitative-workflow.
- FDA (2018). Bioanalytical Method Validation Guidance for Industry. FDA. Available at: https://www.fda.gov/files/drugs/published/Bioanalytical-Method-Validation-Guidance-for-Industry.pdf.
About SCIEX
SCIEX mission is to deliver solutions for the precision detection and quantification of molecules, empowering its customers to protect and advance the wellness and safety of all.
SCIEX has led the field of mass spectrometry for 50 years. From the moment it launched the first ever commercially successful triple quad in 1981, SCIEX has developed groundbreaking technologies and solutions that influence life-changing research and outcomes.
Today, as part of the Danaher family of global life science and technology innovators, it continues to pioneer robust solutions in mass spectrometry and capillary electrophoresis. But SCIEX doesn’t just develop products. It is what the company does together with its customers that sets it apart. That’s why thousands of life science experts around the world choose SCIEX to get the answers they can trust to better inform critical decisions. Decisions that positively impact lives.
SCIEX stands proudly by its tagline: The Power of Precision.
Sponsored Content Policy: News-Medical.net publishes articles and related content that may be derived from sources where we have existing commercial relationships, provided such content adds value to the core editorial ethos of News-Medical.net, which is to educate and inform site visitors interested in medical research, science, medical devices and treatments.