As climate change drives rising temperatures, new research reveals that urban form and economic capacity will determine which cities adapt and which struggle when the world’s largest urban centers face dangerous heat.
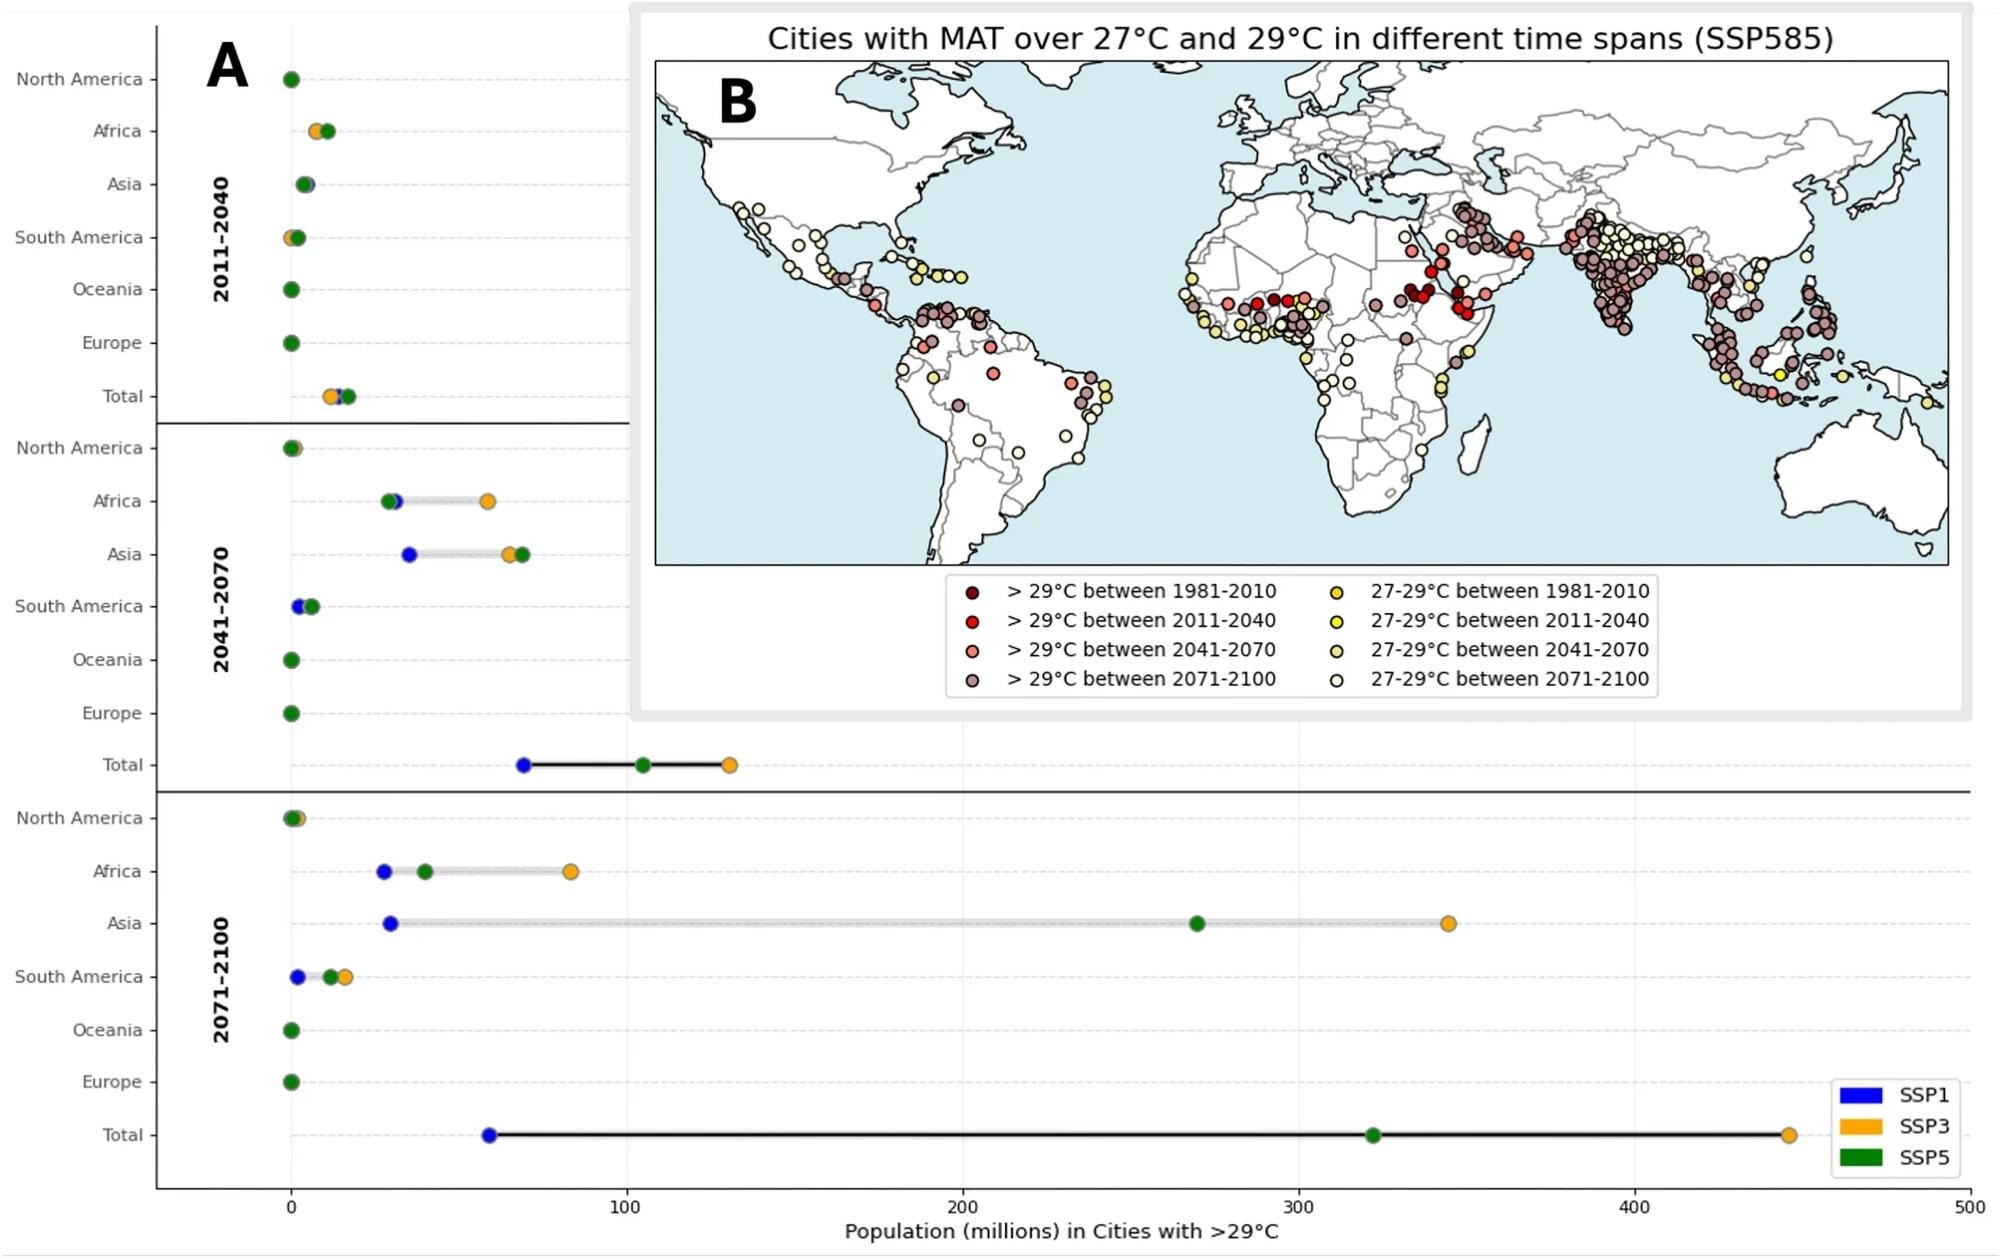
Population numbers and spatial distribution of cities exceeding a MAT of 29 degree Celsius. (A) Projected populations in cities with MAT >29 degree Celsius for different continents based on various climate projections. (B) Geographical distribution of cities with MATs between 27 and 29 and over 29 degrees according to SSP5-8.5. The figure and map were created using the code (Python 3.9 and the cartopy package) that can be found in the repository, as stated in the code availability statement.
A recent study, published in the journal Scientific Reports, quantified future urban heat exposure and adaptive measures for 1,563 large cities worldwide.
A majority of the global population has been living in cities since 2008. Urban areas show distinct warming dynamics, driven by high imperviousness and heterogeneous land use patterns, which amplify heat stress and strain urban infrastructures (public health systems, water supply, etc.). Urban residents, economies, and services are constantly affected by heat as a persistent background burden. Thus, mean annual temperature (MAT) could serve as an indicator of urban heat stress.
The climate-niche framework offers a concise tool for assessing where and when future warming will push cities beyond comfortable habitability conditions. While previous studies have projected climate niche through 2100 or assessed climate exposures for multiple cities over shorter horizons, they were often inconsistent, with no explicit assessment of adaptive capacity and limited treatment of intra-urban land cover heterogeneity.
About the study
In the present study, researchers quantified future urban heat exposure and adaptive capacity for 1,563 large cities. They utilized downscaled data from the Climatologies at high resolution for the Earth’s land surface areas (CHELSA) dataset to evaluate the future development of temperatures in cities. Temperature projections were derived using global climate model outputs under different shared socioeconomic pathway (SSP) scenarios.
Specifically, these scenarios were SSP5-8.5, SSP1-2.6, and SSP3-7.0, corresponding to different levels of emissions and mitigation efforts. SSP5-8.5 population projections were used for the primary analysis. Further, remote sensing-based morphological data of cities were integrated to spatially delineate cities worldwide in a consistent manner. This approach connects heat exposure not only to climate scenarios but also to a city's physical form and its economic capacity to act. A MAT threshold of 29 °C was used as a benchmark to identify populations and cities outside the human climate niche, with 27 °C included as a sensitivity threshold due to its link to a sharp rise in lethal heat exposure.
The spatial distribution of temperature changes and projected populations in cities that are expected to experience extreme temperatures was analyzed for the periods 2011-2040, 2041-2070, and 2071-2100. To investigate the influence of urban morphology on extreme temperature outcomes, different groups of local climate zones (LCZs) that share similar characteristics between cities projected to exceed the benchmark threshold were compared to those that do not.
Findings
Temperature increases exhibited significant regional variations. European cities showed the strongest trends of warming in all scenarios. Over half of European cities were projected to have a MAT increase of > 4.1 °C by 2100 based on SSP5-8.5. Cities in North America exhibited a rise of 4 °C, and Asian cities showed a slightly lower increase at 3.8 °C. African and South American cities exhibited relatively lower temperature increases of 2.7 °C and 3.2 °C, respectively, although their baseline temperatures are already significantly higher.
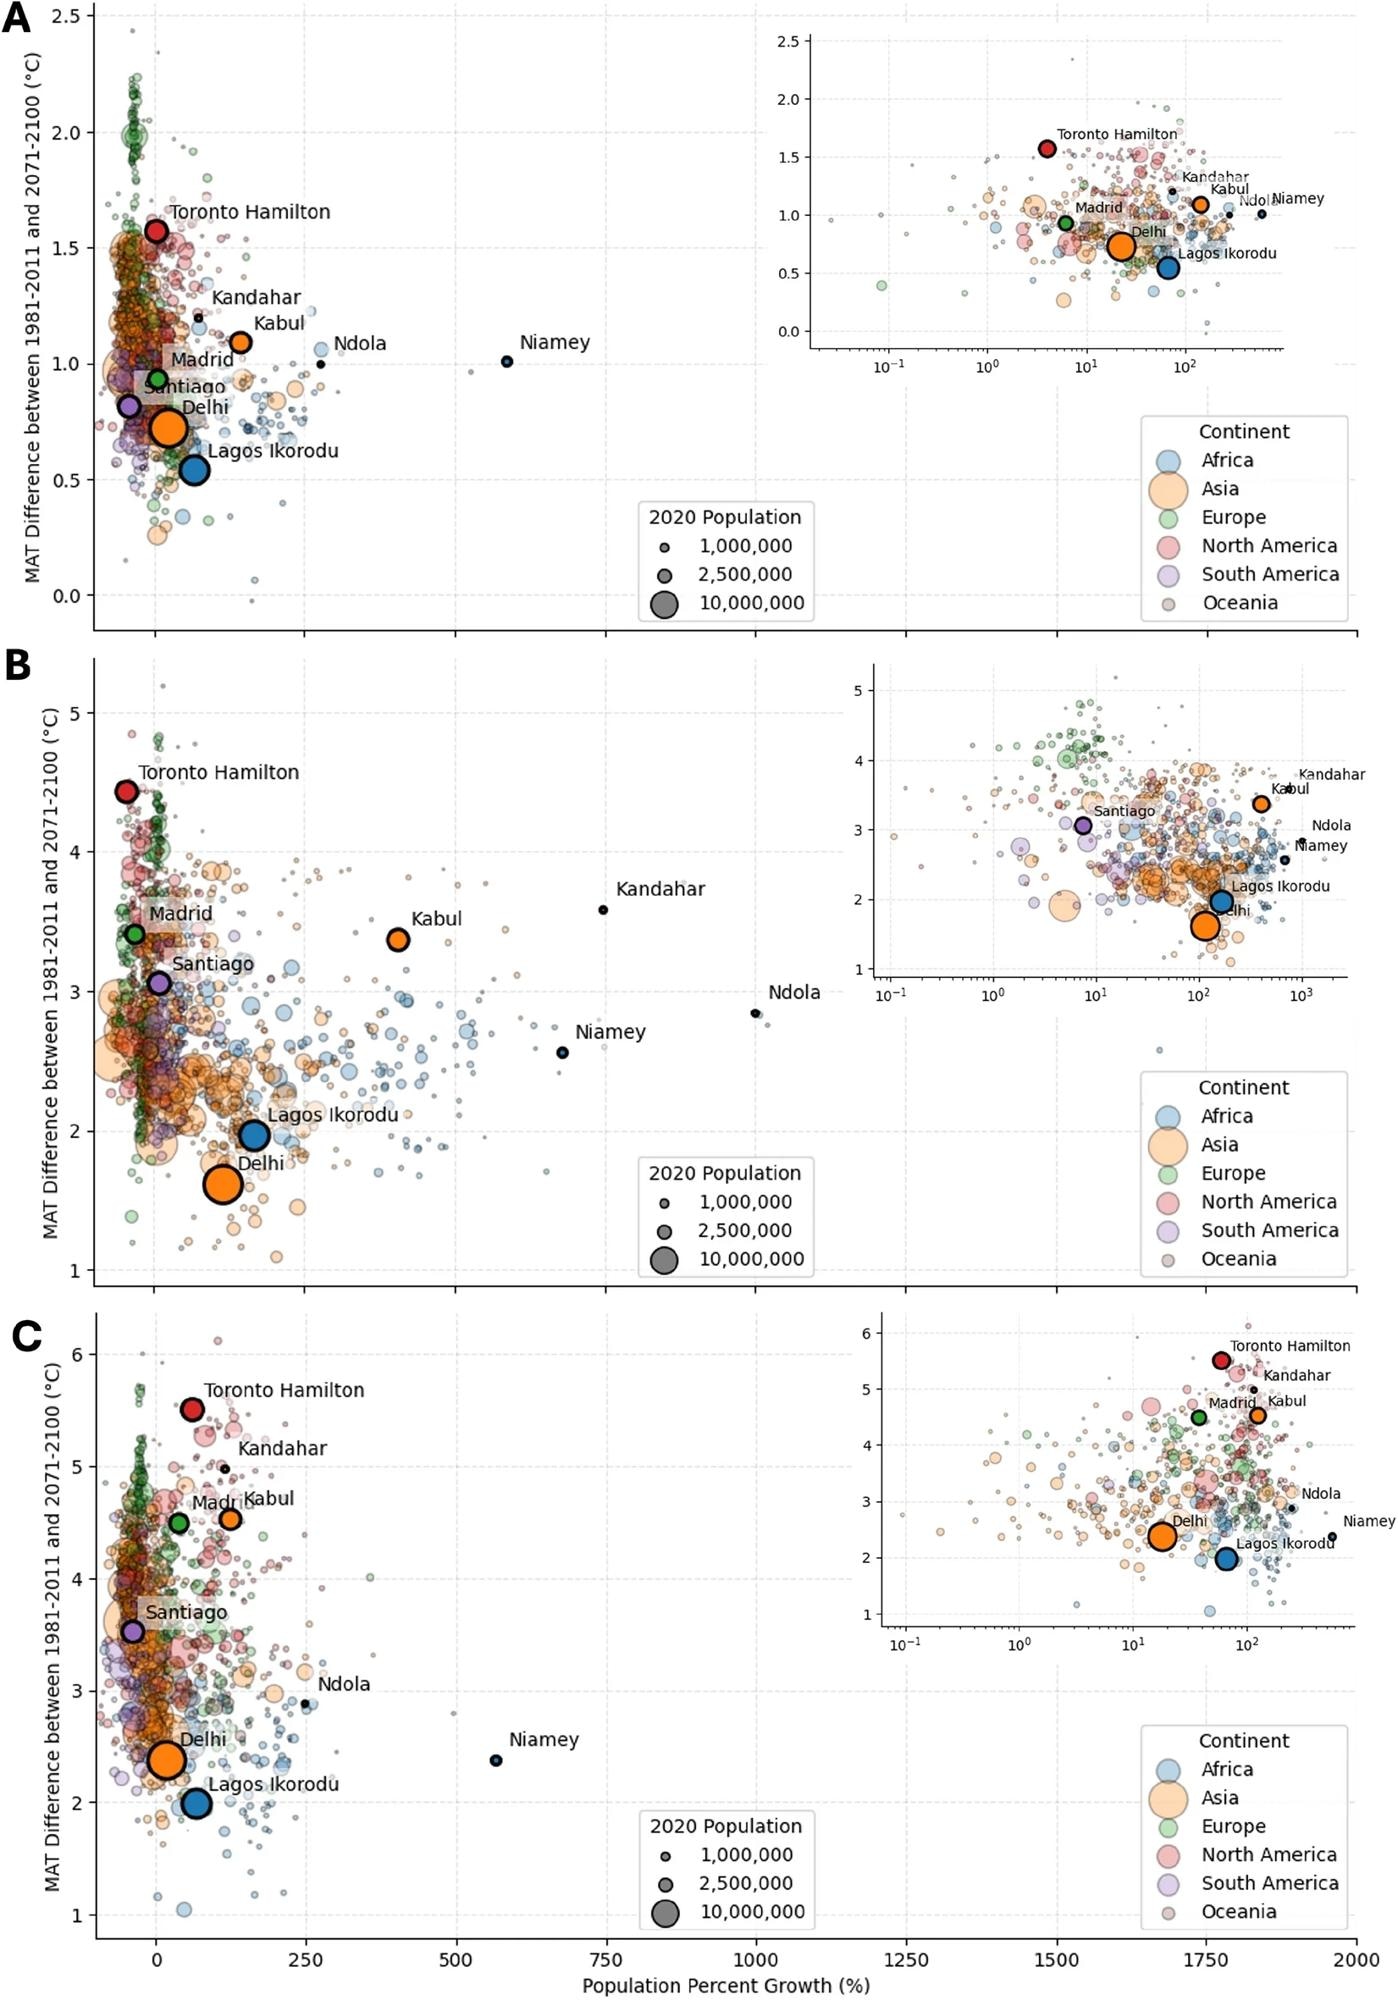
Differences in mean annual temperature and relation to urban growth. (A) Distribution of cities based on the difference in MAT and the population growth in linear and in the small plot on a logarithmic scale for SSP1-2.6, (B) SSP3-7.0 and (C) SSP5-8.5. The figures were created using the code that can be found in the repository, as stated in the code availability statement.
Seventeen cities had a MAT above 29 °C for 2011-40. This number was projected to increase to 57 by 2041-70 and 217 by 2071-2100. The projected population of cities above 29 °C was estimated to be 320 million people between 2071 and 2100, with the majority residing in Asia (270 million), followed by Africa (40 million) and South America (12 million). Under SSP1-2.6, the most favorable scenario, over 59 million people were projected to live in cities with a MAT > 29 °C.
Under SSP3-7.0, a scenario characterized by high population growth, over 446 million people were estimated to be in cities with a MAT above 29 °C, the highest exposed population of the three scenarios. When the MAT threshold was reduced to 27 °C, 629 million people were projected to be exposed to these temperatures in the SSP5-8.5 scenario.
LCZ analysis revealed distinct patterns of urban morphology in cities projected to exceed the 29 °C MAT threshold. The share of compact urban areas was comparatively low in all cities, both above and below the threshold. However, African cities with MAT < 29 °C showed larger open urban spaces in all scenarios. In contrast, the proportion of bare natural surfaces was higher in cities with MAT above 29 °C in Africa, North America, and Asia in SSP5-8.5 and SSP3-7.0 scenarios. In Africa, the hotter cities showed a lower share of green spaces in SSP5-8.5 and SSP1-2.6 scenarios. Collectively, these findings suggest that urban form is a key factor that can either exacerbate or mitigate heat exposure, underscoring critical avenues for spatially targeted adaptation strategies.
Finally, the team presented adaptation strategies for cities with a projected MAT > 29 °C based on a literature review. Accordingly, the greater the proportion of certain LCZs in a city, the higher the score of the corresponding adaptation measures. Four measures, increasing pervious-surface fraction, expanding vegetation cover and green spaces, enhancing water bodies, and using reflective building materials, scored the highest in all continents. However, the study’s analysis of economic capacity revealed a critical disparity: cities with the highest projected heat, particularly in Africa, generally have the lowest GDP levels, constraining their ability to fund adaptation. In stark contrast, wealthier cities in regions like Europe face less extreme heat but possess far greater financial resources.
Study Limitations
The authors note several limitations to provide context for their findings. The climate data, for instance, does not capture the full urban heat island (UHI) effect, which can add several degrees in dense neighborhoods. Furthermore, Gross Domestic Product (GDP) is used as a proxy for economic capacity, but it does not capture other factors, such as governance or institutional strength. Finally, the study assumes urban morphology is static, though it will evolve over time.
Conclusions
In sum, the study provided a comprehensive assessment of future urban temperature risks under three scenarios. Cities in Europe were projected to experience the highest increases in MAT by 2100 under the SSP5-8.5 scenario, while those in Africa and South America, which were already at high baseline MAT, showed smaller increases. Overall, rising urban temperatures will have profound implications for future livability in cities.
To better interpret these complex trends, the study sorts cities into three recurring risk profiles: (1) already-hot megacities with very large exposed populations, such as Mumbai and Chennai, (2) temperate but dense legacy cities facing steep background warming, such as Madrid, and (3) hot-and-growing cities where rapid urbanization and constrained adaptive capacity amplify exposure, such as Kabul. This framework helps tailor policy.
Crucially, the feasibility of adaptation depends on local economic capacity. The mismatch between high-risk, low-income cities and low-risk, high-income cities highlights the need for targeted, equity-focused policies, international cooperation, and capacity building to enable financially constrained cities to implement effective adaptation measures. By linking climate projections, urban morphology, and socioeconomic capacity, the research provides a practical roadmap for safeguarding urban habitability in a warming world.