Dynamic light scattering techniques are used to determine particle size distributions of protein therapeutic formulations. In DLS-based measurement, scattering intensity changes are associated across small time spans that produce a correlogram. Using different deconvolution algorithms, the distribution of particle diffusion coefficients is derived from the quantified correlogram. Each deconvolution algorithm can give different results. In order to identify the best algorithm and the most appropriate distribution of diffusion coefficients, a better understanding regarding the operational restrictions of the algorithm is needed. This article covers the fundamental types of DLS deconvolution algorithms utilized to obtain the intensity weighted particle size distribution from the quantified correlogram. .
DLS Correlogram
Correlation is a second order statistical method used to determine the level of non-randomness in a random data set. The intensity correlation coefficients, G2(τ), when applied to a time-dependent intensity trace, are quantified as follows:
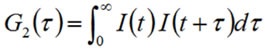
Where the ‘2’ subscript in G2 denotes the intensity, and τ is the delay time.
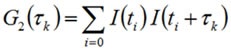
For direct application, the correlation equation can be shown as the summation given below and illustrated in Figure 1.
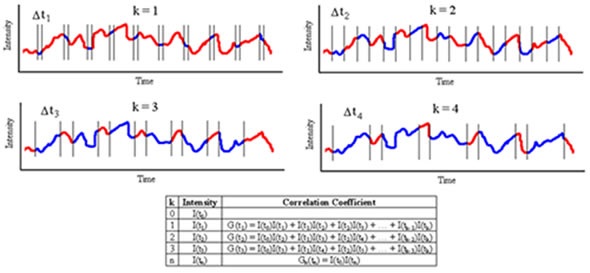
Figure 1. Schematic detailing measurement and construction of the DLS correlogram.
Correlation coefficients are usually standardized, such that G2(∞) = 1. In case of monochromatic laser light, this standardization induces a lower baseline limit of 1 for G2(∞) and an upper correlation curve limit of 2 for G2(τ0), However, in reality, the hypothetical upper limit can only be obtained in optical systems that are suitably optimized. Empirical upper limits are 0.8 to 0.9 for G2 – 1 and 1.8 to 1.9 for G2, which is often shown in DLS correlogram figures, as indicated in Figure 2.
Figure 2. DLS measured correlograms for 6nm ovalbumin and 95nm silicon dioxide in PBS.
Deconvolution
During a DLS experiment, fluctuations in the scattering intensity are the result of fluctuations in the electric field produced by the collection of solution particles. Such fluctuations are the result of the superposition of fields produced by each scattering particle as it diffuses via the solution. Therefore, data about particle motion is restricted within the electric field function, as demonstrated in the field autocorrelation expression (G1) shown below:
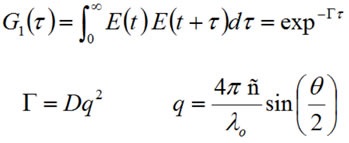
Where, Γ is the decay rate, E is the field function, q is the scattering vector, D is the mean diffusion coefficient, λ0 is the vacuum laser wavelength, θ is the scattering angle, ñ is the medium refractive index and the ‘1’ subscript in G1 denotes the field autocorrelation.
The intensity is equivalent to the square of the field (I = E2), with the individual autocorrelation functions associated with each other via the Seigert relationship. As a result, the Seigert relationship can be employed to deconvolute information regarding particle motion from the intensity autocorrelation function measured by DLS.
Cumulants Analysis
Cumulants analysis has been proposed by ISO to obtain the Z average or mean size from a DLS-measured correlogram. In the cumulants study, a group of one particle size is assumed and the correlogram is accommodated into a single exponential as illustrated below:

Where A refers the intercept or amplitude of the correlation function, Γ is the correlation decay rate, and B is the baseline.
In addition, the exponential fitting expression was extended to justify for peak broadening or polydispersity effects and then linearized, as illustrated below:
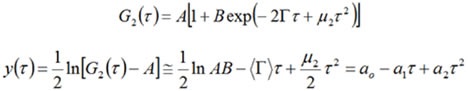
Where the first moment (a1) is equal to the decay rate (Γ) and the second moment (a2) is relative to the distribution width (μ2).
The decay rate is associated with the mean diffusion coefficient (D), which helps in determining the mean hydrodynamic size through the Stokes-Einstein relationship as follows:
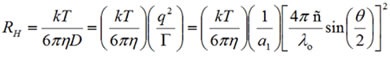
Where T is the absolute temperature, k is the Boltzmann constant, η is the medium’s viscosity, and RH is the hydrodynamic radius. The mean size is described as the Z average.
The second moment from the cumulants analysis is correlated to the distribution’s width. This relationship is shown as:
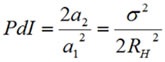
The cumulants analysis gives only the polydispersity index and mean size with regard to the modality of the distribution.
NNLS Algorithms
NNLS algorithms do not make any assumption regarding the number of particle families denoted in the intensity correlation function. In NNLS algorithms, the solution needs to be physical, that is, all Ai > 0. With these limitations, Z is reduced by requiring that the initial derivatives with regard to Ai be zero. Mean peak sizes refer to the intensity weighted average values and are achieved from the size histogram by means of the expression given below:
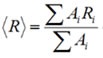
Figure 3 depicts an example of an intensity weighted particle size distribution derived by DLS for a 60nm latex standard, measured with an NNLS-type algorithm, together with the standard and mean deviation of the DLS peak.
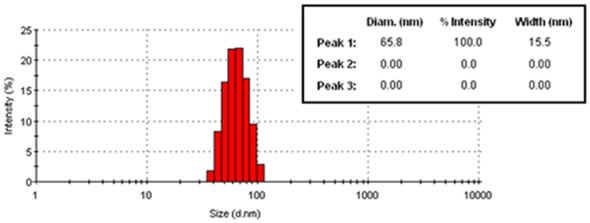
Figure 3. Example DLS results for 60nm latex, in histogram format.
Search for the "Best" NNLS Algorithm
A wide range of named NNLS type algorithms are available for light scattering researchers. Although the algorithms are based on NNLS, they are unique in that the locking of certain variables, such as the regularizer or the weighting factor or the regularizer, is achieved to optimize the algorithm for a specified set of sample conditions and instrument. A few examples of named algorithms include CONTIN, Regularization, GP and MNM, and REPES and DYNALS.
The CONTIN algorithm has become a standard approach for common DLS analysis. In a CONTIN-derived size distribution, particle distribution peaks that are close in terms of size will blend together.
The Regularization algorithm is a more aggressive algorithm, which has been optimized for dust-free small particle samples. It uses a small α parameter, and thus assumes a low level of noise in the quantified correlogram. As a result, regularization-derived distributions will exhibit sharper peaks.
The GP (General Purpose) and MNM (Multiple Narrow Mode) algorithms are general NNLS algorithms, which are optimized for a range of sample concentrations and sizes appropriate for measuring with the Nano system. The MNM algorithm is more aggressive, while the GP algorithm is more conservative.
REPES and DYNALS algorithms are similar to the CONTIN algorithm, but are more aggressive with respect to noise estimates.
Data Weighting
Figure 4 illustrates the effects of data weighting on a DLS correlogram for 1mg/mL lysozyme, following filtration via a 20nm Anotop filter. When data weighting is not used, noise in the baseline can result in noise or ghost peaks.
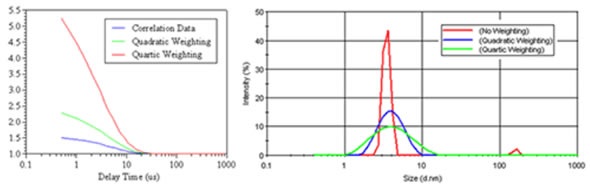
Figure 4. Comparison of quadratic and quartic weighting on the measured correlogram for a 1mg/mL lysozyme sample, after filtration through a 20nm filter, along with the resultant size distributions derived using the Malvern Panalytical General Purpose algorithm.
Alpha (α) Parameter or Regularizer
The α parameter or regularizer in deconvolution algorithms based on NNLS controls the preferred level of spikiness in the resultant distribution. Smaller alpha values produce more spiky distributions, while larger α values produce smoother and less resolved distributions. Thus, the α parameter can be described as an estimate of the predicted level of noise in the quantified correlogram. There is no best alpha parameter. The correct value relies on the sample under study.
Multiple Solutions (CONTIN)
CONTIN produces a set of qualifying descriptors, which are utilized to detect the most probable solutions. These descriptors include:
- The α parameter
- The degrees of freedom
- The number of peaks
- The probability to reject
The principle of parsimony is applied to choose the most probable solution. According to this principle, the best solution is the one which reveals the least amount of new data.
Figure 5 illustrates a comparison of the CONTIN produced solution set for the 220nm and 60nm latex mixture. Here, one of the solutions corresponds with the results obtained using the Malvern Panalytical MN Mode algorithm and is an excellent representation of the real sample. However, the most probable solution is CONTIN 6, which reveals a blending of the populations to create a single peak of high polydispersity.
Figure 5. Comparison of the CONTIN generated solution set of size distributions for the 60nm and 220nm latex mixture.
When compared to the Malvern Panalytical GP and MNM Mode algorithms, CONTIN is more conservative. Although this is suitable for noise recognition and management, it can lead to reduced particle size resolution for mixtures (Figure 6).
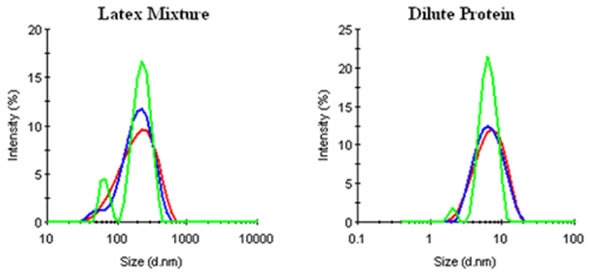
Figure 6. Comparison of CONTIN (▬), General Purpose (▬), and Multiple Narrow Mode (▬) results for a mixture of 60nm and 220nm latices and a dilute protein (0.3mg/mL lysozyme) sample.
Conclusion
As such, there is no best or ideal DLS algorithm. Each of the algorithms described above provides valuable data. The most suitable method is to combine what is known and what is suspected regarding the sample, compare results obtained from different algorithms, and then search for repeatability in the results. For instance, if different measurements denote a shoulder in a broad peak, which resolves on its own into a repeatable population with the use of an aggressive algorithm, this unique population could be real. However, if inconsistencies are observed with repeat measurements, then it would be best to use a conservative algorithm, such as the CONTIN or GP algorithm.
About Malvern Panalytical

Malvern Panalytical provides the materials and biophysical characterization technology and expertise that enable scientists and engineers to understand and control the properties of dispersed systems.
These systems range from proteins and polymers in solution, particle and nanoparticle suspensions and emulsions, through to sprays and aerosols, industrial bulk powders and high concentration slurries.
Used at all stages of research, development and manufacturing, Malvern Panalytical’s materials characterization instruments provide critical information that helps accelerate research and product development, enhance and maintain product quality and optimize process efficiency.
Sponsored Content Policy: News-Medical.net publishes articles and related content that may be derived from sources where we have existing commercial relationships, provided such content adds value to the core editorial ethos of News-Medical.Net which is to educate and inform site visitors interested in medical research, science, medical devices and treatments.