Biotherapeutic formulations have been characterizing particles through optical microscopy for a long time. The obtained shape, size, and transparency characteristics are used to categorize particulates into distinct classes, such as sundry contaminants, silicone oil and aggregates. However, the microscope’s ability to provide direct identification is based on the 2D images. The combination of Raman spectroscopy and an automated microscopy system offers a robust primary identification technique for the validation of particle chemistry. The techniques together exhibit an ability to identify, characterize and enumerate particulates in native formulations and also the ones immobilized on a filter substrate.
These capabilities help meet FDA quality requirements for drugs injected into the body, with respect to particulate count per unit volume. These regulations are implemented via USP <788>, which requires enumeration of particulates in two size categories: larger than 25μm and larger than 10μm. However, the recent implementation of USP <787> and <1787> has recommended to include sizes under 10μm. However, this lower size range is of major concern for the FDA due to immunogenic response associated with proteinaceous aggregates, general safety and lower product efficacy. Several factors influence formulation stability, which can result in the generation of aggregated material.
Malvern Panalytical’ Morphologi G3-ID, a fully automated hybrid optical microscope-Raman spectrometer, features a benchtop Raman spectrometer’s chemical identification capabilities and a high-resolution optical microscope’s imaging power. This article describes the application of the Morphologi G3-ID for morphologically directed Raman spectroscopy (MDRS) to carry out comparative analysis of suspended particles within a thin path wet cell against those collected on a filter membrane, and to analyze and determine contaminants, such as protein aggregates, in a stressed lysozyme sample.
Automated particle size, shape & chemical identity measurement with Morphologi G3-ID
Materials and Methods
The particulates used for morphological characterization (shape, size and transparency) were located using Malvern Panalytical’ Morphologi G3-ID, which also facilitates chemical identification of species using Raman spectroscopy. The Morphologi G3-ID was operated with 10x magnification to achieve an effective lower size limit of 2μm for particle count.
At this magnification, the practical upper size limit is typically around 200μm. The included particle stitching routine can extend the upper size limit considerably by allowing “reassembling” of the images of particulates spanning over one field of view. Using a 3μm spot with 50x magnification and 785nm excitation, Raman spectra were accumulated from 150cm-1 to 1850cm-1, at 6cm-1 resolution. Aggregates were produced by stressing two separate 100mg/mL, pH 7.1 lysozyme solutions. One was used for the suspension-phase analysis while the other was used for the filter-based analysis.
Membrane Filter
After rapidly stirring one of the lysozyme solutions for 16 hours at ambient temperature, a 47mm cellulose-based Millipore GSWP filter was used to vacuum filter 1mL aliquots of the resulting aggregated suspension subsequent to spiking with small quantities of polystyrene latex spheres that were used as reference species.
The filter was allowed to dry prior to the analysis after taping it to a glass slide. This was followed by scanning a circular area with 15mm radius at 10x magnification for characterizing particulates and recording their locations. Based on their size and morphology, the particulates were classified into groups. Then a subset for each group was selected for Raman spectral analysis.
Suspended Sample
After the second lysozyme preparation was subjected to rapid stirring for 4 hours at 45°C, it was investigated in the suspension-phase. An aliquot (55μL) of the suspension was then transferred to a proprietary thin-path wet cell (25μm path length) containing quartz windows. Prior to the analysis, the cell was held for 15 minutes to achieve thermal equilibrium. The analysis also included a 20mm radius scan area with respect to 31.4μL in volume.
Results
For particle counting, the size groups of particulates vary from 2μm to 10μm (small), 10μm to 25μm (medium), and greater than 25μm (large), in addition to a specific class of 40μm polystyrene latex spheres. Figure 1 shows a selection of images from each group of particles identified on the membrane filter sample.
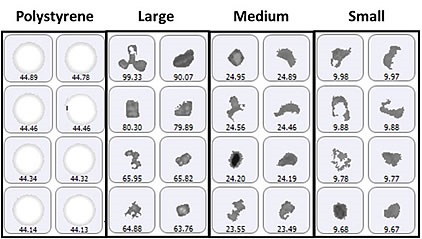
Figure 1. Representative particle images from each size band defined for the lysozyme sample on a membrane filter. Note that the scale is not the same for each group.
Since the top-light (episcopic) illumination geometry was used for data collection, the polystyrene particles were observed to be bright white in color. Particles from the aggregate groups were shown to be darker and exhibited different shape characteristics. Figure 2 shows the final count data, indicating an increase in particle counts with the decrease in particle size. In addition, the count of large aggregate-type particles and polystyrene particles was found to be similar.
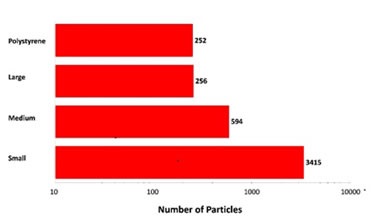
Figure 2. Particle counts collected for a mixed sample of lysozyme aggregates and 40μm polystyrene latex on a membrane filter. Note the logarithmic X-axis
The overall particle count was found to be higher compared to what would be anticipated from a commercial sample that is not stressed. However, the results have demonstrated the Morphologi G3-ID’s counting and characterization abilities.
For 30 particles present in the polystyrene group, Raman spectra were collected. Out of these, 29 spectra were observed as polystyrene latex, while the remaining one exhibited a proteinaceous spectrum. Following the analysis, a lysozyme aggregate was found near the polystyrene particle that resulted in the proteinaceous spectrum. In addition, from the large (>25mm) group, 14 spectra were acquired using 30 second integration time at the available low power settings (~5mW), of which 13 were identified as lysozyme aggregates. The remaining one provided a wide fluorescence spectrum and was considered to be rubber (inset, green spectrum). Figure 3 shows example spectra of the background filter, a proteinaceous particle, a latex sphere and a rubber particle. Figure 4 shows the images chosen from each group of particles analyzed in the thin path wet cell.
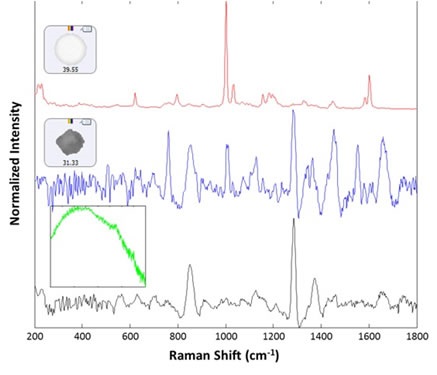
Figure 3. Representative spectra collected from the filtered lysozyme sample: membrane filter background (black), lysozyme aggregate (blue), polystyrene sphere (red). The inset (green) shows the spectrum of a rubber particle that was found in the sample
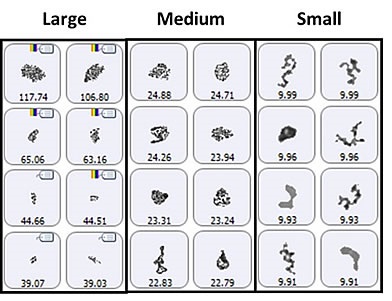
Figure 4. Representative particle images from each of the size bands defined for the lysozyme sample in suspension. Note that the scale is not the same for each group.
The particle images showed a particulate morphology different from that obtained for samples collected on the membrane filter. The filtered aggregates were observed to be crystalline, and that of the suspended samples was found to be more diffuse. As shown in Figure 5, it can be said that the lysozyme suspension particulates appeared to be a series of smaller aggregates gathered in a larger body. This suggests that the lysozyme aggregation mechanism can be varied by altering the stress conditions (sample preparation and/or collection). For the suspended sample, the morphological results were classified based on the size as described for the filtered sample: 2μm -10μm (small), 10μm - 25μm (medium), and 25μm+ (large) (Figure 6).
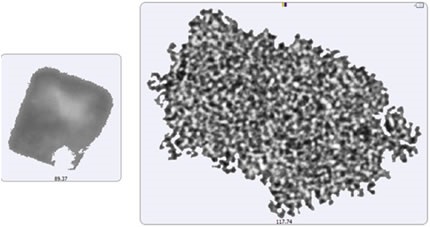
Figure 5. Image of the largest recorded aggregate particle from the filtered sample (left) and from the suspended sample (right)
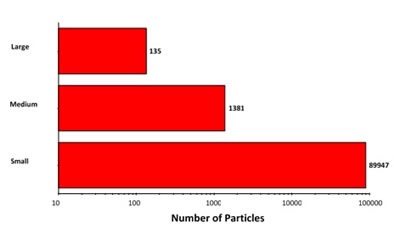
Figure 6. Summary of morphological results grouped based on size
For a small series of the large aggregates, particle spectra were acquired using a 2 minute integration time. Out of 25 particles examined, 3 were found to be cellulose and the rest found as proteinaceous. Figure 7 shows the example spectra.
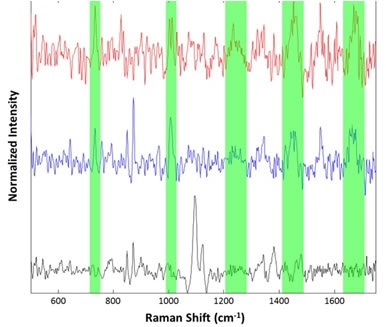
Figure 7. Representative spectra collected from the suspended lysozyme sample: Cellulose particle (black), lysozyme aggregates (blue and red). Regions associated with common Raman features for proteinaceous materials are highlighted in green
No conclusions have been made with respect to the detailed structural information of the proteinaceous particles observed either in suspension or on the filter, for example, α-helix, b-sheet, or random coil conformations. Increasing the data collection times could help the spectra to have better signal-to-noise ratio, from which more details can be obtained.
Discussion
Enumeration and characterization of particulates require high levels of attention in biotherapeutic formulation. USP <788> demands particle analysis in the 10-25μm range as well as the 25μm and larger size ranges. Meanwhile, the current focus of the market is to access the sub-10μm size range, in accordance with predicted new FDA recommendations. Therefore, for this size range, optical microscopes, including the Morphologi G3-ID, are ideal as they show promise in yielding high-resolution images and 100% particle counting for the required sample volume.
These capabilities can be extended with Raman spectroscopy, which identifies the particles chemically. This directly fulfills the USP <787> requirements for enumeration and morphological characterization in addition to providing direct, precise chemical identification of subvisible (2μm -100μm) particles. Raman spectroscopy is a proven method that can differentiate chemically similar materials based on the unique vibrational structure of different chemical entities. Therefore, the method has high chemical specificity. By cross-examining a library of reference materials, the unknown materials can be easily characterized.
Conclusion
The integration of automated microscopy and Raman spectroscopy has been proved useful in detecting and identifying the particulates present in the lysozyme samples on a filter membrane and in suspension. This combination provides flexibility for sample analysis in its native state, and for particulate isolation on a substrate for further analyses. Particle morphology helps in differentiating various types of aggregates, and also extrinsic contaminants from aggregates. Further, this method has the potential to investigate structural differences between aggregate species using variations in their Raman spectra.
References
- United States Pharmacopeia, <788>: Particulate Matter in Injections.
- United States Pharmacopeia, <787>: Subvisible Particulate Matter in Therapeutic Protein Injections.
- A.S. Rosenberg, Effect of protein aggregates: an immunologic perspective. The AAPS Journal 8, E501-E507 (2006).
- H.C. Mahler, W. Friess, U. Grauschopf, and S. Kiese, Protein Aggregation: Pathways, induction Factors and Analysis. Journal of Pharmaceutical Sciences 98 (9), 2909-2934 (2009).
- S. Amin, G.V. Barnett, J.A. Pathak, C.J. Roberts, and P.S. Sarangapani, Protein aggregation, particle formation, characterization & rheology. Current Opinion in Colloid & Interface Science (2014).
About Malvern Panalytical

Malvern Panalytical provides the materials and biophysical characterization technology and expertise that enable scientists and engineers to understand and control the properties of dispersed systems.
These systems range from proteins and polymers in solution, particle and nanoparticle suspensions and emulsions, through to sprays and aerosols, industrial bulk powders and high concentration slurries.
Used at all stages of research, development and manufacturing, Malvern Panalytical’s materials characterization instruments provide critical information that helps accelerate research and product development, enhance and maintain product quality and optimize process efficiency.
Sponsored Content Policy: News-Medical.net publishes articles and related content that may be derived from sources where we have existing commercial relationships, provided such content adds value to the core editorial ethos of News-Medical.Net which is to educate and inform site visitors interested in medical research, science, medical devices and treatments.