The neuroimaging field has been revolutionized by the resting state functional MRI or rs-fMRI technique, (Biswal et al., 1995), highlighting a major shift towards the notion of combined whole brain functional networks in contrast to the process of identifying isolated functional brain regions triggered by some stimulus paradigm.
The rs-fMRI technique can detect spontaneous and low frequency (<0.1Hz) variations in Blood Oxygen Level Dependent (BOLD) signal along with their temporal correlations (Biswal, 2012), providing an exclusive non-invasive approach to view the intrinsic network of whole brain functional connectivity. The ability of the technique to make out the patterns of brain pathology was demonstrated over time (Castellazzi et al., 2014; Zhou et al., 2014; Nathan et al., 2015; Odish et al., 2015) and as a result, this method is now being employed in human brain studies (Sporns et al., 2005; Van Essen et al., 2013).
In the meantime, the characterization of strong and reliable resting state networks in mice has also gradually evolved. However, in spite of promising initial results (Jonckers et al., 2011) a key area that still remains underexplored is fine-grained mapping of the brain resting state networks in rodents. This fact is very surprising because this species is extensively used in experimental neuroscience studies for modeling neurological disorders in humans. Hence, shedding more light into the remodeling of brain resting state networks in these models could provide a better understanding of brain disorder pathophysiology and help establish imaging biomarkers.
However, when it comes to small animals, rs-fMRI presents many challenges that are related to the necessity of rapid, high-resolution acquisition methods and at the same time ensures steady physiological parameters across the experiment. This article shows how CryoProbe – a new, advanced technology developed for mouse MRI – can be used to perform fine-grained mapping of the mouse brain functional “connectome” in a non-invasive manner. A signal to noise increase of a factor of less than 2 is obtained when probe and its electronics are cooled down.
Using this data, consistent intrinsic patterns of the mouse whole brain functional network architecture are identified. The approach used in this study depends on the blind source spatial segregation of the BOLD signal through group-level independent component analysis (ICA) together with graph theoretical analysis. It is shown that under a light medetomidine sedation (adapted from Pawela et al., 2009), the key modular properties identified from the human brain were simulated in the mouse and the network has the markings of an intricate small-world efficient architecture.
The highly connected brain areas in the mouse are also distinguished which emphasizes their significance as relays of the whole brain functional connectivity. This data is important in translational studies, closing the gap between clinical and preclinical studies of functional connectome remodeling.
Experimental protocol
Animal stabilization and sedation
First, rs-fMRI was carried out in C57BL/6N female mice (n = 13) aged 8 to 9 weeks. To induce moderate sedation, a subcutaneous (sc) bolus injection (0.3 mg medetomidine per kg body weight) containing the α2-adreno-receptor agonist medetomidine (MD – Domitor, Pfizer, Karlsruhe, Germany) was administered. After 15 minutes, a continuous sc infusion of MD was administered on the animals via a catheter located at the shoulder of the mouse (0.6 mg per kg body weight). Heart rate, respiration rate, body temperature, and blood oxygen saturation were continuously observed throughout the imaging procedure and scans were taken only at stable physiological parameters.
Magnets and coils
A Bruker Biospec 7T small bore animal system integrated with B-GA12S HP gradients is used to perform imaging. For data acquisition, a 1H mouse quadrature transmit/receive MRI CryoProbe along with ParaVision 5.1 software (Bruker BioSpin MRI) was employed.
Shimming procedure
In order to optimize the homogeneity of magnetic field, a localized shimming procedure is performed on a target volume (7.5 x 10.5 x 15) mm³ located within the mouse brain. This step is done using FastMap protocols and PRESS waterline spectroscopy procedure provided with the Bruker ParaVision 5.1 software.
Sequence parameters
For rs-fMRI acquisition {TE/TR = 10 ms/1700 ms}, single shot GE-EPI sequence was applied. Except or the cerebellum, the whole mouse brain was covered using 12 slices measuring a thickness of 0.7 mm.
With an acquisition matrix of 128 x 80 and a field of view (FOV) of 1.92 x 1.2 cm², the planar spatial resolution leads to 150 x 150 μm². For each run, 200 volumes were captured with slice acquisition in an interlaced manner. After bolus injection, rs-fMRI scans were carried out at an interval of 30 minutes.
Analysis
The rs-fMRI data was preprocessed in Matlab and through Statistical Parametric Mapping (SPM8) fMRI tool. The process involved:
- realignment of the 200 volumes to the first volume for motion correction within a single scan
- spatial normalization to a selected template to enable group analysis
- smoothing with a Gaussian kernel of FWHM 0.4 x 0.4 x 1 mm³
Using the same template, an extra brain mask was developed and applied to all datasets prior to further processing.
Independent component analysis
With the help of GIFT toolbox (Group ICA of fMRI Toolbox – v1.3i), Spatial Group Independent Component Analysis (ICA, Calhoun et al. 2001) was performed using Infomax algorithm. As this approach is purely driven by data, the BOLD signal is split into components that result from sources considered as being independent, and the voxels within a single component are regarded as functionally related to one another. The stochastic nature of the ICA method is well-known which for the first time made it possible to perform a pilot analysis to assess the various numbers of components through the ICASSO algorithm (Himberg et al., 2004).
In this method, the ICA algorithm is run multiple times under somewhat different conditions (that is bootstrapping and/or different initial conditions) and the results of each run are considered to ultimately provide an averaged set of components. The tool not only helps to observe the component clustering but also gives a quantitative measure of the actual robustness of the components identified: the ‘quality index’ Iq (values ranging between 0 and 1). The quality index assessed the isolation and compactness of each cluster, making it possible to emphasize unstable IC (Independent Component) patterns.
The ICASSO algorithm provides quantitative measures of IC stability which also enabled the ultimate selection of a different number of components to be obtained by the algorithm. This represents an important step when ICA is used. A comparison of 40 and 100-ICASSO results are presented based on the former. On the template, all mean results obtained are shown as spatial color-coded z-maps and this color coding indicates the reliance of the time courses in all voxels as opposed to the mean time course of the individual component.
Partial correlation (PC) analysis
Based on the 100-ICASSO results, 8 components were barred as artifactual and a respective 92 x 92 adjacency partial correlation (PC) matrix was measured to assess the direct statistical relationship by controlling correlation that was mediated by other components (Smith et al., 2010). Next, negative correlations were additionally removed (separate analysis required) and the importance of correlation was evaluated by using a single sample t-test with thresholding at p<0.01. This leads to a weighted undirected matrix (WUM). A binary undirected matrix (BUM) was then produced to assess a number ranking according to importance of connections.
Whole brain modular structures
Considering the WUM, the mouse brain community structures were detected by graph theory as well as spectral partitioning technique including fine tuning (Newman, 2006) to verify the resulting configuration stability. The two major metrics of small-worldness – the minimum path length L and the clustering coefficient C – were measured (Watts and Strogatz, 1998) and the same was compared to the mean path length Lrand and clustering coefficient Crand of an arbitrary network with the equal number of edges, nodes, and degree distribution just like the rs-fMRI derived network. For small-world network configurations, as the human brain is depicted to be – the ratio L/Lrand is defined to be about 1 and the ratio C/Crand is greater than 1.
Results and discussion
Two functional areas related to cortical (Figure 1A) and subcortical (Figure 1B) networks detected with 100-ICASSO and 40-ICASSO were comparatively presented. The cortical resting-state cluster, located at the primary somatosensory cortex (SSC) that is anatomically well-defined; secondary somatosensory cortex; and barrel field is all representative of the bi-hemispherical or bilateral connectivity pattern acquired with 40-ICASSO, as shown in Figure 1 A-a.
Refining the analysis with 100-ICASSO, as shown in Figures 1 A-b to e, led to the segregation of the functional areas of somatosensory cortex. Unilateral connectivity patterns were unraveled, which suggests that the SSC may have different low frequency variations of the BOLD signal in both hemispheres. Therefore, when 100-ICASSO is used, resting-state networks differentiated in single components from 40-ICASSO were divided into many functional circuits.
In addition to being relevant for cortical areas, this was also a common feature of subcortical regions. Shown in Figure 1B is the division of the thalamic networks, from a single component acquired with 40-ICASSO (Figures 1 B-f), into 6 functional clusters produced with 100-ICASSO.
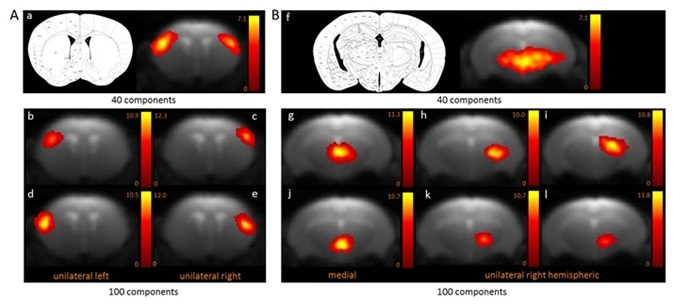
Figure 1. BOLD resting-state fMRI based cortical (A) and thalamic (B) mouse brain functional connectivity clusters, comparatively revealed by 40- (a, f) and 100-ICASSO (b–e and g–l). All images represent spatial color-coded z-maps of the independent components. Image Credit: Bruker BioSpin Group
100-ICASSO also showed the segregation of functional cortical, dividing this brain area into anatomically meaningful areas as shown in Figure 2 - a) cingulate cortex, b) motor cortex, c) primary somatosensory cortex, d) insular cortex, e) piriform cortex). When performing research in animal models of brain disorders, this refinement with 100-ICASSO could be of major value for showing the functional abnormalities at particular cortical locations.
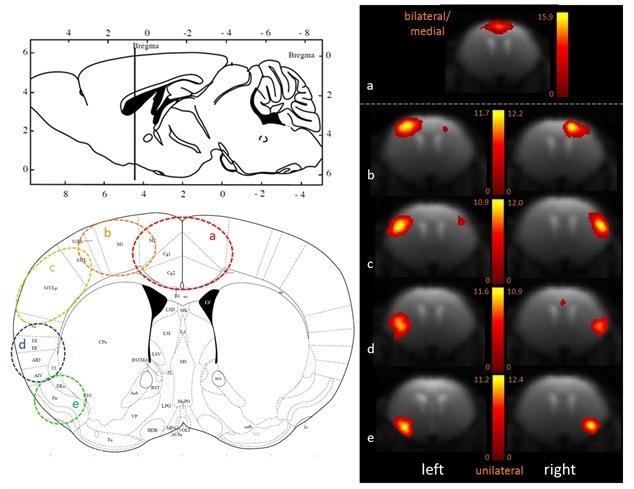
Figure 2. Fine-grained segregation of the cortical mouse brain functional connectivity revealed with 100-ICASSO. Bi- (a) and uni-lateral left and right ICs (b–e), matching well defined anatomical areas (see he atlas axial image - Paxinos and Franklin, 2001) are displayed. Image Credit: Bruker BioSpin Group
The direct association between separate components through PC analysis was measured to further assess the connectional relationships of inter-components and to generate the connectivity matrix of the whole brain. The 92 non-artifactual resting state clusters (components) are included in the input for the correlation analysis.
Shown in Figure 3A and 3B are the relevant 92 x 92 PC coefficient matrix (WUM) which is averaged across all animals, with the relevant 3D representation of connectivity (negative correlations in blue, positive correlations in red, all the components are indicated by a dot at their center of mass). Shown in Figure 3C with Figure 3D are the BUM with the respective 3D representation.
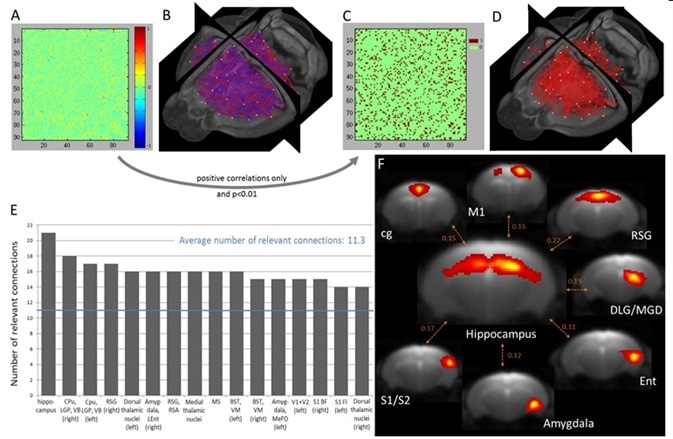
Figure 3. Quantitative assessment of inter-component direct connectivity using partial correlation analysis and identification of the most connected brain regions. (A) Weighted undirected matrix (WUM) generated after correlating the time courses of the non-artifactual components obtained with group 100-ICASSO and respective 3D visualization (B). (C) Binary undirected matrix (BUM) reflecting the statistically significant positive correlations and 3D display (D). (E) Ranking of the most connected brain areas, considered as nodes of the functional connectivity. For identifying the brain regions in the graph see the complete abbreviation list. (F) Spatial maps of the rostro-dorsal hippocampus and of its strongest connections, as reflected by the partial correlation coefficient displayed between pairs of IC. Image Credit: Bruker BioSpin Group
For each IC, an average number of 11.26 statistically related functional connections were measured. Among the 92 resting-state clusters, 42 showed a greater number of related connections than average; since each cluster overlaps a particular anatomical brain region, the method used here made it possible to rank the most connected brain areas, regarded as nodes of functional connectivity. Shown in Figure is data regarding the top 13 most connected mouse brain functional areas, which are ordered as per their respective number of related connections.
The most connected brain region was identified to be rostro-dorsal Hippocampus. Figure 3F shows a representative MR slice that defines the hippocampal network together with the respective spatial maps of seven of its strongest functional connections. An integral part of the limbic system, the Hippocampus showed the highest level of functional connectivity with brain regions that play a key role in the regulation of learning, behavior, memory, and emotion. Retrosplenial cortex, amygdala, cingulum, and entorhinal cortex are part of these brain regions.
Also used as nodes were the 100-ICASSO functional clusters, which were interconnected through edges (inter-components strength from WUM) in the inspection of large-scale functional connectivity of mouse brain with graph theory. Topological properties of the global network were assessed using modularity, mean shortest path length, global clustering coefficient, and small-worldness. Using the data acquired from the WUM, a high modularity value (Q = 0.50) was obtained by segregating the whole brain network of the mouse into five modules. The high Q value obtained indicates a major modular structure of intrinsic connectional architecture of functional networks in the mouse brain.
The assessment of small-worldness properties of the functional connectivity of a C57BL/6N mouse brain, a high clustering coefficient value, along with a short minimum path length: C=3.08∗Crand and L = 1.11∗Lrand. Lastly, the ratio value σ = γ/λ = (C/Crand)/(L/Lrand) = 3.08/1.11 = 2.77 > 1, points to an optimal network configuration for local processing and global data transfer inside the mouse brain, in proportion to the small-worldness network configurations.
On comparison of the study data against the rat study by Liang et al. (2011), it was observed that higher clustering coefficient values γ = C/Crand = 3.08 in the mouse (vs. 1.7 in the rat, Liang et al., 2011), indicates a higher level of clustering data and thus segregation of functional areas within the mouse. In spite of different levels of consciousness during imaging, the ratio of minimum path length (L/Lrand = 1.11 in mice versus L/Lrand =1.08 in rat) and the number of modules (5 in mice versus 4 in rats with fine-tuning as per the spectral partitioning analysis explained by Newman, 2006) are observed to be extremely similar in both mice and rats – that is medetomidine sedated mice versus awake rats.
Yet, the network of mouse brains were able to form all its modules through an intricate combination of subcortical and cortical brain regions, while Liang et al. was able to detect modular structures covering only the cortical ribbon of the rat brain.
The above results demonstrate the intricate structure and organization of the brain functional connectivity in rodents without affecting the global topological characteristics of small-worldness network configurations and supporting specialized/segregated as well as integrated/distributed data processing (Bassett and Bullmore, 2006). Overall, this appears to be a standard feature of healthy human and rodent brains. Hence, the use of network topology readouts in animal models of brain disorders may help explain the biological substrates and mechanisms of human brain pathologies and thus bridge the gap between clinical and pre-clinical investigations.
Summary and outlook
Rs-fMRI is the only technique that allows non-invasive mapping of functional brain connectivity. In this article, a data acquisition and processing pipeline modeled for studying the rodent brain functional connectivity was provided. These results pave the way towards a collection of findings at the functional connectivity level and also provides a better understanding of structural network analyses through fiber tracking and diffusion tensor imaging (Harsan et al., 2013) as complementary methods for exposing the whole mouse brain “connectome”.
References
- Bassett DS, Bullmore E (2006), Small-world brain networks. Neuroscientist 12
- Biswal B, Yetkin FZ, Haughton VM, Hyde JS (1995), Functional connectivity in the motor cortex of resting human brain using echo-planar MRI, Magn. Reson. Med. 34
- Biswal B (2012), Resting state fMRI: a personal history, Neuroimage 62
- Calhoun MD, Adali T, Pearlson GD, Pekar J (2001), A method for making group inferences from functional MRI data using independent component analysis, Hum. Brain Mapp. 14
- Castellazzi G, Palesi F, Casali S, Vitali P, Sinforiani E, Wheller-Kingshott CA, D’Angelo E (2014), A comprehensive assessment of resting state networks: bidirectional modification of functional integrity in cerebro-cerebellar networks in dementia, Front Neurosci 8
- Harsan LA, David C, Reisert M, Schnell S, Hennig J, von Elverfeldt D, Staiger JF (2013), Mapping remodeling of thalamocortical projections in the living reeler mouse brain by diffusion tractography, Proc. Natl. Acad. Sci. U. S. A. 110
- Himberg J, Hyvarinen A, Esposito F (2004), Validating the independent components of neuroimaging time series via clustering and visualization, Neuroimage 22
- Jonckers E, Van Auderkerke J, De Visscher G, Van der Linden A, Verhoye M (2011), Functional connectivity fMRI of the rodent brain: comparison of functional connectivity networks in rat and mouse. PLoS One 6.
- Liang Z, King J, Zhang N (2011), Uncovering intrinsic connectional architecture of functional networks in awake rat brain. J. Neurosci. 31
- Mechling AE, Hübner NS, Lee H-L, Hennig J, von Elverfeldt D, Harsan L-A (2014), Fine-grained mapping of mouse brain functional connectivity with resting-state fMRI, Neuroimage 96
- Nathan DE, Oakes TR, Yeh PH, French LM, Harper JF, Liu W, Wolfowitz RD, Wang BQ, Graner JL, Riedy G (2015), Exploring variations in functional connectivity of the resting state default mode network in mild traumatic brain injury, Brain Connect 2015
- Newman ME (2006), Modularity and community structure in networks, Proc. Natl. Acad. Sci. U. S. A. 103
- Odish OF, van den Berg-Huysmans AA, van den Bogaard SJ, Dumas EM, Hart EP, Rombouts SA, van der Grond J, Roos RA (2015), Longitudinal resting state fMRI analysis in healthy controls and premanifest Huntington’s disease gene carriers: a three-year follow-up study, Hum Brain Mapp 36
- Pawela CP, Biswal BB, Hudetz AG, Schulte ML, Li R, Jones SR, Cho YR, Matloub HS, Hyde JS (2009), A protocol for use of medetomidine anesthesia in rats for extended studies using task-induced BOLD contrast and resting-state functional connectivity, Neuroimage 46
- Paxinos G, Franklin K (2001), The mouse brain in stereotaxic coordinates.
- Smith SM, Miller KL, Salimi-Khorshidi G, Webster M, Beckmann CF, Nichols TE, Ramsey JD, Woolrich MW (2010), Network modeling methods for FMRI, Neuroimage 54
- Sporns O, Tononi G, Kotter R (2005), The human connectome: a structural description of the human brain, PLoS Comput. Biol.1
- Van Essen DC, Smith SM, Barch DM, Behrens TE, Yacoub E, Ugurbil K (2013), The WU-Minn Human Connectome Project: an overview, Neuroimage 80
- Watts DJ, Strogatz SH (1998), Collective dynamics of ‘small-world’ networks, Nature 393
- Zhou F, Zhuang Y, Gong H, Wang B, Wang X, Chen Q, Wu L, Wan H (2014), Altered inter-subregion connectivity of the default mode network in relapsing remitting multiple sclerosis: a functional and structural connectivity study, PLoS One 9
About Bruker BioSpin Group
The Bruker BioSpin Group designs, manufactures, and distributes advanced scientific instruments based on magnetic resonance and preclinical imaging technologies. These include our industry-leading NMR and EPR spectrometers, as well as imaging systems utilizing MRI, PET, SPECT, CT, Optical and MPI modalities. The Group also offers integrated software solutions and automation tools to support digital transformation across research and quality control environments.
Bruker BioSpin’s customers in academic, government, industrial, and pharmaceutical sectors rely on these technologies to gain detailed insights into molecular structure, dynamics, and interactions. Our solutions play a key role in structural biology, drug discovery, disease research, metabolomics, and advanced materials analysis. Recent investments in lab automation, optical imaging, and contract research services further strengthen our ability to support evolving customer needs and enable scientific innovation.
Sponsored Content Policy: News-Medical.net publishes articles and related content that may be derived from sources where we have existing commercial relationships, provided such content adds value to the core editorial ethos of News-Medical.Net which is to educate and inform site visitors interested in medical research, science, medical devices and treatments.