Organelles perform the fundamental processes that help cells (and hence organs, tissues, and organisms) stay alive and operative. In the past several decades, transmission electron microscopy (TEM) and light microscopy have been pivotal in illuminating organelles' significant structures.
However, these are two-dimensional (2D) methods, and obtaining detailed three-dimensional (3D) images is the only way to thoroughly understand organelle structure and interaction within living cells. Therefore, one of the main objectives of cell biology is to image organelles in high-resolution 3D.
Amira™ software from Thermo Scientific™ was used with serial block-face scanning electron microscopy (SBF SEM) in a 2022 study published in Cells to produce comprehensive 3D reconstructions of organelles. The researchers could investigate the impact of gene inhibition on the morphology and function of mitochondria and the endoplasmic reticulum (ER) by directly evaluating organelle morphology.1
The roles of metabolic organelles
In various cellular functions, metabolic organelles, such as the mitochondria and ER, play crucial roles. Mitochondria are well-established as the organelles accountable for producing adenosine triphosphate (ATP) via oxidative phosphorylation.
ATP is the primary energy source for most physiological and biochemical functions, including homeostasis, mobility, and growth. This action is an essential last stage in cellular respiration. Therefore, fungi, animals, and bacteria must have mitochondrial oxidative phosphorylation to obtain energy from food and oxygen.
Mitochondria are known as “the powerhouse of the cell” due to this ability, but they also serve other purposes besides producing ATP. Mitochondria are essential for both apoptosis (cell death) and mitosis (cell division) (programmed cell death).2–4
For instance, dynamin-related protein-1 (DRP-1) controls mitochondrial fission because it is connected to the initial phases of apoptosis. Variations in pathways that regulate essential biomolecules, such as potassium and calcium, are linked to variations in mitochondrial ultrastructures.
This mitochondrial control of calcium seems to influence apoptosis while also impacting ER calcium levels, which, in turn, control mitosis.5 Owing to their roles in a varied range of biological processes, both mitochondria and the ER are favorable pharmaceutical targets for the treatment of viral and neurodegenerative diseases and cancer.
Understanding organelle dorm and function
While much is known about the biochemical profiles of organelles, comparatively little is known about the basics of their morphology or their interactions with each other at fairly large cellular length scales. It is generally acknowledged that only high-resolution 3D scanning of organelles inside intact cells is capable of providing a comprehensive understanding of organelle function.
Mitochondria is one example of how high-resolution 3D imaging could be used to explain the relationship between form and function in the domain of cellular biology. The inner membrane of mitochondria is pleated into folds known as cristae. While these folds seem ribbon-like in a 2D plane, they are essentially tubular structures that differ in both volume and area.
A collection of 3D reconstructions of mitochondria has offered biologists an improved understanding of the spatial distribution of metabolites, calcium stores, and cristae size.6 3D visualization has also offered an understanding of the function and structure of other subcellular structures such as the microtubules and ER.7
Electron microscopy in cell biology
Three-dimensional imaging of cells has been elusive for a long time, though recent advances in scanning electron microscopy provide a few promising approaches. SEM depends on the detection of backscattered electrons created when a focused beam of primary electrons interacts with a sample.
Although SEM itself is a successful 2D imaging method, using it along with ultra-thin sectioning can deliver a 3D image by scanning a sample layer-by-layer. For instance, focused ion beam SEM (FIB SEM) efficiently scans and eliminates layers by precisely ablating the top layer of a material after it has been imaged by SEM.
While this destroys the sample, individual 2D scans can be registered and examined to create 3D reconstructions with unparalleled resolution. SBF SEM is an associated method that substitutes the FIB with an in-chamber ultra-microtome/diamond knife to slice off thin layers between consecutive SEM scans.
While FIB SEM usually provides better z-axis resolution than SBF SEM (and thus offers intricate details of structures such as nanotunnels and cristae), SBF SEM often allows faster imaging of larger sample volumes.
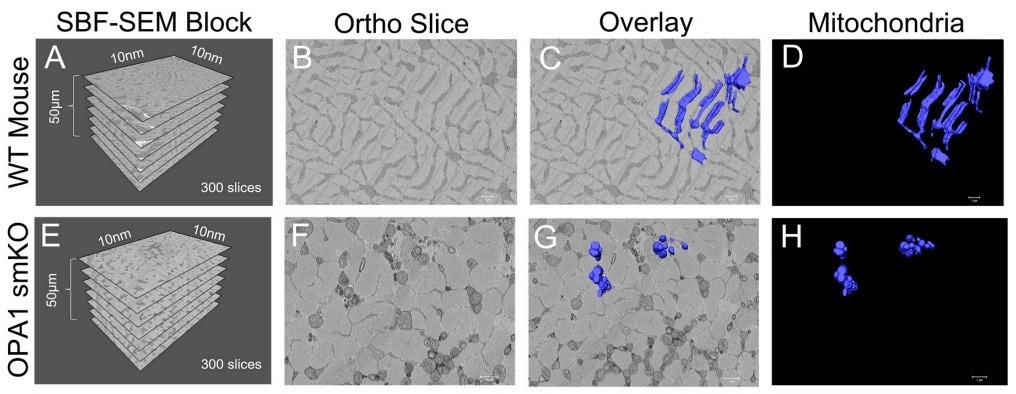
Figure 1. (A) The dimensions of the captured tissue in wild type mouse and (E) OPA1 smKO. (B,F) Example ortho slices for each. (C, G) The overlay of the 3D surface rendering of mitochondria for each. (D,H) The 3D surface rendering of mitochondria alone. Image Credit: Thermo Scientific - Software
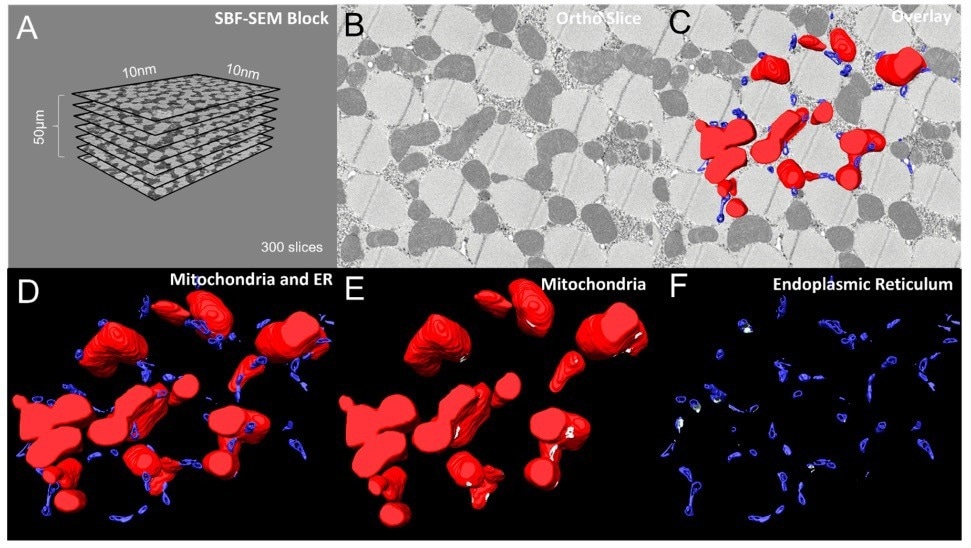
Figure 2. (A) Dimensions and quantities of Drosphilia-flight-muscle ortho slices used for data acquisition and conversion to 3D models. (B) A single ortho slice, (C) with overlaid 3D reconstructions of mitochondria (red) and ER (blue). (D) 3D reconstruction of mitochondria and ER. (E, F) Visualizations of mitochondria only (red) and ER only (blue respectively, with MERCs shown in white. Image Credit: Thermo Scientific - Software
Reconstructing and analyzing 3D organelles with Amira Software
Creating 3D images of organelles depends on the software that can segment and rebuild 3D structures from “stacks” of 2D images. While various software solutions have been designed for these functions, Amira Software has the unique advantage of integrated segmentation and 3D reconstruction, allowing scientists to speed up experimental workflows.
Amira Software is extremely flexible and adaptable: it provides an animation creation tool, compatibility with a broad array of import and export files, the ability to allocate diverse colors or “materials” to various organelles, and the formation of workflows with either semi-automated or manual segmentation.
Investigating the impact of specific genes on organelle morphology
The knockdown effects of two particular genes (mitofusin-2 (MFN-2) and optic atrophy-1 (OPA1)) on structure-function relationships in mitochondria and the ER were investigated in mKO-derived skeletal muscle cells. The OPA1 gene, which is dynamic in the cristae of mitochondria, plays several vital functions associated with mitochondrial structure and shape, including apoptosis and mitochondrial fusion.8,9
The gene is involved in oxidative phosphorylation and the upkeep of mitochondrial DNA (mtDNA). The MFN-2 gene is also said to have a vital role to play in mitochondrial structure. MFN-2 codes for a protein known as mitofusin 2, which is present in the outer membrane of mitochondria and establishes mitochondrial structure and shape.10
Mitofusin 2 controls the shape of mitochondria by influencing mitochondrial fusion. The SBF SEM was used to image control and knockdown cells, while the image data was segmented and examined by Amira Software subsequently. Mitochondria and ER volumes were assessed, and a comparison of the contact sites between these organelles before and after the knockdown of each gene of interest was performed.
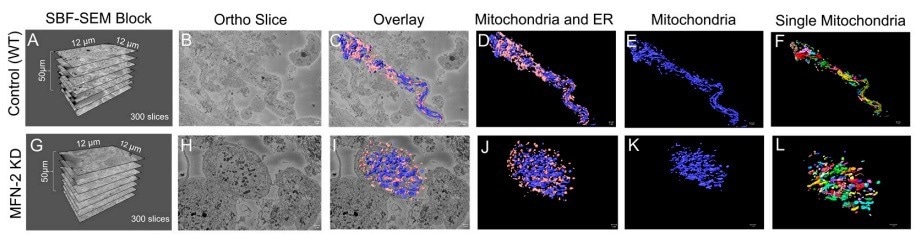
Figure 3. (A–D) The dimensions of the SBF-SEM tissues, an isolated ortho slice, a 3D reconstruction overlay, and an isolated 3D reconstruction of the wild-type myotubes. (E) 3D reconstructions of the wild-type myotubes are also shown, either with mitochondria individually colored or (F) the ER individually colored. (G–J) The dimensions of the SBF-SEM myotubes, an isolated ortho slice, a 3D reconstruction overlay, and an isolated 3D reconstruction of the MFN-2 deficient-myotubes. (K) 3D reconstructions of mitochondria can be shown as a single color or (L) individually colored. Image Credit: Thermo Scientific - Software
Results and discussion
Mitochondrial alterations in OPA1 knockdown smKO-derived skeletal muscle
Since OP1 promotes mitochondrial fusion (which increases the volume of mitochondria), it was hypothesized that OPA1 knockdown would decrease mitochondrial volume by preventing fusion.
SBF SEM and Amira Software were utilized to produce 3D reconstructions of mitochondria from the gastrocnemius muscle in OPA1 smKO mice. Superior quality 3D reconstructions facilitated mitochondrial identification, quantification, and measurement of the two samples.
When the 3D reconstructions were laid on ortho slices, it provided a means to envisage the positions of 3D organelles inside the context of a sample, while sequestered 3D reconstructions exposed finer details. The animation tool in Amira Software was utilized to create videos demonstrating mitochondria from numerous angles.
Using these visualization approaches, scientists could validate their predictions: the mitochondria in OPA1 cells were considerably minimized in length and volume compared to the wild-type controls. The 3D data specifies that OPA1 mutants formed fragmented, smaller mitochondria owing to amplified fission/reduced fusion caused by lower OPA1 levels.
Identifying mitochondria-ER contact sites (MERCs) using 3D reconstructions of drosophila flight muscle
Mitochondria and the ER overlap in function, and both have a vital role in progression, metabolism, and apoptosis through the cell cycle. Consequently, there is considerable interest in the sites where the two organelles overlap.
Referred to as mitochondria-ER contact sites, MERCs perform various crucial tasks, such as facilitating calcium transport from the ER to mitochondria and engaging in bio-signaling.11
MERCs are necessary for lipid and calcium signaling, which is required for mitochondrial fusion and fission. Amira Software was employed to produce 3D reconstructions of mitochondria as well as the ER in Drosophila flight muscle cells. To visualize the placements of these structures inside the cell, sample ortho slices were superimposed onto 3D reconstructions of mitochondria and ER.
Moreover, the mitochondria and ER were independently segmented using various “materials” in Amira Software for clear detection and quantification of the MERCs. Segmentation and reconstruction enabled the relative positions and orientations of mitochondria and the ER inside the cell to be visualized.
Amira Software simplified the viewing of the MERCs by “graying out” the contact points between the 3D mitochondria and ER models, which is otherwise very challenging to achieve.
Amira Software was employed to create animated videos comprising numerous MERCs together with detailed visualization of mitochondria and the ER. This animation depicts the sizes of MERCs throughout the mitochondria in greater detail.
Investigating the effects of MFN-2 knockdown on organelle morphology
Mitofusin-2 is a physical link between the ER and mitochondria, facilitating calcium transfer. It is also needed for mitochondrial fusion. MFN-2 gene knockdown causes ER stress and mitochondrial dysfunction.
The role of MERCs in MFN-2 is somewhat debatable, even though numerous studies have shown that loss of MFN2 boosts mitochondria-ER coupling.12,13 MFN-2 becomes essential for the proper functioning of cells as MERCs are critical to cellular homeostasis.
Amira Software was used to produce superior quality 3D reconstructions of MFN-2-deficient myotubes; mitochondria morphology in MFN-2 knockdown myotubes was compared to wild-type controls. Pseudo-coloring was applied to provide alternate methods of observing mitochondria and MERCs.
Amira Software measured the differences in the size, shape, and connectivity of the mitochondria and ER in MFN-2 deficient myotubes. The lengths and volumes of the MFN-2 mitochondria reduced in comparison to the wild-type controls and displayed minimized sphericity.
These findings indicate that mitochondrial dysfunction is a consequence of fusion abnormalities. As shown in a previous study, MERC volume and length reductions describe differences in MERCs.
Conclusions
These three studies highlight the strengths of Amira Software in SBF SEM image data processing, generating comprehensive 3D constructions of organelles. Superior quality 3D models developed using Amira Software offer detailed visualization of organelle dispersals and interactions and illuminate the most minute details of morphology.
This allows scientists to directly view the effects of genetic variations on the morphology of singular organelles instead of depending on biochemical signals to measure their behavior.
Amira Software is in high demand as a data visualization tool for cell biology applications because it provides unrivaled performance for a range of microscopy methods, such as FIB SEM, SBF SEM, (μ)CT, and MRI.
References and further reading
- Garza-Lopez, E et al. (2022) Protocols for Generating Surfaces and Measuring 3D Organelle Morphology Using Amira. Cells, 11, p. 65.
- Bratic, A and Larsson, NG. (2013) The role of mitochondria in aging. J Clin Invest, 123, p. 3.
- Olichon, A et al. (2003) Loss of OPA1 perturbates the mitochondrial inner membrane structure and integrity, leading to cytochrome c release and apoptosis. J Biol Chem. 278
- Otera, H et al. (2016) Drp1-dependent mitochondrial fission via MiD49/51 is essential for apoptotic cristae remodeling. J Cell Biol. 212
- Pinton, P et al. (2008) Calcium and apoptosis: ER-mitochondria Ca2+ transfer in the control of apoptosis. Oncogene. 27
- Wolf, SG et al. (2017) 3D visualization of mitochondrial solid-phase calcium stores in whole cells. eLife, 6, p. e29929
- Heinrich, L et al. (2021) Whole-cell organelle segmentation in volume electron microscopy. Nature, 599
- Suga, S et al. (2021) An interactive deep learning-based approach reveals mitochondrial cristae topologies. bioRxiv. Available at: https://www.biorxiv.org/content/10.1101/2021.06.11.448083v1
- OPA1 gene. Genetics. Available at: https://medlineplus.gov/
- MFN2 gene. Genetics. Available at: https://medlineplus.gov/
- Rowland, AA and Voeltz, GK. (2012) Endoplasmic reticulum–mitochondria contacts: function of the junction. Nature Reviews Molecular Cell Biology. 13
- de Brito, OM and Scorrano, L. (2008) Mitofusin 2 tethers endoplasmic reticulum to mitochondria. Nature, 45
- Filadi, R et al. (2018) Highlighting the endoplasmic reticulummitochondria connection: Focus on Mitofusin 2. Pharmacological Research, 128
Familiarize yourself with Amira Software for Cell Biology
With its advanced image processing, segmentation, quantification, and reporting features powered by artificial intelligence (AI), Amira Software can provide you with the tools you need to take your discoveries to the next level.
In this webinar:
- Using a range of readily available tools, including 3D Deep Learning model training you will learn how to accelerate subcellular (membrane, organelle) detection and segmentation from Electron Microscopy (TEM) data
- Analyze multichannel fluorescence endothelial cell culture data by performing fast and effective cleaning, volume colocalization, neighbor cell proximity, and segmentation
- Extract complex information in 3D, such as detection, segmentation and penetration of cancer or immune cells, to manage multichannel High Content Screening multi-well images of organoid models
- Quickly visualize, convert, and accurately process large (~100GB) multi-channel and time series light sheet tissue imaging data
Watch on-demand Webinar
Sponsored Content Policy: News-Medical.net publishes articles and related content that may be derived from sources where we have existing commercial relationships, provided such content adds value to the core editorial ethos of News-Medical.Net which is to educate and inform site visitors interested in medical research, science, medical devices and treatments.