When working in a lab, launching a quantitative PCR (qPCR) experiment demands a comprehensive understanding of complicated protocols, principles, and methodologies. Analyzing the large amounts of published qPCR data to choose the ideal experimental framework for your objectives means devoting significant expertise, time, and resources.
With professional advice, you can level up your qPCR assay. This white paper offers specific considerations for assay optimization and validation based on the practical application of the Minimum Information for Publication of Quantitative Real-Time (RT) PCR Experiments (MIQE) guidelines.1
Start with the why
Before taking on assay design optimization and validation, a holistic review of all workflow factors that impact assay performance, from sampling to data analysis, is important for your application. For instance, if the assay processes many samples in a limited time, the reaction speed and less costly designs should be prioritized over sensitivity and specificity. If, however, the application consists of sample scarcity, high specificity, and sensitivity, it will outweigh cost, throughput, or speed. Keep priorities in mind when choosing the appropriate optimization criteria and performance indicators for validation.
Assay design optimization
Establishing a range of appropriate assay performances and defining the ideal experimental conditions to arrive at optimal results can ensure robust performance for routine use of the assay. Assay optimization consists of evaluating and adjusting design elements to improve performance.
Two main areas for optimization include:
- Testing primer concentration for a mixture that provides the greatest specificity and sensitivity within your experimental parameters
- Primer anneal melting temperature (Tm) of thermocycling protocol.
Researchers should follow the recommendations below for precise characterization of assay sensitivity, specificity, and precision:
- Optimize primer and probe concentrations to the highest technical reproducibility at the lowest detection limit. The Good Practice Guide for the Application of Quantitative PCR (qPCR), page 77, contains protocols for testing primer concentration.
- Review the positive internal and external quality controls to ensure they remain positive when working near the detection limit. Consider the detection system used to decide whether to use a two-step or a three-step thermal cycling protocol.
Primer and probe selection
Select or design primers using priorities and research objectives. As well as following general design guidelines for choosing melting temperature (Tm), GC content, optimal primer length, etc., it is crucial to consider these other aspects of the target sequence:
- Be cautious when reviewing amplicon templates for secondary structures and repetitive regions to ensure the selection of primers and probes meets your target of interest.
- Is the target evolving quickly? Choose targets that show stability across numerous species, or consider using longer probes with internal quenchers that can tolerate
Most probe technologies will deliver results for various applications; choosing the ideal probe for your experimental conditions and downstream application is crucial for optimization. For further guidance on probe selection, see the how-to guide for qPCR probe selection and LGC Biosearch Technologies' online probe selection tool.
Assay validation
Following the design and optimization of your assay, an important step is assessing key performance parameters that can affect the assay’s efficiency, reproducibility, and technical dynamic range. This critical stage informs the next steps and the potential for future development and determines whether your qPCR assay meets the requirements of your target research or diagnostic application.
Common performance parameters
- Precision – The closeness of agreement between independent measurements.
- Bias – The difference between the anticipated test measurement and an accepted reference value.
- Specificity—The extent to which the methods can detect the target without interference from other, similar components.
- Sensitivity – The reproducibility to identify the lowest, defined detection limits.
- Robustness – Tolerance for potential experimental and/or operator errors, which could accumulate over time.
- Working range and linearity – The interval between the upper and lower concentrations of the target (limit of detection or LOD), deemed suitable for the assay, and the assay’s ability to create a result in direct proportion to the target concentration.
- Measurement uncertainty – The estimated range of values within which the true value of the measurement resides, indicating the reliability of the assay.
Below are recommendations for accurately characterizing assay specificity, sensitivity, and precision:
- Experimental tools like the Plackett-Burman designs can help when testing for robustness, as they streamline the process of systematically altering experimental parameters. The sensitivity will vary based on application. Check to ensure that the assay sensitivity satisfies your application standards.
- Assessments of measurement uncertainty include all potential sources of variation in the measurement process, both systemic and random. This range indicates the error bar for the measurements in your assay.
Standard curve
The most common method for assessing assay performance is generating a standard curve, which relates the cycle quantification (Cq) values of a known concentration of your template to the corresponding initial template concentrations.
Assessing the linearity over the entirety of the desired test/experiment is important. The R2 value shows how well the data fits the standard curve straight line and measures reproducibility. If you see any of these features in your standard curve, additional assay optimization is advised:
- R2 ≤0.985: The results may not be reliable overall.
- Non-linearity at the highest concentration: The reaction may be saturated, and the target concentration is outside the effective measurement range.
- Non-linearity at low template concentrations: The concentration may drop below the assay's sensitivity.
- Non-linearity at random points: Pipetting accuracy has been compromised, or the assay might require re-optimization.
If the qPCR assay is being developed to detect low amounts of target DNA (less than ten copies per reaction), minimize the effect of stochastic variation by creating a consensus profile built from an analysis of more technical replicates.3 Validation studies can be used to create data interpretation guidelines.
Maximize pipetting accuracy
Pipetting is a typical source of systemic variables in qPCR assays. To reduce pipetting errors, the sample should comprise 40% of the reaction volume per well, with the master mix providing the remaining 60%.4
This ratio reduces variability, enabling the use of the same pipette and tips while allowing efficient sample mixing in the reaction mix.
The reaction mix volume corresponds to the pipette midrange, which is crucial for greater accuracy.2
Assay normalization
Normalization to a reference gene accounts for variance in how much sample is added to the reaction. Normalization is intended to account for the potential technical variability in each step of the qPCR protocol. The best practice is to leverage a mixture of normalization methods to address challenges at every protocol step.
Biological sample normalization
Researchers must be prepared to address inherent heterogeneity in biological samples, such as variations in nucleic acid concentration, cell count, and composition.
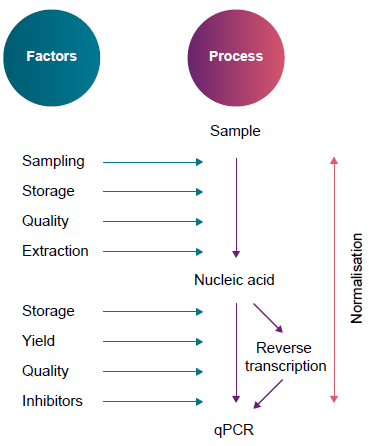
Figure A. Twelve factors that can affect a qPCR assay. Image Credit: LGC Biosearch Technologies
Researchers can normalize purified nucleic acids through routine measurements via absorbance or fluorescence-based methods. Absorbance is simpler, but fluorescence is more sensitive and accurate.
Assay normalization
Variations can be introduced during sample preparation, processing, or experimental protocols. Including internal (e.g., measure reference gene expression) and external quality controls is important. Controls with known concentrations/copy numbers allow for assessing factors related to each sample that may affect the assay’s PCR efficiency.
Analysis normalization
Varying the amount of reaction mix added to wells, tubes, or the optics shuttle lightpath between wells can alter the amount of fluorescence signal read. Therefore, researchers should include a passive reference dye, such as ROX, in the reaction mix. This can normalize fluorescent signal intensity caused by inconsistent pipetting, evaporation, and light source variations.
Data analysis
Data analysis in qPCR consists of collecting and reviewing the raw data, assessing its quality and reliability, and generating reported results. Researchers should relay detailed information about the data analysis strategies and confidence, including software, statistical methods, and accuracy assessments.
Baseline correction
Baseline fluorescence can affect amplification curves and impede the quantitative comparison of samples. Some elements that may contribute to baseline fluorescence include:
- Selection of plasticware
- Unquenched probes
- Signal carryover in nearby sample wells
Fluorescence seen in the early stages of the qPCR run can be used to identify the linear component (e.g., cycles 3-10) and normalize the remaining sample signals against these readings.
It is important to carefully consider which cycles to utilize for baseline fluorescence. More cycles increase the possible linear component accuracy, but they also result in greater fluorescence from target amplification, making these readings inappropriate for baseline correction. Any cycle with increased fluorescence needs to be eliminated from baseline normalization.
Researchers can review their qPCR instrument’s automatic settings and ensure they are adjusted to their specifications. Dye calibration standards can optimize signal detection and reduce crosstalk between fluorescence channels.
Setting a threshold
The threshold should be greater than the baseline fluorescence and indicate the exponential amplification phase. qPCR software can set the incorrect threshold, which affects Cq values. This potentially misses detecting samples with lower amounts of template or variations of Cq values between different controls and samples, affecting relative quantification.
Researchers should read the cycle from each log-linear curve to decide each sample quantity. They should compare samples on the same reaction run, as the threshold will be set at the same point for all samples tested. The threshold should be set as low as possible while staying above the fluorescence baseline. It should be adjusted for different dyes to compensate for differences in fluorescence.
Get the most out of your qPCR assay
LGC Biosearch Technologies has supported labs developing qPCR-based assays for more than 40 years. With a wide array of services and products and a flexible partnership approach, blending its labs with yours at each assay development stage is simple. The company’s resources can match your vision:
- Quality nucleic acid isolation: Maximize the reliability and accuracy of your results by matching isolation chemistry with experimental requirements and sample type. LGC offers a variety of nucleic acid isolation technologies, including QuickExtractTM for easy, fast extraction and superparametic bead-based extraction with sbeadexTM
- Enzymes and reagents: Begin with high-quality off-the-shelf enzymes and reagents, then use LGC’s customization options to optimize assay performance from early method development to large-scale production.
- Custom oligo synthesis: Design precisely what is needed with many options. More than seven probe types and hundreds of modifications are available, so you can focus on the science and leave the synthesis to them.
- LGC offers assay design and development support, as well as lab and manufacturing services.
References
- Bustin S.A et al. The MIQE Guidelines: Minimum Information for Publication of Quantitative Real- Time PCR Experiments. Clinical Chemistry 55(4):611-622 (2009). Available from: http://doi.org/10.1373/clinchem.2008.112797
- Nolan T. et al. Good practice guide for the application of quantitative PCR (qPCR). LGC (2013). Available from: http://doi.org/10.13140/RG.2.2.15943.96162
- Butler J, Hill C. Scientific Issues with Analysis of Low Amounts of DNA. Profiles in DNA. Available from: https://www.promega.co.uk/resources/profiles-in-dna/2010/scientific-issues-with-analysis-of-low-amounts-of-dna/
- Taylor S, Nadeau K, Abbasi M et al. The Ultimate qPCR Experiment: Producing Publication Quality, Reproducible Data the First Time. Trends in Biotechnology. https://doi.org/10.1016/j.tibtech.2018.12.002. Published January 14, 2019. Accessed January 16, 2024.
About LGC Biosearch Technologies
LGC Biosearch Technologies™ is a global leader in the design, development, and manufacture of sophisticated custom oligonucleotide-based tools and mission-critical components for the molecular diagnostic, research and applied markets. With operations in 18 countries, LGC’s products and services are sold in around 180 countries globally with manufacturing sites across the world to effectively serve you wherever you are located.
Sponsored Content Policy: News-Medical.net publishes articles and related content that may be derived from sources where we have existing commercial relationships, provided such content adds value to the core editorial ethos of News-Medical.Net which is to educate and inform site visitors interested in medical research, science, medical devices and treatments.