Sponsored Content by HORIBAReviewed by Olivia FrostMar 26 2026
The new HORIBA Duetta fluorescence and absorbance spectrometer offers numerous unique benefits for molecular spectroscopy.
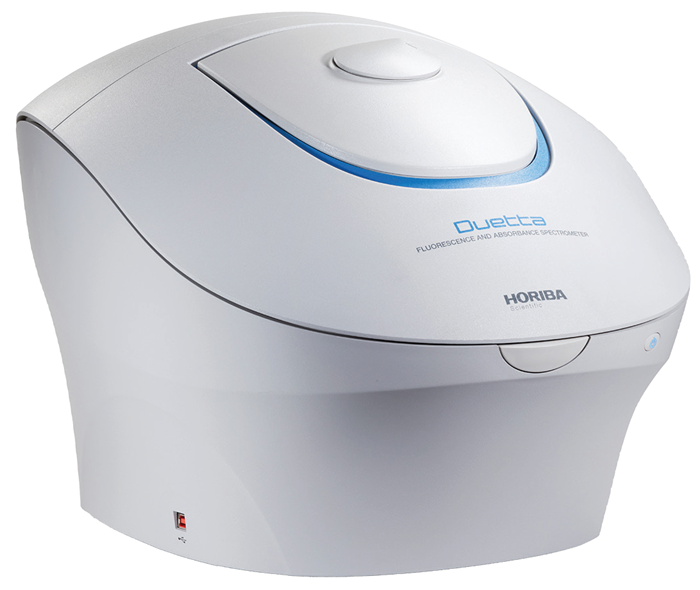
Figure 1. Duetta 2-in-1 fluorescence and absorbance spectrometer. Image Credit: HORIBA
It is primarily recognized as a spectrofluorometer that integrates absorbance and fluorescence spectroscopy to correct for concentration-related effects known as the fluorescence fingerprint.
It is essential to note that the Duetta can also function as a precise absorbance spectrometer. The study presented in this article examines the Duetta's use in a common absorbance application: the Protein A280 assay.
Protein A280
Determining protein concentration is often required in protein biochemistry and molecular biology studies. The concentration of a protein can be obtained by measuring the absorbance at 280 nm and applying the Beer-Lambert law (Equation 1):
Equation 1. Beer-Lambert law
A = ∈*b*c
Here, A represents absorbance, ∈ denotes molar absorptivity in M-1cm-1, b is the cell path length in cm, and c is the concentration in M (mol/L).
To determine the molar absorptivity of a protein at 280 nm (∈280), the Edelhoch method is used, which uses the number of tryptophan, tyrosine, and cysteine residues in the protein to calculate ∈280 according to Equation 2.1
Equation 2. Protein Absorptivity at 280 nm calculated from the number of tryptophan, tyrosine, and cysteine amino acid residues in the protein sequence
∈280 nm = (#Trp*5500) + (#Tyr*1490) + (#Cys*125)
The Duetta 2-in-1 fluorescence and absorbance spectrometer features a software application called Protein A280. This application measures the absorbance of a protein solution and calculates its concentration based on its known amino acid composition.
This user-friendly application in the EzSpec software streamlines protein determination.
Equation 3. Beer-Lambert law applied to calculate protein concentration from Absorbance at 280 nm (A280), cell path length (b), and calculated molar absorptivity (∈280 nm)
[protein] = A280/(b*∈280 nm)
Experiment and results
The absorbance spectra of bovine serum albumin (BSA) were collected for a range of dilutions. The structure of BSA is illustrated in Figure 2.
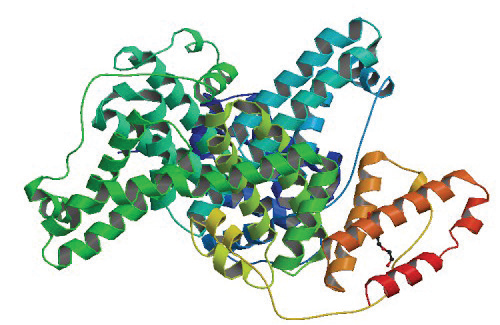
Figure 2. Structure of bovine serum albumin protein (Bujacz, 2012). Image Credit: HORIBA
The concentration of each solution was determined using the Protein A280 application, employing parameters such as a 3 nm band pass, 0.1 sec integration time, and scanning absorbance from 250 nm to 450 nm in 1 nm increments.
For the Protein A280 application to calculate the total combined molar absorptivity of BSA, and its concentration, the number of tryptophan, tyrosine, and cysteine residues present need to be inputted. This method icon is depicted in Figure 3.
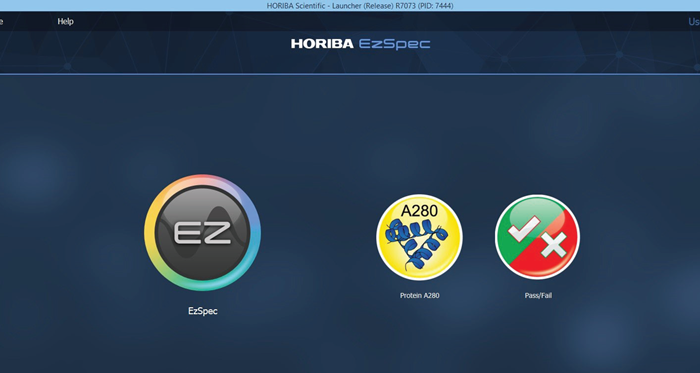
Figure 3. Duetta’s EzSpec software launcher screen displays the Protein A280 App that opens a dedicated applications program. Image Credit: HORIBA
BSA contains three tryptophan residues, 21 tyrosine residues, and 35 cysteine residues. This information was input into the Protein A280 software application. The structure of BSA was sourced from the protein data bank entry.2
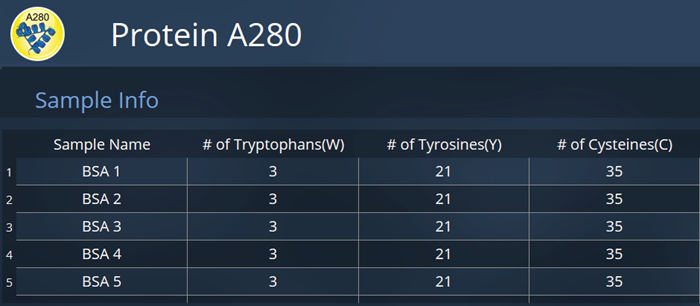
Figure 4. Method window for the Protein A280 App, with sample information input for absorbance measurement of bovine serum albumin solutions. Image Credit: HORIBA
The absorbance spectrum of the BSA dilution series, which displays a peak around 280 nm, is presented in Figure 4.
Based on the absorbance at 280 nm, the number of tryptophan residues, and the combined molar absorptivity, Protein A280 calculated values for each solution, summarized in the table shown in Figure 5.
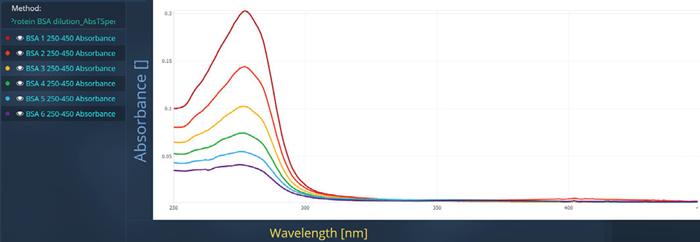
Figure 5. Spectra measured for BSA on Duetta in Protein A280 Application. Image Credit: HORIBA 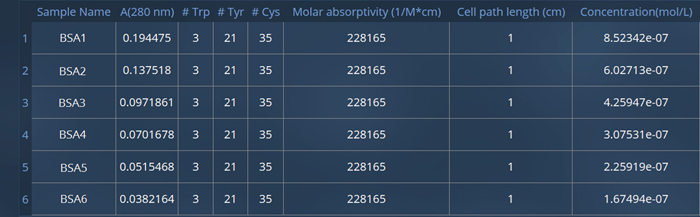
Figure 6. Protein A280 molar absorptivity and concentration results for six solutions of BSA protein. Image Credit: HORIBA
Conclusions
The Protein A280 application in EzSpec software enables users to determine the concentration of a protein solution efficiently. In this experiment, the concentrations of six BSA solutions were determined, ranging from 0.7 to 3.7 μM.
The Duetta can measure this specific protein over a concentration range of 10 nM to approximately 20 μM (absorbance peak range of 0.005 to >1.0). The concentration ranges for other proteins will vary based on their molar absorptivity.
The Duetta 2-in-1 fluorescence and absorbance spectrometer is designed to conveniently measure protein absorbance and concentration.
References and further reading
- Edelhoch, H. (1967). Spectroscopic Determination of Tryptophan and Tyrosine in Proteins*. Biochemistry, 6(7), pp.1948–1954. https://doi.org/10.1021/bi00859a010.
- Bank, R.P.D. RCSB PDB - 4F5S: Crystal Structure of Bovine Serum Albumin. (online) RCSB. Available at: https://www.rcsb.org/structure/4F5S.
- Pace, C.N., et al. (1995). How to measure and predict the molar absorption coefficient of a protein. Protein Science, 4(11), pp.2411–2423. https://doi.org/10.1002/pro.5560041120.
- Gill, S.C. and von Hippel, P.H. (1989). Calculation of protein extinction coefficients from amino acid sequence data. Analytical Biochemistry, (online) 182(2), pp.319–326. https://doi.org/10.1016/0003-2697(89)90602-7.
About HORIBA

Founded in 1953, HORIBA has explored a wide range of unique measurement and analysis technologies to meet global customer needs from 47 group companies and local sites spread across 29 countries and regions. Under the corporate motto Joy and Fun, the company has expanded and refined its core technologies to solve society's energy issues of today and tomorrow. Our unique measurement and analysis technologies are valued in various fields of society, including the three megatrend business fields of Energy & Environment, Biology & Healthcare, and Materials & Semiconductors. For more Information on HORIBA, visit https://www.horiba.com/int/company/about-horiba/home/
Sponsored Content Policy: News-Medical.net publishes articles and related content that may be derived from sources where we have existing commercial relationships, provided such content adds value to the core editorial ethos of News-Medical.Net which is to educate and inform site visitors interested in medical research, science, medical devices and treatments.