Sponsored Content by HORIBAReviewed by Olivia FrostMar 26 2026
Raman spectroscopy is widely acknowledged as a powerful analytical technique for studying the chemical composition of materials within the framework of qualitative analysis.
However, under certain conditions, Raman spectroscopy can also serve as an effective method for quantitative analysis.
This technique enables rapid, non-destructive quantitative analyses with minimal sample preparation for liquid and solution samples. Raman spectroscopy provides direct chemical information about analytes alongside quantitative data.
Furthermore, the advent of compact, cost-effective benchtop Raman spectrometers has facilitated such analyses in diverse settings, ranging from undergraduate chemistry laboratories to industrial environments.
In the study presented in this article, Raman spectroscopy was employed to conduct quantitative analyses of a simple solution consisting of a single solute dissolved in water, an azeotropic mixture of two liquids (water and ethanol), and a complex solution comprising multiple solutes dissolved in a buffer.
It is demonstrated that Raman spectroscopy can generate calibration curves to predict the concentration of complex solutions. These curves can subsequently be used to accurately determine the concentrations (or dosages) of active pharmaceutical ingredients (APIs) in pharmaceutical products such as Excedrin®, NyQuil®, and DayQuil®.
The Raman spectroscopic data presented in this work was collected using a MacroRAM™, a benchtop Raman spectrometer. Data processing and analysis were conducted via the LabSpec 6 Spectroscopy Suite.
Simple solution
The development of a calibration curve for quantitative analysis using Raman spectroscopy with a simple solution of one solute (guanidine hydrochloride) and one solvent (water) has been discussed in previous studies.1
Raman spectra were collected from guanidine hydrochloride at the following concentrations: 0.25, 0.50, 1.0, 2.0, 4.0, 6.0, and 8.0 M (see Figure 1).
The Raman band at 1011 cm-1 was chosen as the marker band to represent guanidine hydrochloride. This marker band was fitted with a Gaussian+Lorentzian (G+L) curve, and the peak area was calculated.
The average peak areas from three sets of measurements were plotted as a function of concentration. Figure 1 illustrates a linear relationship between peak area and concentration, with consistent peak area values for each concentration.
The standard deviation among the three data sets was negligible compared to the differences in values between data points, thus resulting in a reliable calibration curve.
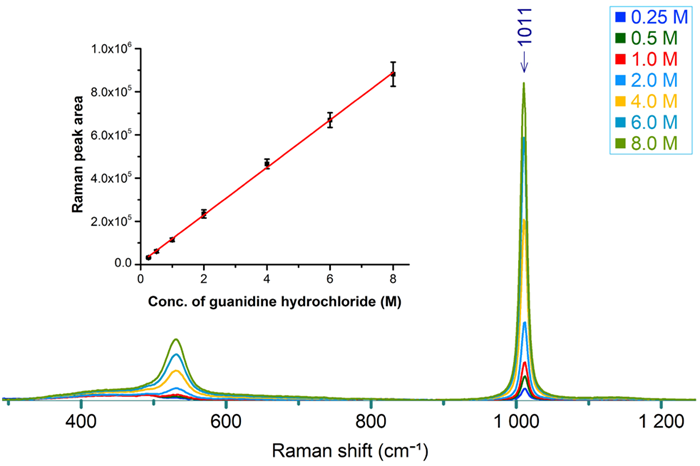
Figure 1. Raman spectra from 0.25, 0.50, 1.0, 2.0, 4.0, 6.0, and 8.0 M guanidine hydrochloride. Inset shows a calibration curve between 1011 cm-1 peak area and the concentration. Image Credit: HORIBA
The paper reviewed here broadens this discussion, including the analysis of more complicated solutions and mixtures.
Another simple solution
Acetaminophen was dissolved in pH 2.4 HCl at 37 °C and prepared a series of solutions with concentrations ranging from 0.5 to 2.5 mg/mL. Raman spectra were recorded in triplicate measurements.
The Raman band at 1330 cm-1 was selected as the marker band. The peak area of this marker band was measured following baseline subtraction and plotted as a function of concentration.
As depicted in Figure 2, a linear relationship between peak area and acetaminophen concentration was observed.
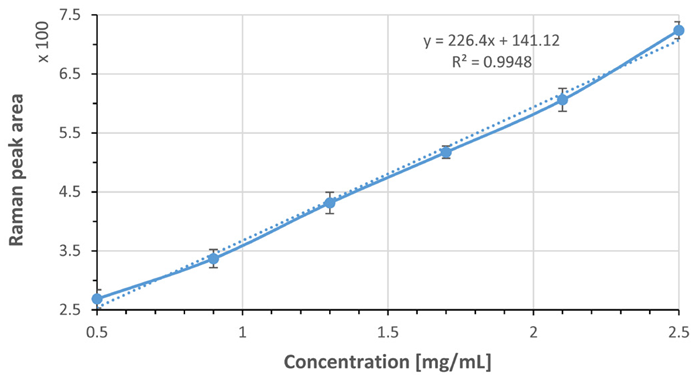
Figure 2. Peak area of the marker band at 1330 cm-1 of acetaminophen was used to develop a calibration curve over 0.5 – 2.5 mg/ml range. Each data point was averaged from 3 measurements and error bars indicating standard deviation are shown, as well as linear trendlines (dotted) along with line equations. Image Credit: HORIBA
Application of calibration curve
DayQuil™ Cold & Flu and NyQuil™ Cold & Flu liquid dosages were used as model systems to apply the calibration curve.
DayQuil™ Cold & Flu contains 650 mg of acetaminophen in a 30 mL dose, while NyQuil™ Cold & Flu contains 325 mg of acetaminophen in a 15 mL dose.2
Three aliquots of each dosage were diluted tenfold before measuring the Raman spectra (see Figure 3). The concentration of the diluted dosage was anticipated to be approximately 2.17 mg/mL.
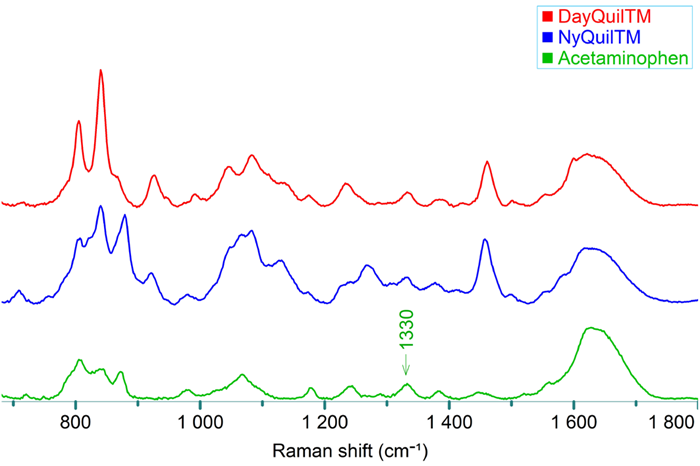
Figure 3. Raman spectra of DayQuil™, NyQuil™, and acetaminophen (Sigma-Aldrich, 2.5 mg/mL in HCl). Image Credit: HORIBA
Raman spectra of the diluted DayQuil™ and NyQuil™ were recorded using an immersion probe (see Figure 4), simulating the measurement method used in a mixing or dissolution batch.
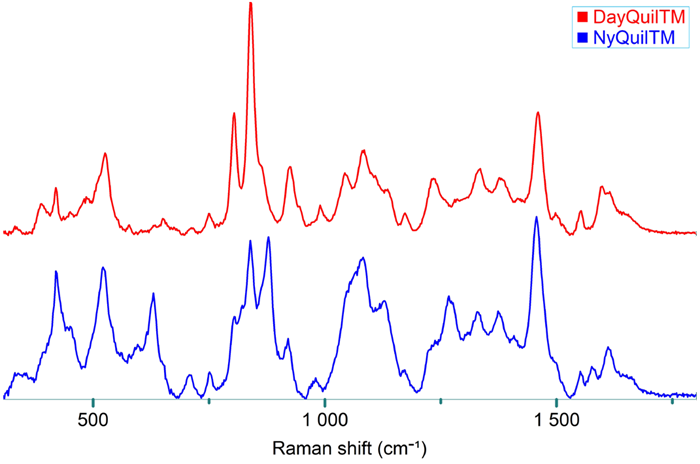
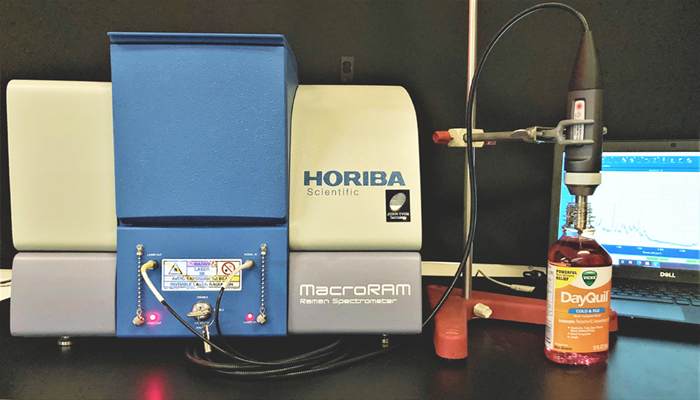
Figure 4. Raman spectra of DayQuil™ and NyQuil™ collected with an immersion probe fiber-coupled to the MacroRAM™ Raman spectrometer, and a picture of the immersion probe setup. Image Credit: HORIBA
Using the calibration curve developed (left, Figure 2) and the peak areas of Raman bands at approximately 1330 cm-1 in the Raman spectra of DayQuil™ and NyQuil™, acetaminophen concentrations were estimated at 2.37 mg/mL and 1.91 mg/mL, respectively.
It is important to note that these results were derived from univariate analysis based on peak area and are based on a calibration curve developed from pure acetaminophen.
Analysis of complex mixtures
Raman spectroscopy can also be employed to quantitatively analyze complex mixtures, such as a water and ethanol mixture.
When water and ethanol are combined, they exhibit volume contraction (the volume of the mixture is less than the sum of the volumes of the individual components) due to enhanced hydrogen bonding.
The extent of this contraction is non-linearly dependent on the ratio of the individual components, complicating the calibration curve.
The mixtures were prepared with ethanol weight/weight (%) concentrations of 0, 10, 30, 50, 70, 90, and 100 %. Raman spectra were recorded for each percentage, and the data were averaged over five repetitions (see Figure 5).
The 884 cm-1 peak from ethanol was selected as the marker band for ethanol (see Figure 5 inset), and the peak area was calculated using univariate analysis.
These peak areas were then plotted as a function of ethanol weight/weight (%), volume/volume (%), and molarity (see Figure 6).
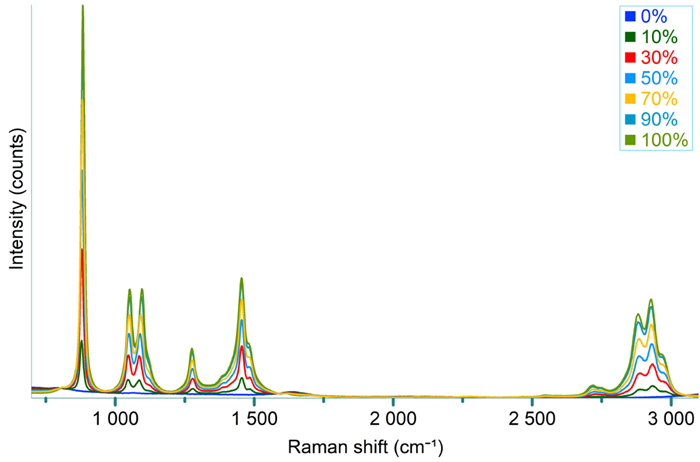
Figure 5. Raman spectra recorded from a series of ethanol-water mixtures, with ethanol wt/wt (%) percentage ranging from 0 to 100%. The peak area of the 884 cm-1 ethanol peak (inset) was used for building a calibration curve. Image Credit: HORIBA
A linear relationship is often assumed between concentration and spectral intensity; however, this is not always applicable for complex solutions containing multiple solutes, such as ethanol and water.
The relationship, and consequently the calibration curve, varies depending on the chosen concentration unit, which is often selected for convenience and convention.
The peak areas of the ethanol marker band exhibit a linear relationship concerning ethanol concentrations in volume/volume (%) (see Figure 6a) and molarity (see Figure 6b), resulting in linear calibration curves.
Conversely, the weight/weight (%) relationship is more accurately represented by a second-order polynomial (see Figure 6d) rather than a linear model (see Figure 6c).
This non-linearity arises from the volume contraction of the mixtures, which is more pronounced when the weight/weight (%) is closer to 50 % (e.g., 30 %, 50 %, and 70 %) compared to purer liquids (e.g., 0 %, 10 %, 90 %, and 100 % ethanol).3,4
This demonstrates that reliable calibration curves can be established using Raman spectroscopy, even for complicated solutions and mixtures, and these curves may reflect corresponding complexities.
Similar relationships between the micro-environment of specific molecular groups and their vibrations have been documented.5
Analysis of more complicated solutions
Raman spectroscopy can also be used to quantitatively analyze complicated solutions containing multiple solutes.
Stock solutions were prepared by dissolving aspirin, acetaminophen, and caffeine in pH 2.4 HCl at 37 °C, incorporating sodium lauryl sulfate (SLS) to achieve approximately 3.5 mg/mL.
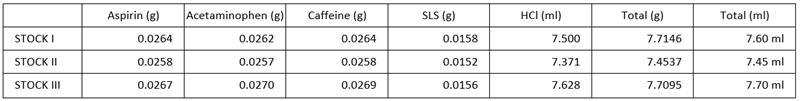
Three equivalent sets of solutions were prepared by creating three stock solutions (see Table 1), followed by successive dilutions of each stock solution.
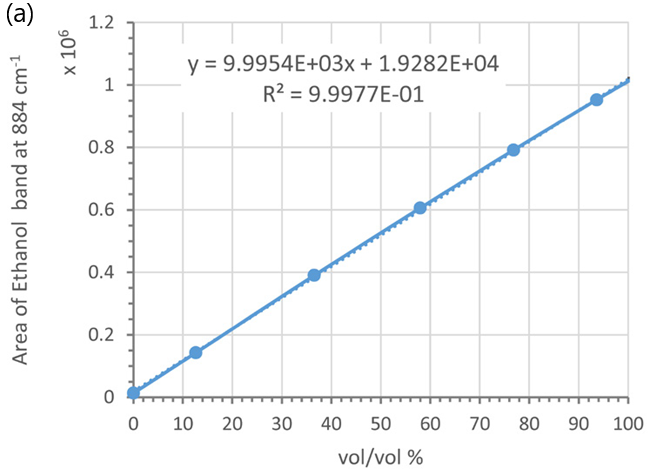
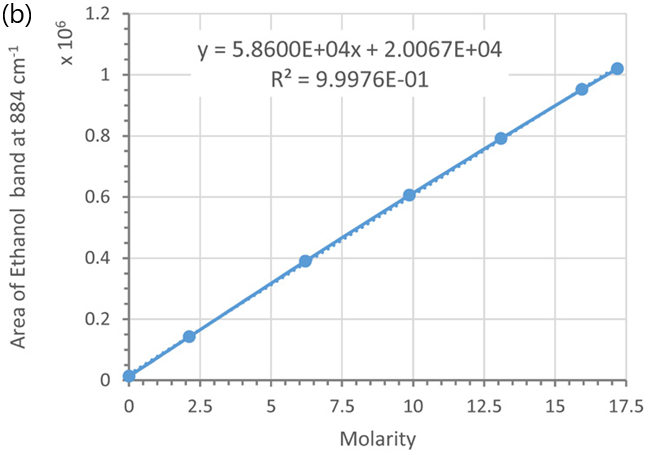
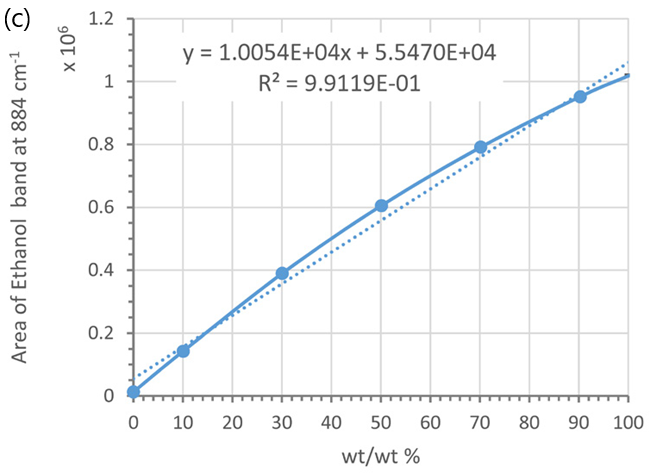
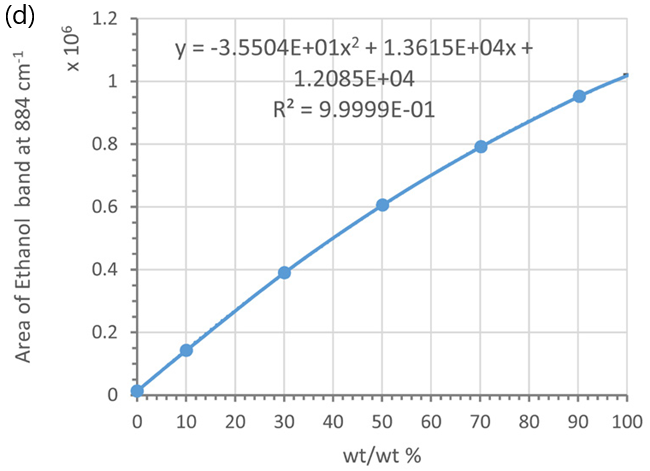
Figure 6. Calibration curves using the marker band of ethanol at 884 cm-1 and different concentration units: (a) vol/vol % and (b) molarity; (c) and (d) wt/wt %, Each data point was averaged from 5 measurements. Error bars indicate standard deviations. Dotted lines are trend-lines. Their equations and R2 values are shown in the plot. Image Credit: HORIBA UK
Table 1. Stock solution formulation. Source: HORIBA
Raman spectra were recorded using triplicate measurements of each solution. Raman bands at 1043 cm-1, 870 cm-1, and 565 cm-1 were identified as marker bands for aspirin, acetaminophen, and caffeine, respectively.
Following baseline subtraction, the peak areas of these marker bands are plotted against the corresponding concentrations of the materials (see Figure 7). All three solutes demonstrate linear relationships relative to their concentrations.
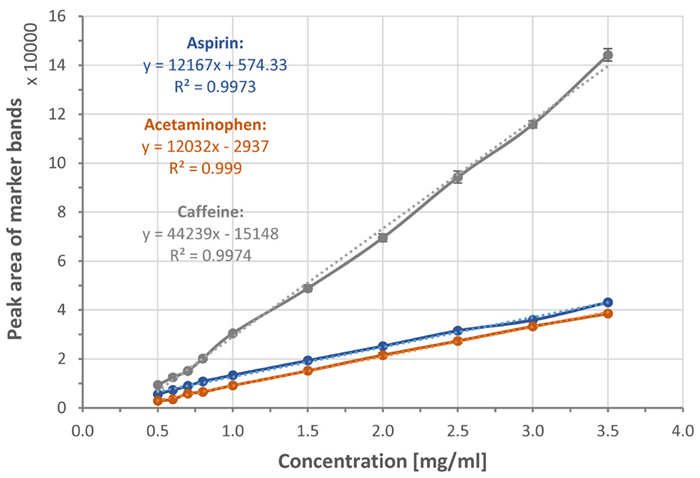
Figure 7. Calibration curves and linear trend lines (dotted lines) showing peak area of 1043 cm-1, 870 cm-1, and 565 cm-1, marker bands of aspirin, acetaminophen, and caffeine respectively, plotted with respect to corresponding material’s concentration. Each data point was averaged from 3 measurements. Error bars indicate standard deviations. Dotted lines are trend-lines. Their equations and R2 values are shown in the plot. Image Credit: HORIBA
Application of calibration curves
Raman spectroscopy can also predict the concentrations of active pharmaceutical ingredients (APIs) in a dissolution study.
To illustrate this, Excedrin® Extra Strength was selected as a model system. Each tablet of Excedrin® Extra Strength contains three APIs: aspirin (250 mg), acetaminophen (250 mg), and caffeine (65 mg).6
The dissolution conditions were designed to simulate the administration of an oral dosage form.7 The dissolution medium consisted of pH 2.4 HCl (approximately 0.01 M) at 37 °C, reflecting gastric fluid conditions.
Since aspirin has low water solubility, sodium lauryl sulfate (SLS), a surfactant, was used to aid in the wetting and dissolution of the APIs.8 SLS is commonly employed for this purpose in drug formulations. Excedrin® Extra Strength also contains other inactive ingredients.
Each of the four Excedrin® tablets was dissolved in 100 mL of pH approximately 2.3 HCl at 37 °C overnight. The anticipated concentrations were approximately 2.50 mg/mL of both aspirin and acetaminophen, and approximately 0.65 mg/mL of caffeine upon complete dissolution.
It is important to note that the tablet did not fully dissolve; it partially dissolved, leaving a fine white precipitate at the bottom. These residuals were assumed to be inactive ingredients, such as cellulose, as prior studies have established that the solubilities of aspirin, acetaminophen, and caffeine in HCl exceed approximately 3 mg/mL.
Raman spectra were recorded from three aliquots drawn from the dissolved portion. The Raman bands at 1043 cm-1, 870 cm-1, and 565 cm-1 were selected as marker bands for aspirin, acetaminophen, and caffeine, respectively.
After baseline subtraction, the peak areas of these marker bands were quantified. Any spectral contributions in this range from inactive ingredients were deemed negligible, as the collective mass of the APIs constitutes over 80 % of the tablet's total mass.
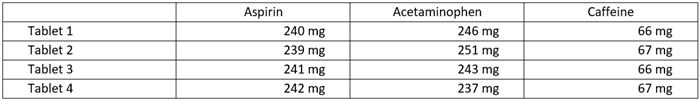
The dosages of the APIs were predicted (see Table 2) using the linear calibration curves established earlier (see Figure 7) and the weights of the tablets.
Table 2. Estimated API dosages per tablet of Excedrin® Extra Strength. Source: HORIBA
Conclusions
It has been demonstrated that Raman spectroscopy can be effectively employed for both qualitative and quantitative analysis of materials.
The study discussed here presents various examples of how this technique can be applied to different systems. Raman spectra measured from a range of concentrations of guanidine hydrochloride exhibited a linear dependence on the signal.
More complicated solutions, such as mixtures of ethanol and water, were tested, revealing that differing degrees of hydrogen bonding based on varying ratios of individual component volumes can lead to volume contraction.
The calibration curve may be linear or polynomial, depending on the chosen concentration unit.
Finally, calibration curves were established for aspirin, acetaminophen, and caffeine and applied to pharmaceutical products such as Excedrin®, DayQuil™, and NyQuil™.
This methodology is expected to benefit both dissolution testing studies and investigations in process and analytical systems.
Acknowledgements
Produced from material originally authored by Maruda Shanmugasundaram from HORIBA Instruments.
References and further reading
- AFM-Raman, R. and Ters. ELEMENTAL ANALYSIS FLUORESCENCE GRATINGS & OEM SPECTROMETERS OPTICAL COMPONENTS CUSTOM SOLUTIONS PARTICLE CHARACTERIZATION Quantitative Analysis Using Raman Spectroscopy Rapid, Non-Destructive Analysis of Liquid and Solid Samples. (online) Available at: https://static.horiba.com/fileadmin/Horiba/Products/Scientific/Molecular_and_Microanalysis/MacroRAM/RA-TN05-Quantitative_Analysis_using_Raman_Spectroscopy_MacroRAM.pdf.
- Vicks. Vicks DayQuil™/NyQuil™ Cold & Flu Relief Liquid Co-Pack. (online) Available at: https://vicks.com/en-us/shop-products/dayquil/dayquil-nyquil-cold-flu-relief-liquid-co-pack.
- Washburn, E.R. (1929). The measurement of change in volume on solution. Journal of Chemical Education, 6(6), p.1144. https://doi.org/10.1021/ed006p1144.
- Lee, I., Park, K. and Lee, J. (2013). Precision density and volume contraction measurements of ethanol–water binary mixtures using suspended microchannel resonators. Sensors and Actuators A: Physical, 194, pp.62–66. https://doi.org/10.1016/j.sna.2013.01.046.
- Pelletier, M.J. (2003). Quantitative Analysis Using Raman Spectrometry. Applied Spectroscopy, 57(1), pp.20A42A. https://doi.org/10.1366/000370203321165133.
- Excedrin. Excedrin Extra Strength Headache and Pain Relief. (online) Available at: https://www.excedrin.com/products/extra-strength/.
- Qureshi, S. (2009). Drug dissolution testing: selecting a dissolution medium for solid oral products dissolution. (online) 12(1). Available at: https://www.researchgate.net/publication/290077381_Drug_dissolution_testing_selecting_a_dissolution_medium_for_solid_oral_products_dissolution.
- van der Merwe, J., et al. (2020). The Role of Functional Excipients in Solid Oral Dosage Forms to Overcome Poor Drug Dissolution and Bioavailability. Pharmaceutics, (online) 12(5), p.393. https://doi.org/10.3390/pharmaceutics12050393.
About HORIBA

Founded in 1953, HORIBA has explored a wide range of unique measurement and analysis technologies to meet global customer needs from 47 group companies and local sites spread across 29 countries and regions. Under the corporate motto Joy and Fun, the company has expanded and refined its core technologies to solve society's energy issues of today and tomorrow. Our unique measurement and analysis technologies are valued in various fields of society, including the three megatrend business fields of Energy & Environment, Biology & Healthcare, and Materials & Semiconductors. For more Information on HORIBA, visit https://www.horiba.com/int/company/about-horiba/home/
Sponsored Content Policy: News-Medical.net publishes articles and related content that may be derived from sources where we have existing commercial relationships, provided such content adds value to the core editorial ethos of News-Medical.Net which is to educate and inform site visitors interested in medical research, science, medical devices and treatments.