The COVID-19 pandemic has brought epidemiology into the spotlight. Outbreaks, epidemic peaks, and transmission waves are all topics of discussion. However, there is no agreed universal definition of these concepts. The phrase 'epidemic wave' can refer to anything from a well-defined attribute of a mathematical object to a loosely defined component of a time series. Despite the limitations with definitions, these descriptive phrases are useful for planning and public health.
Severe acute respiratory syndrome coronavirus 2 (SARS‑CoV‑2), the causative agent of the pandemic, has spread over the world since it first emerged in Wuhan, China, in late December 2019. Non-pharmaceutical interventions (NPIs) were conducted at various levels of rigor and speed by governments around the world in an attempt to prevent and reduce the virus's importation and local spread. Unfortunately, these NPIs frequently come at a high price. Therefore it's critical to figure out how to cut transmission costs as effectively as possible. Moreover, given the numerous potential drivers of regional heterogeneities, understanding the epidemic in a single nation is difficult; drawing meaningful comparisons between countries is even more difficult.
In this research paper, a team of scientists from various institutions across the UK and Poland provides contributions aimed at resolving this issue. First, the authors clarify the multiple ways researchers use the word 'epidemic wave.' Their technique divides epidemic time series (of confirmed cases and deaths) into non-overlapping 'observed waves.' It is emphasized that this is not another definition of an epidemic wave but rather an exercise in highlighting some of the traits that any viable definition should include. As a result of this analysis, the authors present a more nuanced interpretation of the data.
A preprint version of this study, which is yet to undergo peer review, is currently available on the medRxiv* server.
The study
The algorithm utilized in this study was applied to every country for which data was available in the context of COVID-19. By applying the algorithm to both the cases and deaths time series, the authors could employ cross-validation to account for the confounding effect of shifting case ascertainment and improve the identification of case waves.
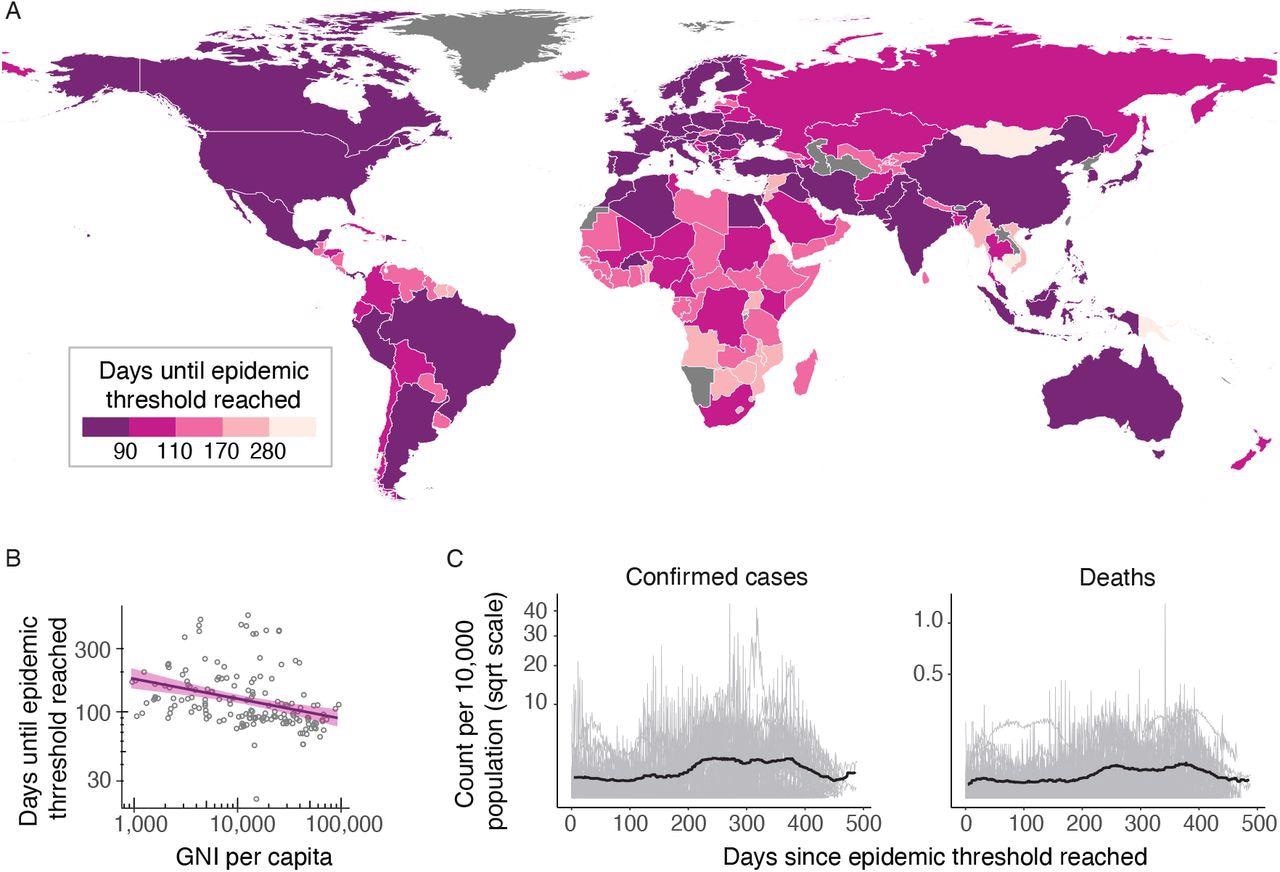
(A) Choropleth shows the number of days since the emergence of the first cases in China on the 31st of December, 2019, until the cumulative number of deaths in each country surpassed 10. Countries with darker colors passed the threshold earlier than the lighter colored countries. After starting in China, epidemics occurred in Europe, the Middle East and North America before moving south to South America, Africa and the Pacific. (B) Scatter plot showing the correlation between the days until the epidemic threshold was reached in each country against the GNI per capita for that country showing a negative trend, i.e., the pandemic spread to higher GNI per capita countries first. Linear regression line in purple with a shaded 95% confidence interval (C) Time series of the daily number of confirmed cases (left) and deaths (right) per 10,000 population among the countries that have evidence of a second wave (light grey), and the 7-day rolling median of the mean across countries (black line). For each country, the time is taken relative to the date at which the epidemic became established.
 *Important notice: medRxiv publishes preliminary scientific reports that are not peer-reviewed and, therefore, should not be regarded as conclusive, guide clinical practice/health-related behavior, or treated as established information.
Only two identified trends are statistically significant at the 5% level. First, a greater number of waves are connected with a longer response time to stringency (a one-tailed Mann-Whitney test suggests that nations with more than one wave responded considerably slower than countries with only one wave, p = 0.0002) and a higher gross national income (GNI) (p 0.0001). The relationship between population density and mortality is not statistically significant.
The descriptions of the discovered waves are predicated on the idea that time series of fatalities is a more reliable and consistent indicator of viral activity patterns than just a time series of cases. Transmission and testing are the two primary drivers of waves in case incidence time series.
An increase in transmission can trigger a wave, an increase in testing, or a combination of the two, if the testing regime changes during a transmission wave.
As a result, it is frequently impossible to compare case incidence statistics from two following waves. However, at the very least, the presence or absence of an accompanying mortality incidence peak can be used to infer the relative difference in drivers. Additionally, the authors identify a third sort of wave on a national scale (spatially asynchronous waves). Countries that exhibit this wave typology may benefit from isolating local epidemic curves and developing local intervention measures.
In Italy, two distinct waves of confirmed cases and two distinct waves of mortality occur at nearly identical times. However, the ratio of cases to fatalities around each peak varies significantly between the first and second waves, implying a declining case fatality ratio (CFR) trend that requires close examination.
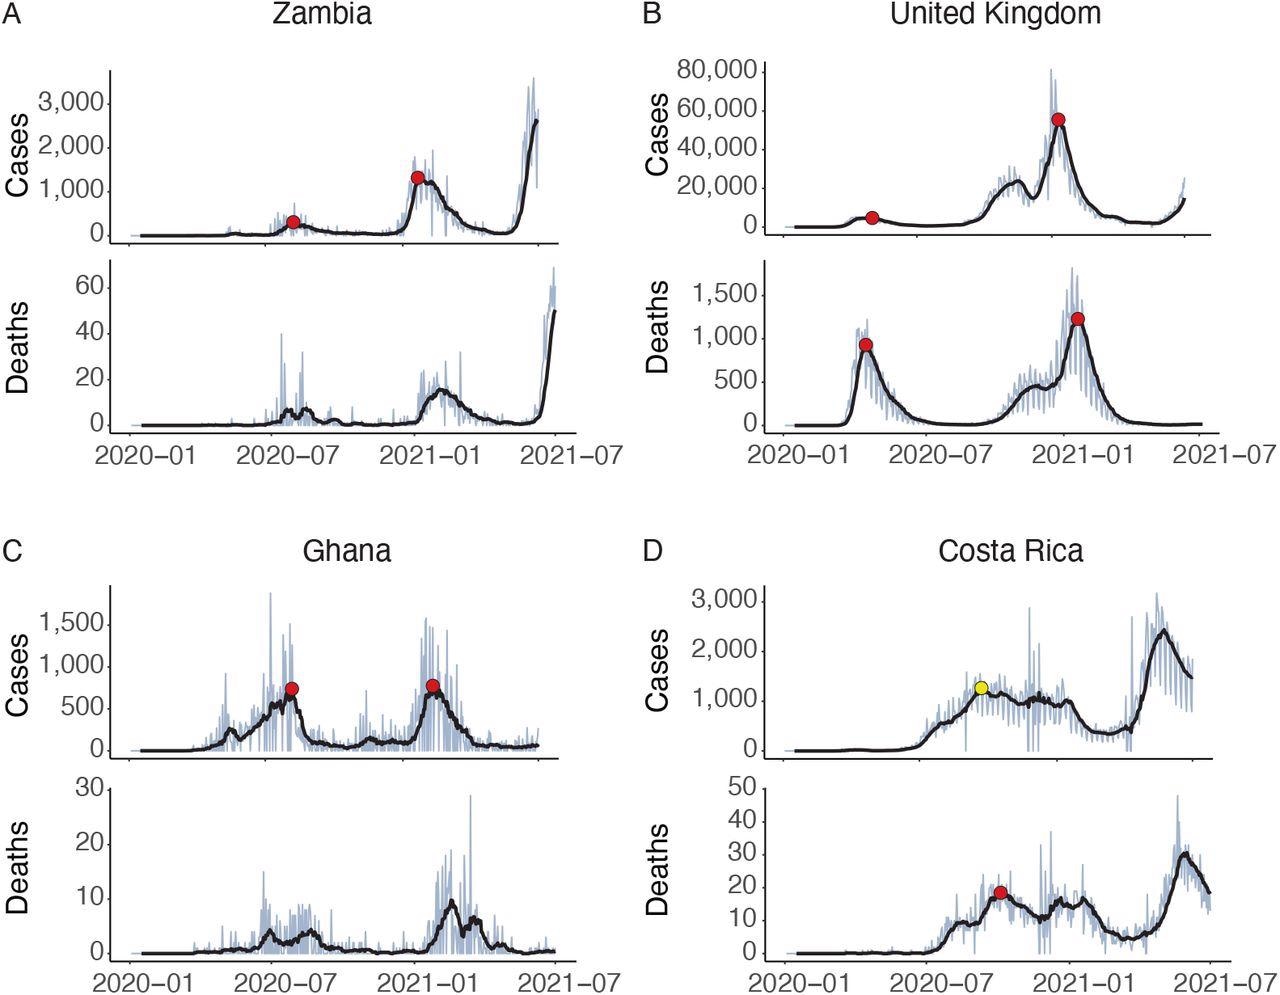
Identification of epidemic waves of COVID-19. A: Zambia shows a clear structure with two waves (red circles) in the cases data, while no waves are identified in the deaths data. B: the UK shows a structure that might arguably have two or three waves, but sub-algorithm D combines the final two. C: In Ghana sub-algorithm B filters out an early spike in cases. It is not clear visually whether this is noise or a meaningful epidemiological event; the algorithm cannot do better than the reader in determining this from simply inspecting a graph. No waves in deaths are identified due to low absolute counts. D: The number of cases in Costa Rica does not fall by 70% after the first wave, so it is not identified by the algorithm as a wave. This shows how important the parameter Prel can be. However, cross-validating against the time series of deaths allows the wave to be identified (yellow circle)
In the United States, three waves of cases and deaths are visually perceived, with the algorithm integrating the first two waveforms into a single wave. Once again, there is a notable disparity between the number of cases and deaths. In this instance, the investigators noticed regional diversity between the waves, with the outbreak concentrating in different places at different periods. This is an illustration of spatially asynchronous waves in action.
Implications
It is feasible to convert the intuitive visual perception of time series 'waves' into simple mathematical procedures that may annotate many time series by objectively identifying their component waves. These waves may occur due to increased transmission, increased testing, or a combination of the two in the context of COVID-19. Additionally, waves can form as a result of the aggregation of time series from a vast geographical area, such that the second wave is actually the first, but for a different portion of the country. When conducting comparative analyses of the links between interventions and disease-related mortality, employing the wave as the temporal unit for analysis can result in more precise conclusions. The rate at which interventions are applied is substantially connected with the succeeding epidemic's wave structure.
*Important notice: medRxiv publishes preliminary scientific reports that are not peer-reviewed and, therefore, should not be regarded as conclusive, guide clinical practice/health-related behavior, or treated as established information.
 Researchers use AI to reveal the true scale of COVID-19 mortality in the US