Severe acute respiratory syndrome coronavirus 2 (SARS‑CoV‑2) infection is usually diagnosed via reverse transcription PCR or RT-PCR, but this method is far from perfect. According to one review, RT-PCR has a real-world sensitivity of about 70% and a specificity of 95%, although negative results do not necessarily indicate a negative diagnosis.
Additionally, a systematic analysis of individual patient data found that RT-PCR frequently misses SARS‑CoV‑2 and that early sampling may reduce false negatives. Consequently, these tests are often more helpful in ruling in COVID-19 than in ruling it out.
In cases where an RT-PCR test is negative, but a patient presents with symptoms of COVID-19, additional tests may be necessary.
Given the exponential rise in the number of COVID-19 cases worldwide and the mounting strain on medical resources, automated diagnostic methods may effectively reduce the burden on reporting radiologists.
CT (computed tomography) images are made up of many slices, creating a three-dimensional (3D) effect. A fundamental limitation of previously reported measures using CT-scan image-based methods is the need for the same number of slices as their inputs which is not viable in different CT volumes.
Three common limitations of such models are a lack of adequately documented methods for reproducibility, failure to follow standard regulatory protocols for developing deep learning models, and an absence of external validation studies to validate the program in the real-world population.
Researchers have aimed to address the issues mentioned above in a recent study posted to the medRxiv* preprint server.
Using best practice guidelines, they developed a mixed-effects deep learning model to classify images as healthy or COVID-19 accurately. In addition, a secondary aim was to demonstrate how deep learning algorithms could satisfy current best practice guidelines for creating reproducible and less biased models.
Study details
The proposed mixed-effects model was developed using data from Russia and China retrospectively. Data in Russia were collected between March 1, 2020, and April 25, 2020. The China Consortium of Chest CT Image Investigation (CC-CCII) provided data between January 25, 2020, and March 27, 2020. The study involved data from 1,110 and 796 patients with either COVID-19 or healthy CT volumes from Russia and China, respectively.
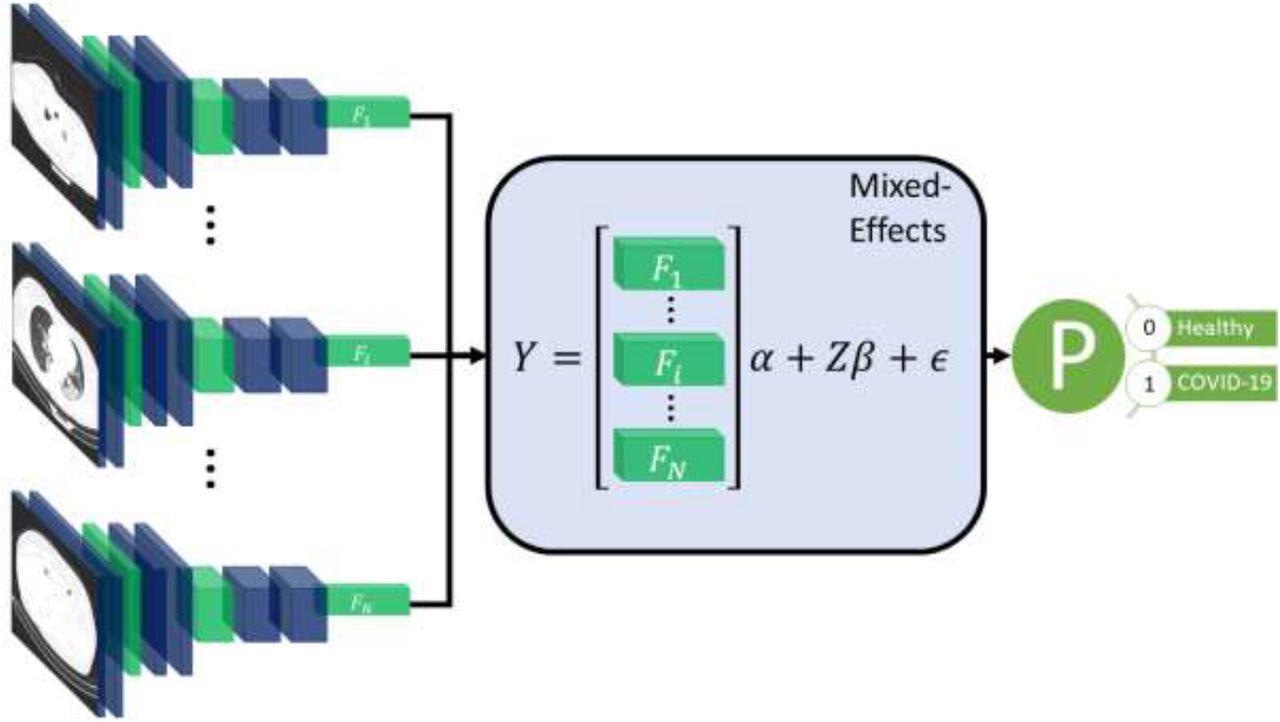
Diagram of the overall framework. Twenty slices are chosen from a CT volume. Each slice is fed into a CNN with shared weights, which outputs a feature vector of length 2048 for each image. The feature vectors form a 20-by-2048 fixed effects matrix, X, for the GMM model with a random-effects matrix, Z, consisting of an identity matrix. A mixed-effects model is used to model the relationship between slices. Finally, a fully connected layer and sigmoid activation return a probability of the diagnosis.
 *Important notice: medRxiv publishes preliminary scientific reports that are not peer-reviewed and, therefore, should not be regarded as conclusive, guide clinical practice/health-related behavior, or treated as established information.
The proposed method used a feature extractor and a two-stage generalized linear mixed-effects model (GLMM), using back-propagation. Mixed-effects models are statistical models consisting of a fixed-effects part and a random-effects part. The fixed-effects part is used to model the relationship within the CT slice, and the random-effects part then models the spatial correlation between CT slices within the same image.
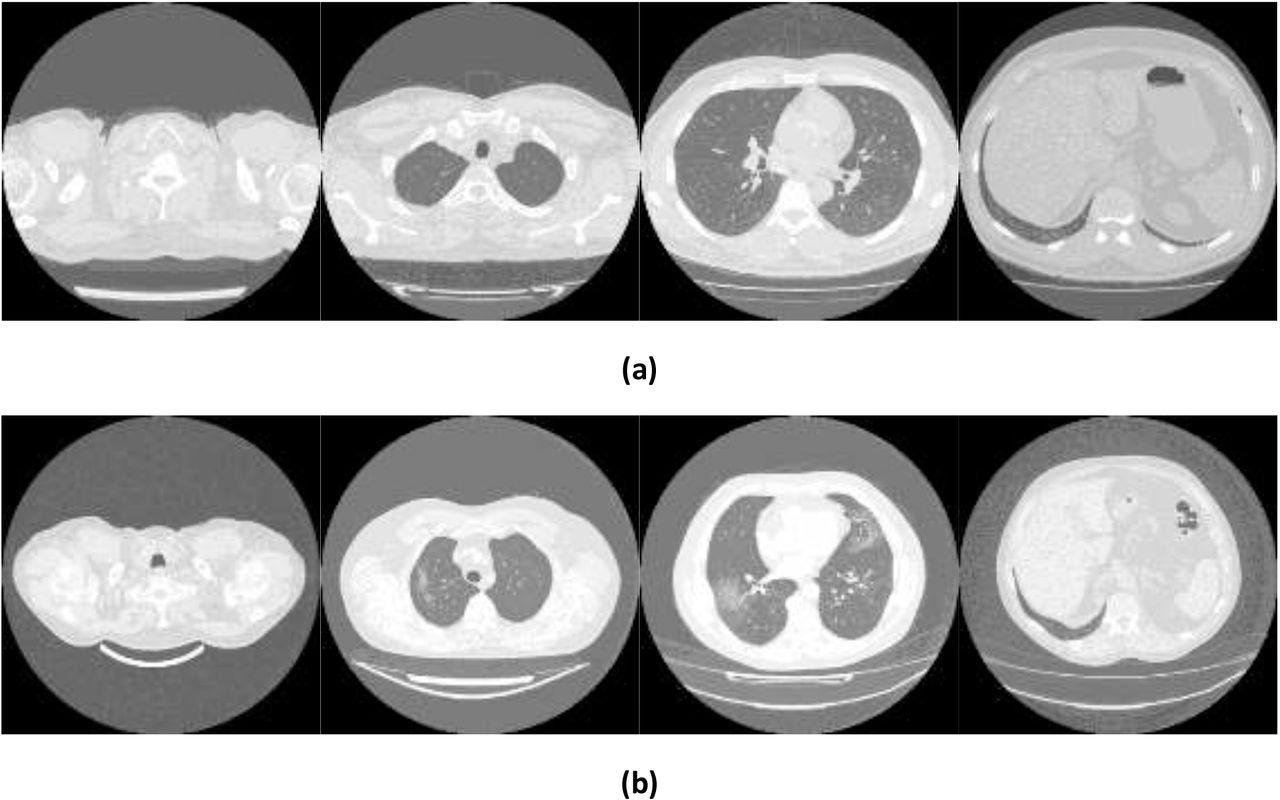
Example images showing (a) healthy and (b) COVID-19 lungs taken from the Mosmed dataset.
First, a series of CT slices forming a CT volume was fed to the model. This step was followed by a mixed-effects layer that concatenates the feature vectors into a single vector. Finally, a fully connected layer followed by a sigmoid activation gave a probability of COVID-19 for the whole volume. The mixed effects and fully connected layer with sigmoid activation were analogous to a linear GLMM in traditional statistics.
For the feature extractor, the researchers used InceptionV3, a Convoluted Neural Network (CNN). After selecting the neural network, researchers used a global average pooling layer to reduce each image to a feature vector for each slice, with a dropout of 0.6 to improve generalizability to unseen images. The feature vectors were then transformed into a 20 × 2048 matrix. The novelty of this process lay in researchers using a mixed-effects layer previously only used in hardcore statistical calculations to model the relationship between slices.
Researchers used an internal validation dataset to train the proposed model. The model showed an AUROC (area under receiver operating curve) of 0.936 (95%CI: 0.910, 0.961). Using an optimal cut-off point of 0.740, the sensitivity, specificity, Negative Predictive Value (NPV), and Positive Predictive Value (PPV) were 0.807 (0.761, 0.853), 0.953 (0.908, 0.853), 0.983 (0.966, 1.0), and 0.596 (0.513, 0.678), respectively.
On validating the model externally, it attained an AUROC of 0.930 (0.914, 0.947). Using an optimal cut-off point of 0.878, the sensitivity, specificity, NPV, and PPV were 0.758 (0.722, 0.793), 0.963 (0.939, 0.987), 0.979 (0.965, 0.993), and 0.636 (0.587, 0.685), respectively.
When 20% of the CT-scan images were missing in the validation dataset, there was a statistically significant reduction in the model’s predictive performance. Although, even at 50% data-missingness, the model continued to perform relatively well, with an AUROC of 0.890 (95% CI: 0.868, 0.912), highlighting its robustness.
Implication
This study is another indicator of leveraging the power of deep learning for screening and monitoring COVID-19 in a clinical setting. However, validation in the intended setting is vital, and models should not be adopted without this. This study also highlighted the importance of external validation in developing a robust model for disease prediction.
*Important notice: medRxiv publishes preliminary scientific reports that are not peer-reviewed and, therefore, should not be regarded as conclusive, guide clinical practice/health-related behavior, or treated as established information.
 Study links COVID-19 to higher sleep apnea risk years after infection