Various studies have attempted to identify host species susceptible to SARS-CoV-2 viral entry based on variations in the ACE2 receptor. However, the predictive accuracy of these studies is still unknown.
 Study: Variation in the ACE2 receptor has limited utility for SARS-CoV-2 host prediction. Image Credit: NIAID
 This news article was a review of a preliminary scientific report that had not undergone peer-review at the time of publication. Since its initial publication, the scientific report has now been peer reviewed and accepted for publication in a Scientific Journal. Links to the preliminary and peer-reviewed reports are available in the Sources section at the bottom of this article. View Sources
About the study
In the present study, researchers assessed the relative predictive power of ACE2 representations based on their sequence and structure binding to explore the accuracy of these predictive models.
The team obtained records of interactions described between mammalian and avian hosts and sarbecoviruses. Separate records were maintained for animals that shed viruses through infection with other animals or through viral isolation. The utilization of in vitro data when in vivo data or natural infection-related data was absent was assessed by obtaining evidence of compatibility. This was achieved by either performing direct inoculation of the cell cultures belonging to each species or inoculation of cells that expressed heterologous ACE2. The team also included records from any SARS-CoV strain, such as SARS-CoV-2.
The range of susceptibility of animal groups to different sarbecoviruses was assessed by quantifying the distribution of susceptible and non-susceptible species across a general time-scaled phylogeny which was based on the known patterns of evolutionary distinctions among hosts.
Furthermore, the team calibrated a series of machine learning models using measurements that took into account the breadth of ACE-2-embedded information that is currently known. The researchers also explored whether representing information related to individual positions of ACE2 amino acids was more accurate than the representations presently used. The individual positions were defined by either the amino acids observed (AA categorical), the physicochemical characteristics of the observed amino acids (AA properties), or the distance to the most commonly found amino acid in susceptible species (AA consensus distance).
![Phylogenetic clustering of sarbecovirus host susceptibility and shedding data. (A) Species for which susceptibility to infection and shedding of infectious virus have been assessed. Colours indicate the best available evidence, while symbols show the viruses involved. Blank rows in the shedding panel indicate missing data. A composite phylogeny derived from TimeTree indicates evolutionary relationships and median estimated divergence times. (B) Measurements of phylogenetic clustering when considering increasingly relaxed evidence quality thresholds, based on the phylogeny in (A). Outlined circles show likelihood ratio p-values ≤ 0.003, indicating greater clustering of infection records than expected by chance, while the cross indicates a p-value of 0.186. (C–D) Pairwise cophenetic distances between each host and its closest infected (C) or non-infected (D) neighbour. (E–F) Total Grantham distance between the ACE2 sequence of each host and its closest infected (E) or non-infected (F) neighbour. P-values from a Wilcoxon rank sum test are indicated in (C-F), and overlapping values from different hosts are jittered horizontally. Note that while both p-values and boxplots are based on a single value for each host, overlapping symbols at the same position are used to indicate different viruses (for example, a species known to be susceptible to both SARS-CoV [▴] and SARS-CoV-2 [▾] would be indicated using a star formed of overlapping triangles).](https://www.news-medical.net/images/news/ImageForNews_714341_1653010004697550.jpg)
Phylogenetic clustering of sarbecovirus host susceptibility and shedding data. (A) Species for which susceptibility to infection and shedding of the infectious virus have been assessed. Colors indicate the best available evidence, while symbols show the viruses involved. Blank rows in the shedding panel indicate missing data. A composite phylogeny derived from TimeTree indicates evolutionary relationships and median estimated divergence times. (B) Measurements of phylogenetic clustering when considering increasingly relaxed evidence quality thresholds, based on the phylogeny in (A). Outlined circles show likelihood ratio p-values ≤ 0.003, indicating greater clustering of infection records than expected by chance, while the cross indicates a p-value of 0.186. (C–D) Pairwise cophenetic distances between each host and its closest infected (C) or non-infected (D) neighbor. (E–F) Total Grantham distance between the ACE2 sequence of each host and its closest infected (E) or non-infected (F) neighbor. P-values from a Wilcoxon rank-sum test are indicated in (C-F), and overlapping values from different hosts are jittered horizontally. Note that while both p-values and boxplots are based on a single value for each host, overlapping symbols at the same position are used to indicate different viruses (for example, a species known to be susceptible to both SARS-CoV [▴] and SARS-CoV-2 [▾] would be indicated using a star formed of overlapping triangles).
Results
The study dataset comprised reports that included a total of 25 natural infections reporting the outcomes of 28 captive animals after experimental inoculation. In these reports, the detection of viral ribonucleic acid (RNA) or viral isolation from either nasal or rectal swab samples or feces was deemed evidence of susceptibility. Almost 88% of the most susceptible species found by the team were linked to a minimum of one sarbecovirus that used the ACE2 receptor, which included records of SARS-CoV-2 infections.
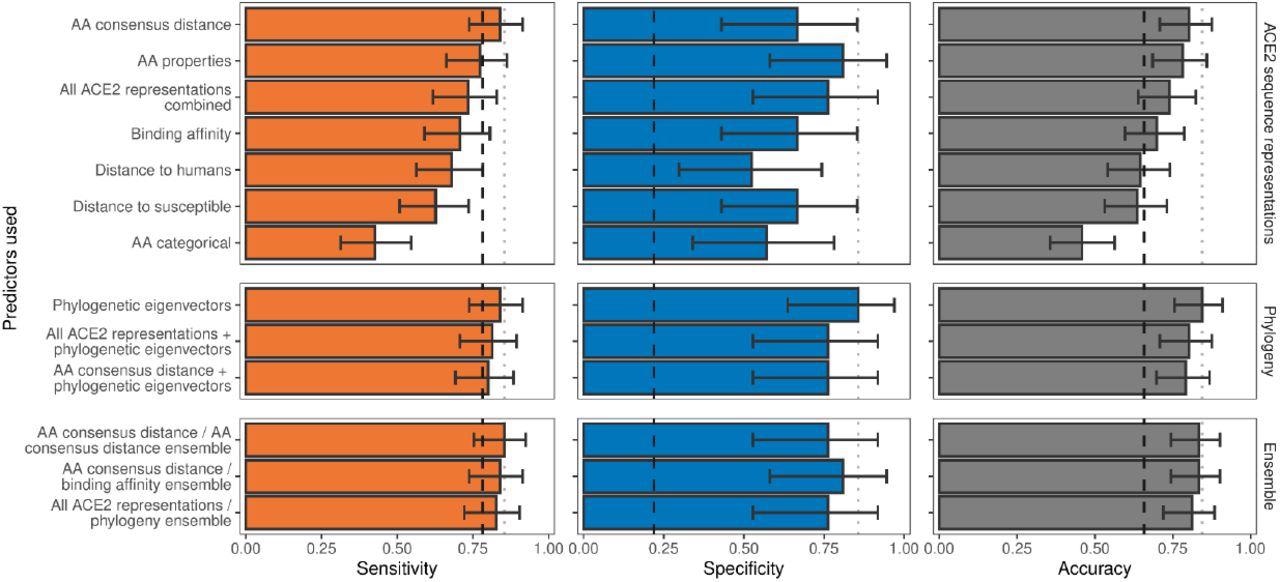
Ability of models trained on different representations of either ACE2 sequences or a time-scaled amniote phylogeny to predict host susceptibility to sarbecovirus infection. Bars represent proportions from leave-one-out cross-validation, with error bars indicating binomial confidence intervals. Dashed vertical lines indicate the performance expected from a null model which randomly assigns susceptibility in proportion to its frequency in the training data (78.12% of available hosts are considered susceptible, N = 96). Dotted vertical lines highlight performance of the best model in each panel.
The team noted that the susceptibility of sarbecoviruses was highly conserved within the tested host phylogenies. Moreover, clustering was significantly strong among the non-susceptible species, which clustered noticeably closer to other non-susceptible host species than the other known susceptible species when both ACE2 amino acid distances and divergence dates were taken into account. Furthermore, a phylogeny based only on the ortholog sequences of ACE2 showed similar topology and branch lengths to the time-scaled phylogeny. Overall, this showed that ACE2 variation was comparable to evolutionary relationships between host species.
The researchers found that none of the ACE2 representations displayed more accuracy than a null model, which randomly assigned the tested species as either susceptible or non-susceptible as compared to the frequency of susceptible species in the dataset. However, sensitivity varied significantly among representations and performed better than the null model, which indicated that ACE2 could accurately differentiate between non-susceptible species.
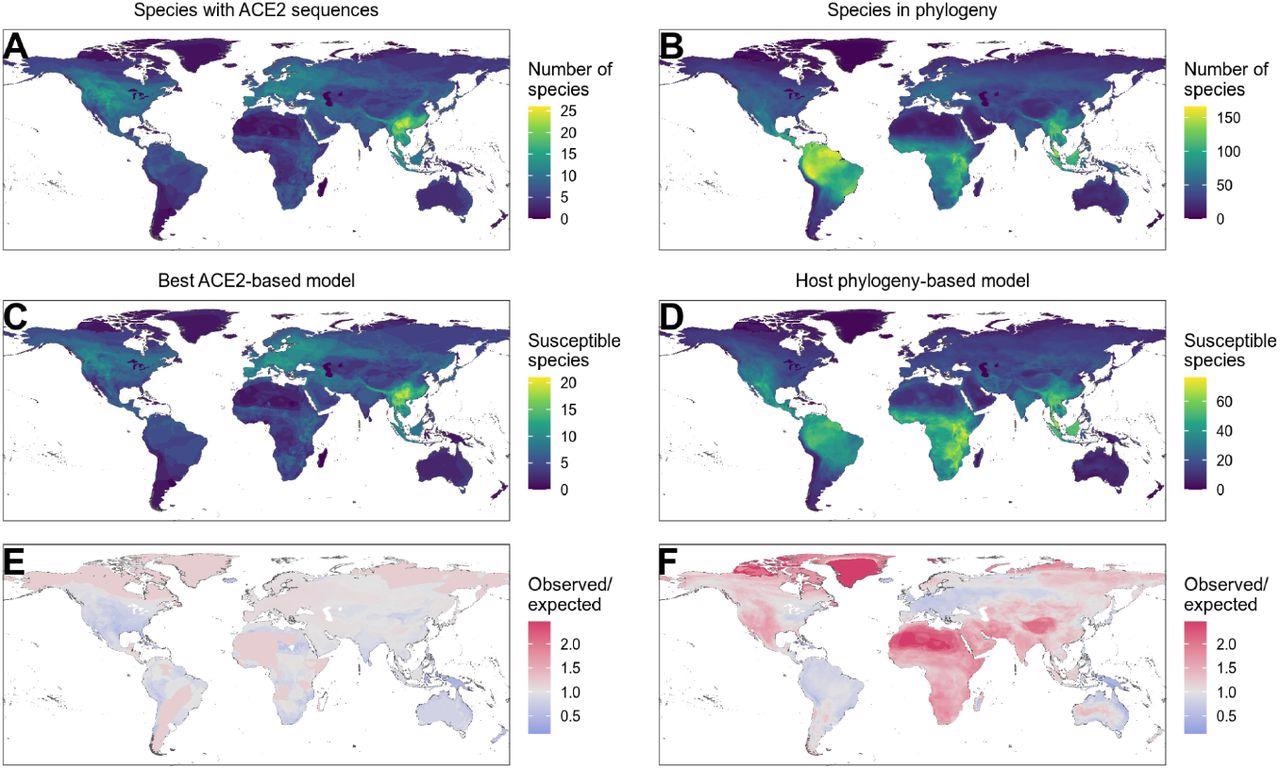
Distribution of wild terrestrial mammals predicted as susceptible depends on input data and model choice. (A – B) Number of species available for prediction by (A) ACE2-based models (limited by ACE2 availability), and (B) phylogeny-based models (nearly all mammals, in this figure limited primarily by the availability of IUCN range data). (C – D) Number of species predicted to be susceptible by (C) the best ACE2-based model (AA consensus distance / AA consensus distance ensemble), and (D) the host phylogeny-only model (phylogenetic eigenvectors). (E – F) Observed over expected ratio comparing the proportion of species in each location predicted as susceptible to the baseline expectation in which the overall proportion of mammal species predicted as susceptible by the relevant model is distributed homogeneously. Values below one indicate a lower proportion than expected, while values above one indicate a higher proportion than expected (i. e. putative hotspots of susceptibility). (E) Predictions from the best ACE2-based model; (F) predictions from the phylogeny-only model.
The best-performing model was the AA consensus model, which accurately determined the non-susceptibility or susceptibility of 77 out of 96 species. The team also found that encoding the distances of the ACE amino acid as compared to the closest susceptible species resulted in more accurate predictions than those by distance to human ACE2 models when specificity was taken into account. Overall, all ACE2 representations had an insignificant impact on the performance of the model, which suggested that differences in specific ACE2 amino acids from the common susceptible consensus were crucial in predicting susceptibility or non-susceptibility.
Conclusion
The study findings showed that the high congruence observed between the overall phylogenies of host species and ACE2 highlighted the likelihood that accurate sarbecovirus host prediction could be subject to ACE2 variation with other evolutionarily conserved characteristics of the host that determine susceptibility. The researchers believe that this correlation can generate more models that could be applied across different species. Such models would play a crucial role in reversing the risk of zoological viruses by defining novel SARS-CoV-2 reservoirs to curb any future pandemics.
This news article was a review of a preliminary scientific report that had not undergone peer-review at the time of publication. Since its initial publication, the scientific report has now been peer reviewed and accepted for publication in a Scientific Journal. Links to the preliminary and peer-reviewed reports are available in the Sources section at the bottom of this article. View Sources
Journal references:
- Preliminary scientific report.
Variation in the ACE2 receptor has limited utility for SARS-CoV-2 host prediction, Nardus Mollentze, Deborah Keen, Uuriintuya Munkhbayar, Roman Biek, Daniel G. Streicker, bioRxiv 2022.05.16.492068, DOI: https://doi.org/10.1101/2022.05.16.492068, https://www.biorxiv.org/content/10.1101/2022.05.16.492068v1
- Peer reviewed and published scientific report.
Mollentze, Nardus, Deborah Keen, Uuriintuya Munkhbayar, Roman Biek, and Daniel G Streicker. 2022. “Variation in the ACE2 Receptor Has Limited Utility for SARS-CoV-2 Host Prediction.” Edited by Sarah E Cobey, Miles P Davenport, and Tyler Starr. ELife 11 (November): e80329. https://doi.org/10.7554/eLife.80329. https://elifesciences.org/articles/80329.
 Genetic mapping in wastewater sets a new standard for pathogen surveillance