The SARS-CoV-2 pandemic mitigation measures rely on updatable estimations of CoV disease 2019 (COVID-19) trajectories, progression, and onset.
In the present study, the authors explored PubMed for papers using the search terms SARS-CoV-2 or COVID-19, electronic health records or EHR, and severity, with no language constraints, from the database inception to 14 October 2021. They found that several investigations have assessed the elements that influence the severity of SARS-CoV-2 infection and predicted the outcomes for hospitalized COVID-19 patients.
Nevertheless, most studies have concentrated on isolated aspects of the healthcare system, such as only primary/secondary care, have been conducted in subpopulations, for example, patients admitted to hospital, have had small sample sizes, and have frequently used dichotomized outcomes such as hospital admission or mortality that are not reflective of the entire spectrum of illness. Furthermore, the team discovered no investigations that thoroughly evaluated the SARS-CoV-2 infection severity throughout pandemic waves and by patient trajectories and vaccination status.
About the study
In the current cohort study, the scientists used an expandable framework to describe and validate 10 SARS-CoV-2 infection characteristics from nationwide connected EHRs to recognize and characterize COVID-19 trajectories. They leveraged eight interlinked National Health Service (NHS) data sources for individuals alive on 23 January 2020 in England.
These databases linked data on COVID-19 laboratory screening, primary care, hospitalization (intensive care unit (ICU) admission and ventilatory support), and registered mortalities. Information on SARS-CoV-2 vaccination, testing, primary/secondary care data, and death registrations was gathered until 30 November 2021.
The team described 10 COVID-19 phenotypes that indicate clinically significant phases of disease severity and fall into five categories: SARS-CoV-2-positive test, hospitalization, primary care diagnosis, ventilation strategy consisting of four phenotypes, and mortality comprising three phenotypes. They created patient trajectories that showed the duration and frequency of transitions between phenotypes. COVID-19 vaccination status and pandemic waves were used to stratify the analyses.
Of note, the researchers aimed to create an updatable framework that can rebuild the COVID-19 trajectories of an individual across diverse severity states, providing crucial insight regarding the effectiveness of booster vaccine doses, novel viral variants effect, post-exposure prophylaxis, and emerging treatment options utilizing data linkage.
Findings
The study results illustrated that in the current cohort of 57,032,174 people, 13,990,423 COVID-19 incidences were found in 7,244,925 people, resulting in a SARS-CoV-2 infection rate of 12.7% across the research period. Among 7,244,925 subjects, 460,737 people, i.e., 64%, were hospitalized, and 158,020 people, i.e., 2·2%, died. Of the 460,737 hospitalized individuals, 48,847, i.e., 10·6%, required the ICU admission, 69,090, i.e., 15%, were given non-invasive ventilation, and 25,928, i.e., 5·6%, given invasive ventilation.
Mortality was higher in the initial COVID-19 wave with 23,485, i.e., 30.4%, of 77,202 SARS-CoV-2 patients than in the second pandemic wave with 44,220 (23.1%) of 191,528 virus-infected persons across 384,135 patients hospitalized but not requiring ventilation. ICU-admitted patients, on the other hand, had no difference in mortality.
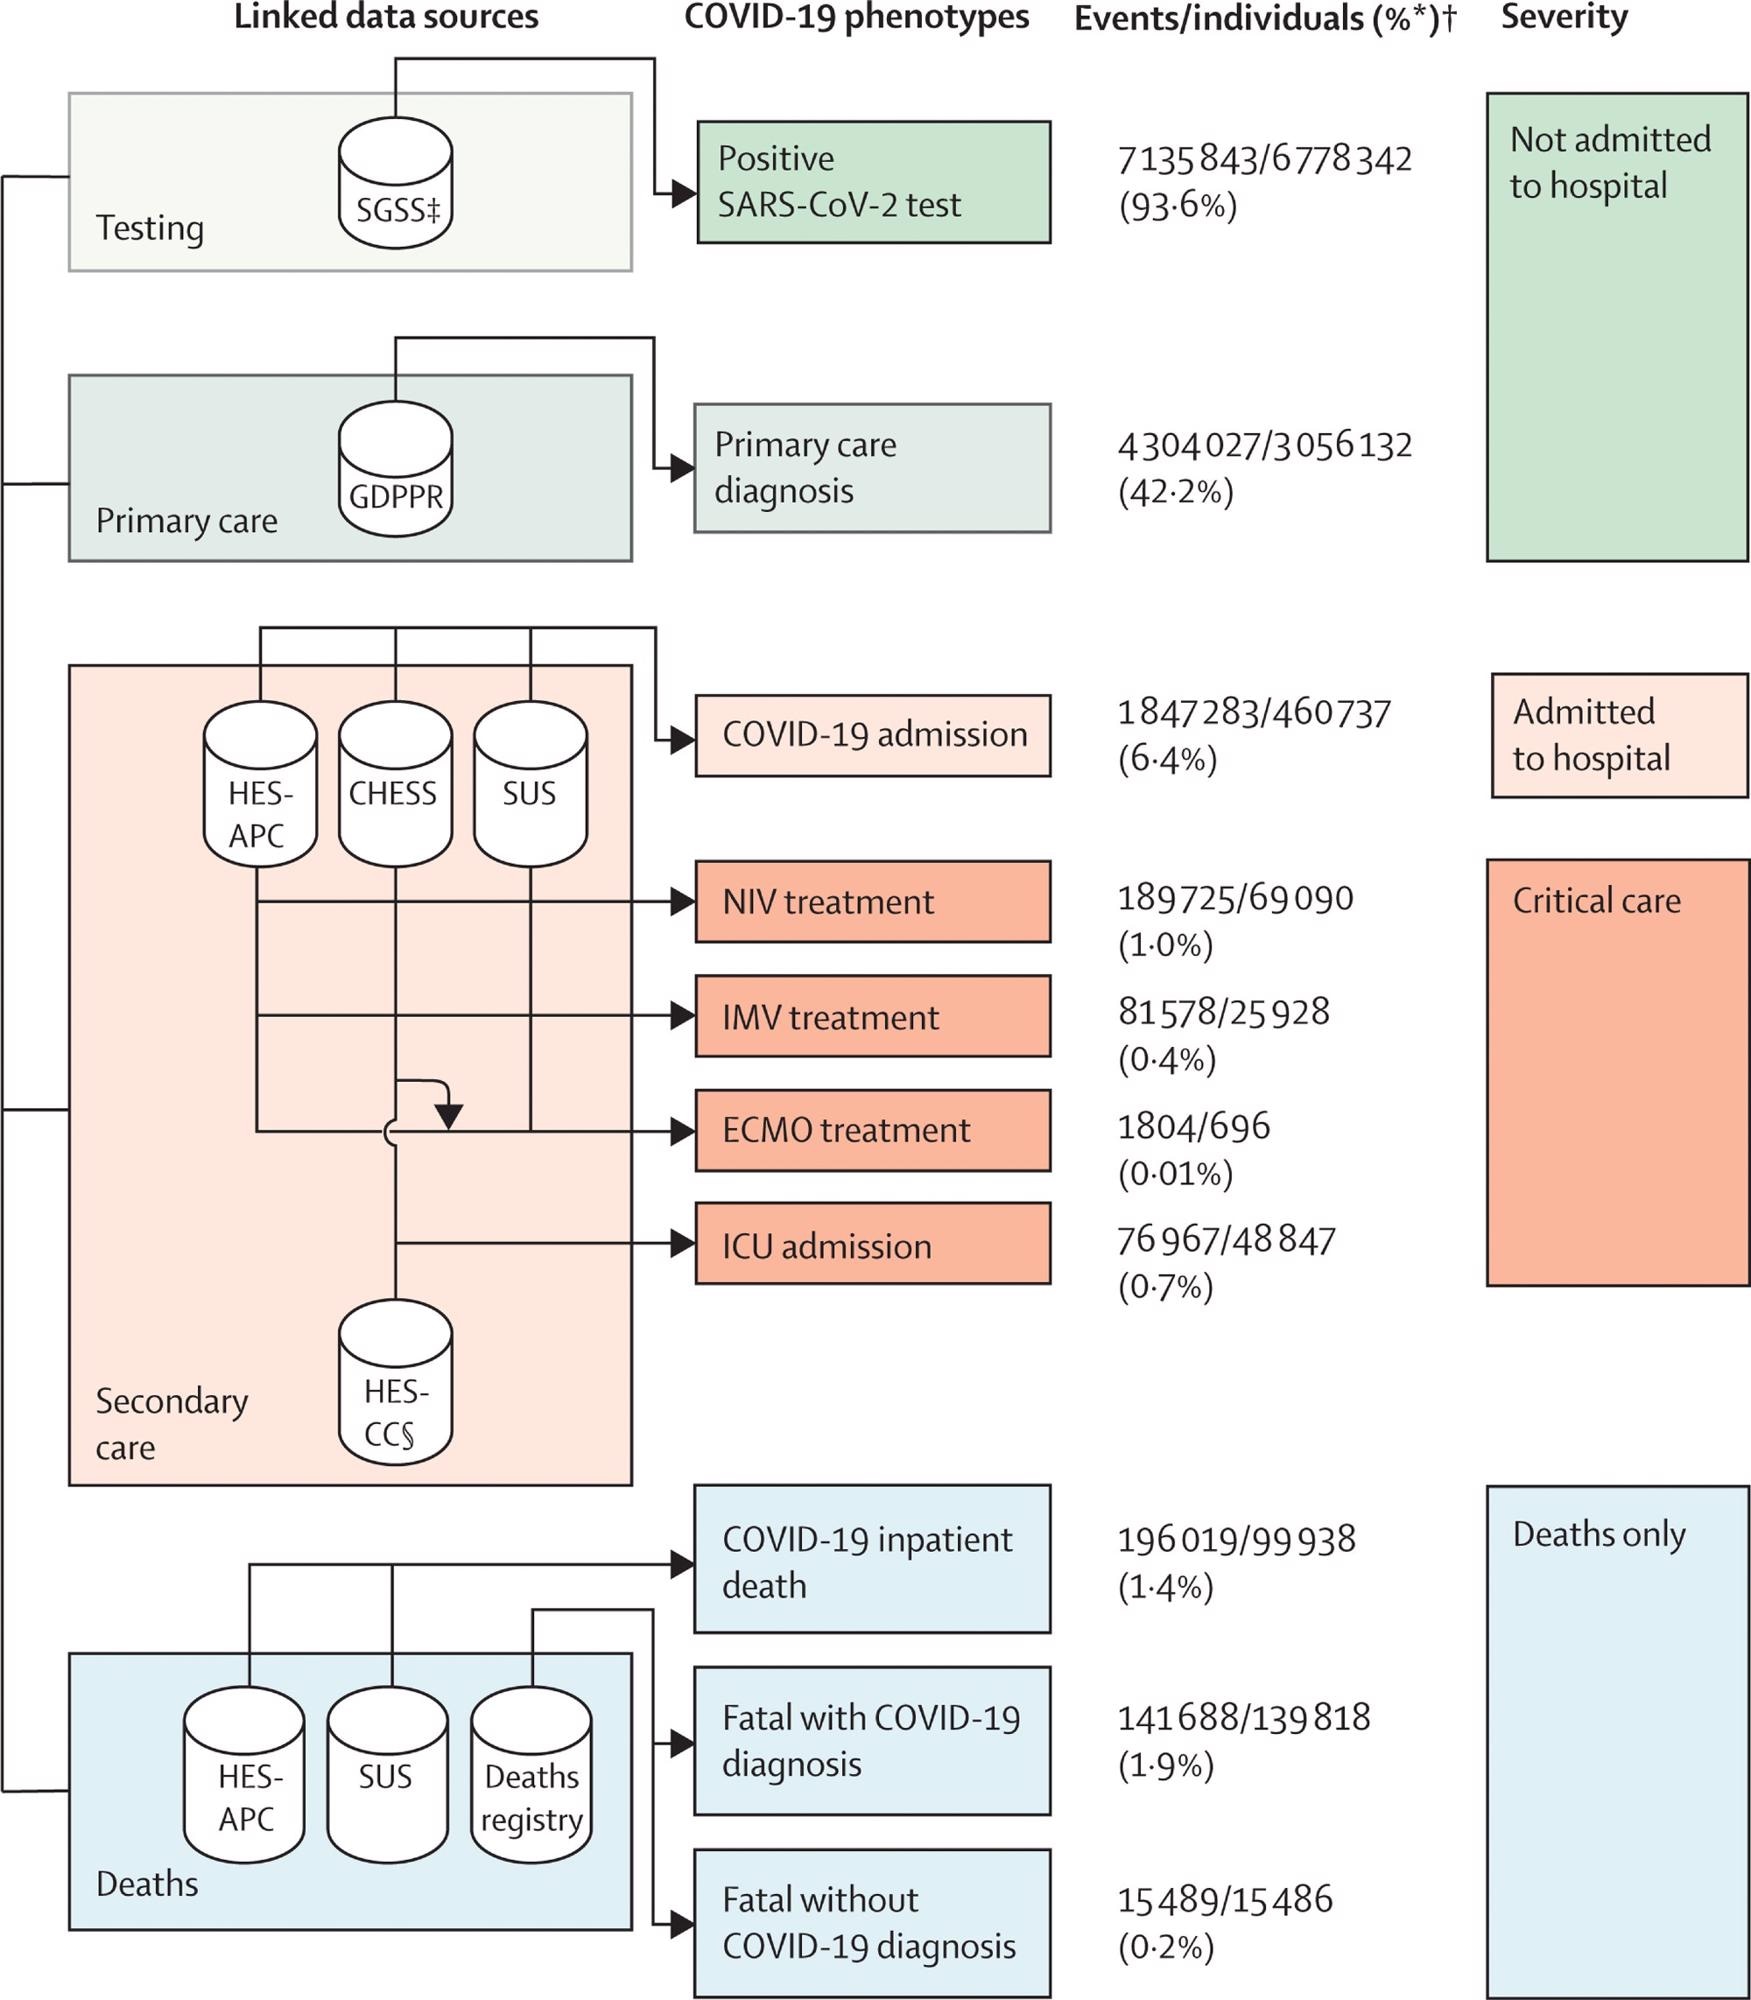 Framework describing the ten COVID-19 phenotypes, and severity categories, produced using seven linked data sources to evaluate difference between COVID-19 waves and vaccination status
In the first pandemic wave, the COVID-19 patients who required ventilatory support outside the ICU had the highest mortality rate, with 2569 or 50·7% of 5063 patients dying. Further, 15,486, i.e., 9·8% of 158,020 COVID-19-linked mortalities happened within 28 days of the initial COVID-19 event without a diagnosis of SARS-CoV-2 infection on the death certificate. Additionally, 10,884, i.e., 6·9%, of 158,020 mortalities were recognized from death data, with no preceding COVID-19 phenotypic information. The authors noted that the second wave of the COVID-19 pandemic had lengthier trajectories of patients than the first wave.
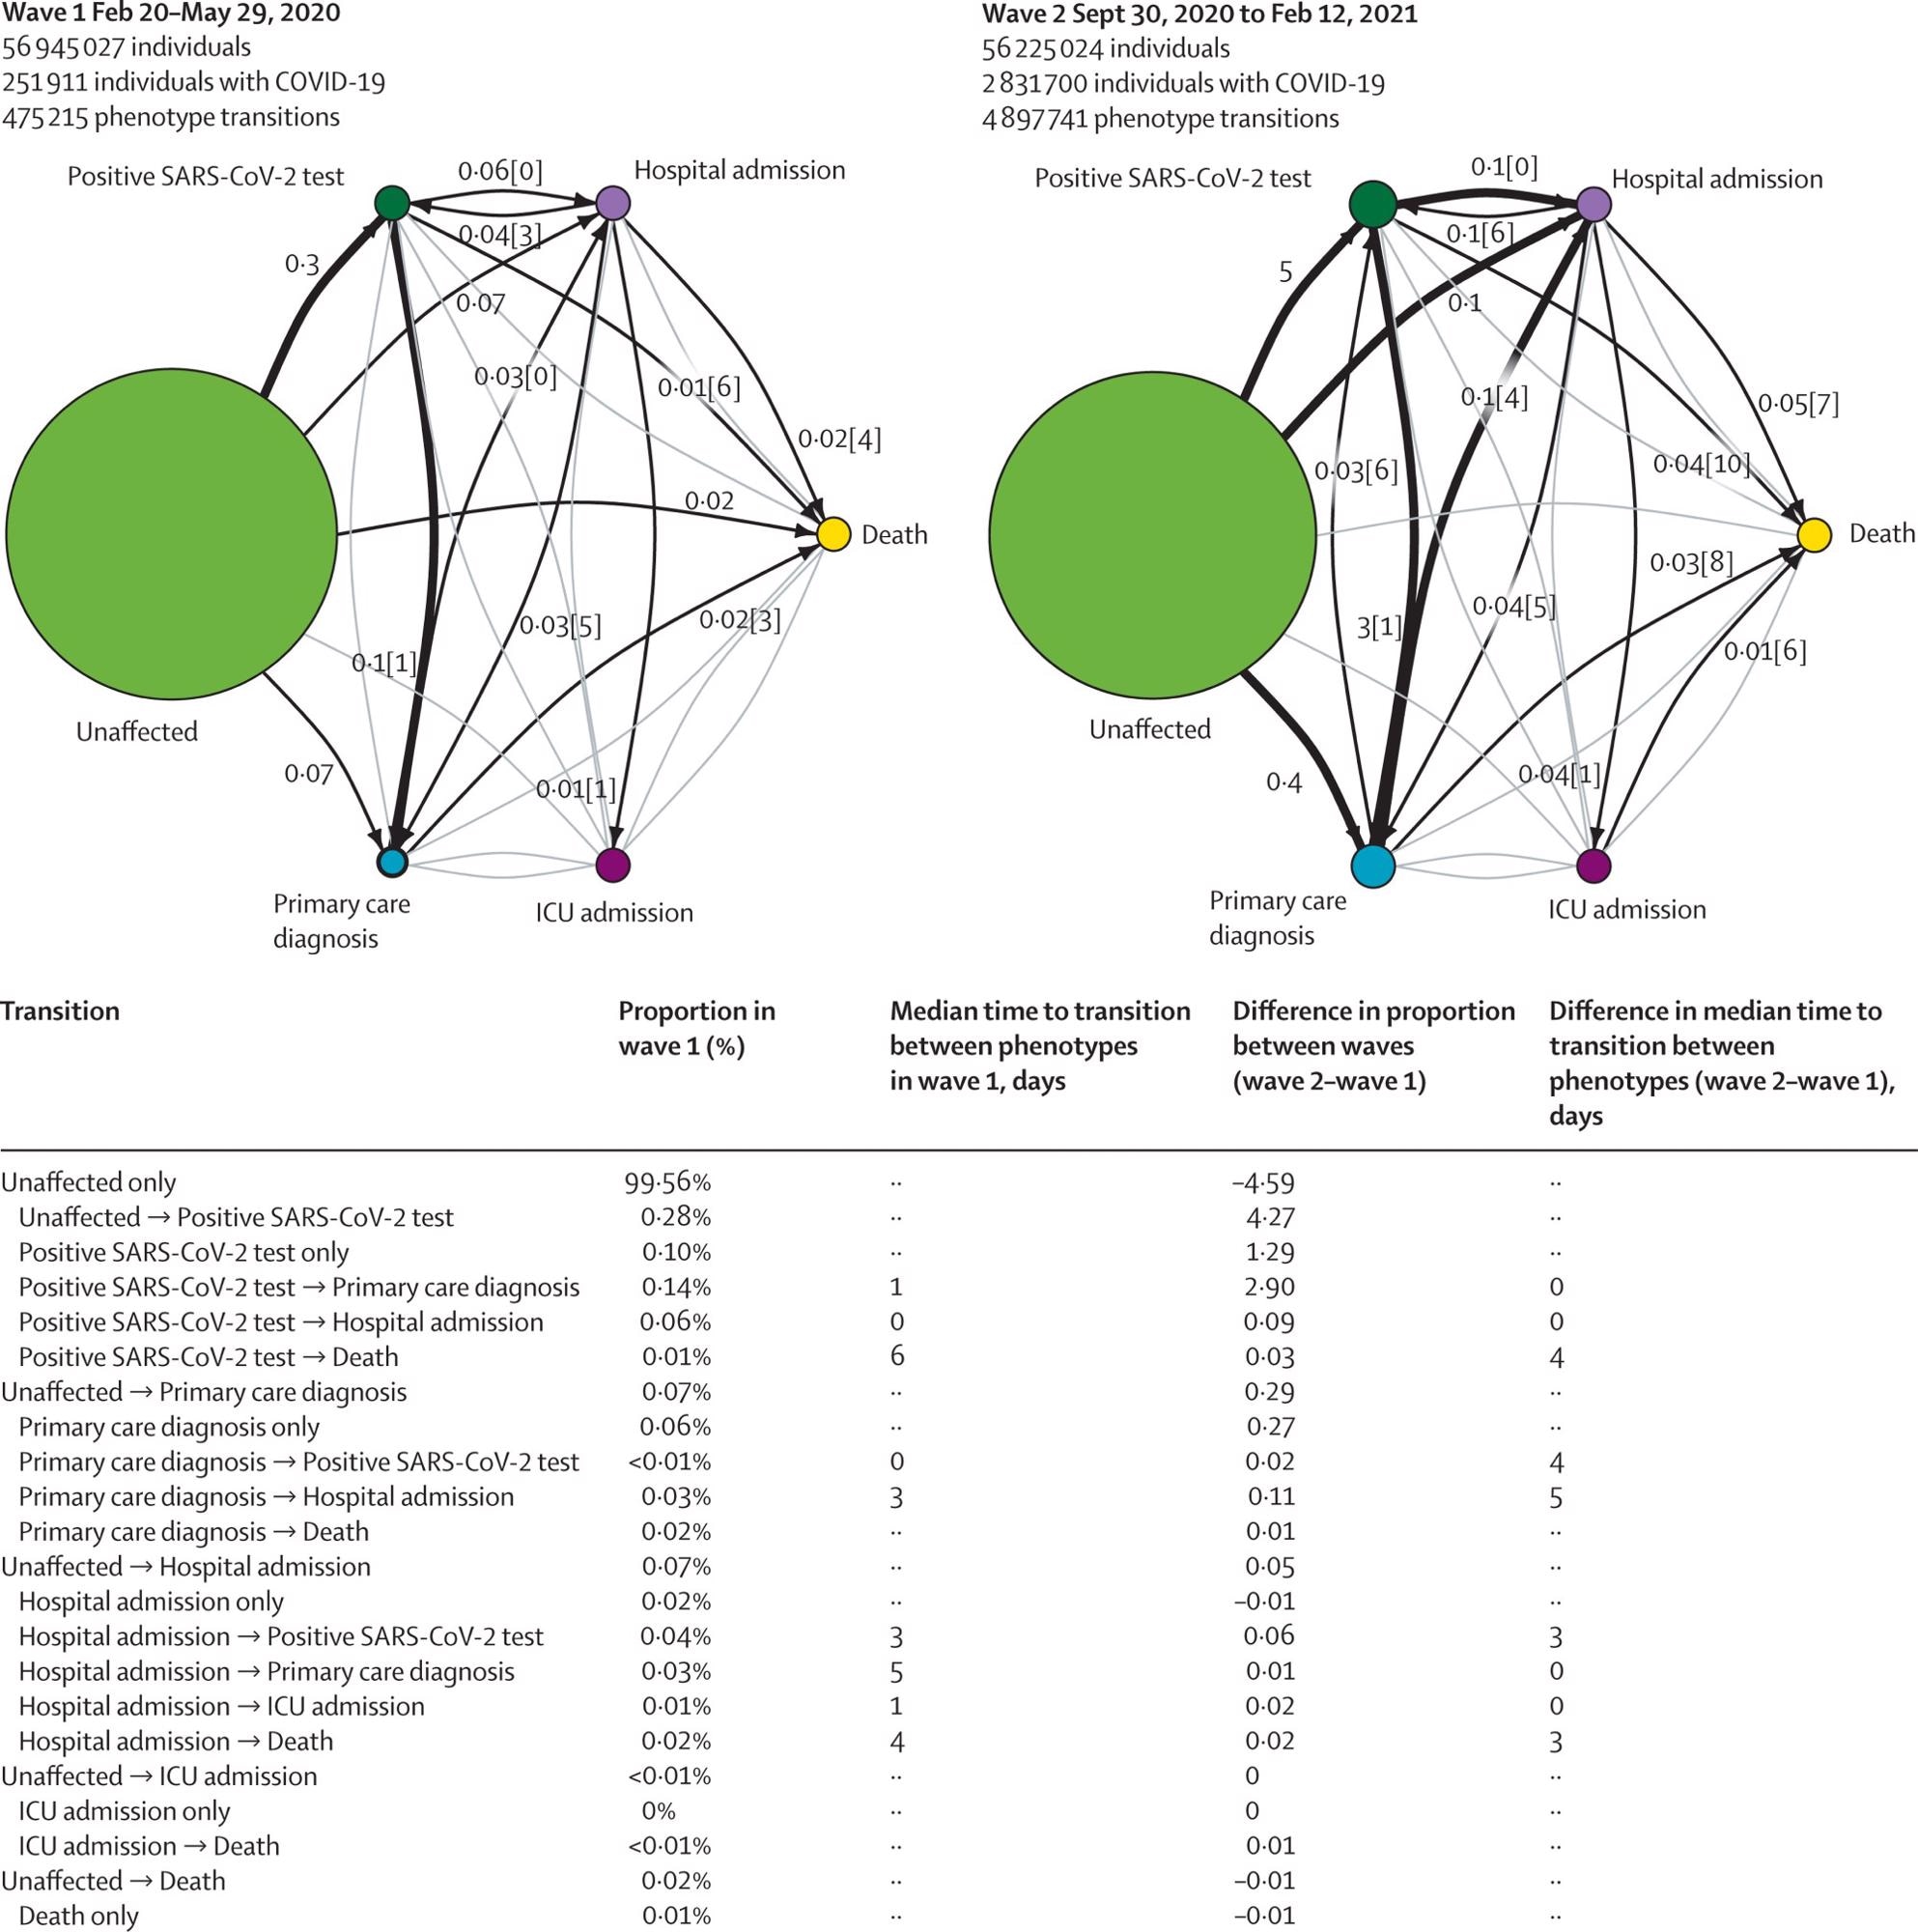
COVID-19 trajectory networks, The size of the circles represent the number of individuals with that event relative to the total study population. Numbers on arrows show the proportion of individuals who transitioned to each phenotype (relative to the number of individuals in that COVID-19 wave). Numbers in square brackets show median number of days between events across all individuals with that transition. Median days between individuals who were unaffected (ie, no recorded COVID-19 phenotype) and other severity phenotypes are not shown since they were not directly comparable between waves, due to difference in length of the two periods. Thick arrows represent transitions that occurred in 0·1% of individuals or more. Thin black arrows represent transitions that occurred in 0·01% individuals or more. Any transitions that occurred in fewer than 0·01% of individuals are not shown. All included individuals were alive and had no previous COVID-19 events recorded before the start date of the specified waves.
Conclusions
According to the authors, this was the first research that avails national data to provide a thorough overview of COVID-19 throughout pandemic waves, emphasizing vaccination, patient trajectories, and severity. The team documented the frequency of comorbidities, key demographic variables, the implications of the two major SARS-CoV-2 waves in England, and the influence of vaccination on COVID-19 severity on over 57 million individuals registered with a general practitioner and alive in England using information from linked EHRs at the national level.
The investigators also identified and defined patient trajectory pathways, which depict the primary transition routes for COVID-19 patients across the healthcare system. They also offer COVID-19 phenotyping methods that are reproducible and portray clinically significant phases of disease severity, such as primary care diagnosis, positive testing, hospital admission, death, and ventilatory support.
Overall, the present analyses reveal the vast range of COVID-19 trajectories, as seen by disparities in survival, incidence, and clinical courses. Using several EHR sources, the team has created a modular analytical structure that could track the influence of the SARS-CoV-2 pandemic and establish proof of clinical and policy significance.
 No link between Covid-19 vaccines and sudden cardiac death