Characterising Protein - DNA Complexes
Summary
Proteins and nucleic acids often bind in stoichiometric ratios above 1:1, resulting in phenomena such as cooperativity or allosteric hindrance. It is important to understand both the affinity and stoichiometric principles underlying such interactions in order to know how these biomolecules associate with each other as well as to develop drugs and other therapeutic agents which have a targeted action upon such associations.
In this article two multi-angle light scattering (MALS) techniques used to delineate the characteristics of such protein-DNA complexes in complementary manner are described. They are:
- MALS with SEC, size-exclusion chromatography (SEC-MALS) and protein conjugate analysis in order to arrive at the molar mass of the complex and the DNA fraction
- Composition-gradient MALS (CG-MALS) that measures the stoichiometry and affinity of each of the binding sites within the complex
Introduction
Binding between proteins and nucleic acids are fundamental to life, such as incorporation of viral genes into host DNA, and meiotic recombination of chromosomes. It is thus vital to know how these biomolecular complexes are formed and how they behave biophysically, to understand how viruses are able to take over host cells as well as to develop better ways to fight viral infections, cancers and genetic disease.
SEC-MALS
The use of MALS allows biomolecules as well as biomolecular complexes in solution to be measured for their molar mass, often with the addition of an upstream SEC, a detector for MALS and for ultraviolet radiation, as well as a differential refractive index (dRI) detector. This setup enables each eluting peak to be assessed for the determination of the absolute molar mass and molar mass distribution, despite the variation in the conformation or the presence of obstructive column interactions.
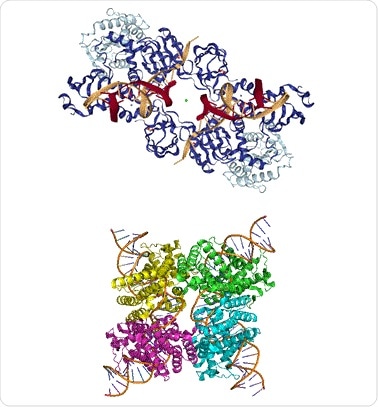
Figure 1. Top: PFV intasome (PDB ID: 3L2Q), Bottom: Cre-loxP synapse tetramer (PDB ID: 3MGV).
SEC-UV-MALS-dRI finds special application when used to determine the molar mass of protein conjugates, such as for pegylated proteins, protein-DNA complexes or proteins bound noncovalently in a complex with other types of biomolecules. It is used to supply data to the ASTRA® software for SEC-MALS from Wyatt, which subjects it to protein conjugate analysis to find the molar mass of the overall complex, and the amount of DNA or other modifier that is bound to the monomeric or oligomeric protein.
CG-MALS
This technique does not use fractionation to measure the stoichiometric aspects and affinity of interactions between macromolecules, neither does it employ immobilization, tagging or any other technique which could modify the complex in any way. Instead, protein and DNA are combined in a variety of ratios and the average molar mass for weight is then analyzed to obtain these measures. It is of great use at stoichiometric ratios beyond 1:1, or if the molecules show both self- and hetero-association. Moreover, this powerful technology differentiates between cooperativity and non-equivalent binding sites.
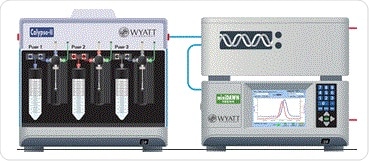
Figure 2. Schematic of CG-MALS hardward, including calypso, inline concentration (UV) detector, and MALS detector.
The use of SEC-MALS to a protein conjugate analysis method to study a prototype foamy virus integrase (PFV IN)- U5 viral DNA complex is described here. After loading the complex on the SEC column, the SAXS/SANS structure of the PVS intasome is analyzed to find the eluting peak, which conveys the DNA stoichiometry as shown in the top half of Figure 1.
Secondly, two different pH buffers are used to study the complex formed by Cre recombinase enzyme with a loxP DNA sequence of 34 bp length, using CG-MALS. It was established that two Cre recombinase molecules show cooperative binding to the DNA recognition site in a 2:1 complex which then forms a dimer to generate a synapse tetramer as shown in the lower half of Figure 1. The synapse is no longer detectable at pH 9.5.
Materials and Methods
SEC-MALS
A Superdex 200 10/300 GL column (GE Healthcare) was used for the SEC process. The effluent passed through an inline ultraviolet detector, followed by a DAWN® MALS detector and finally an Optilab® differential refractive index detector. The setup is shown in Figure 3.
The Astra 7 subjected the received data from this process to protein conjugate analysis. The protein was injected on the SEC-UV-MALS-RI system to find the extinction coefficient of the PFV-IN complex. The UV Extinction derived from the RI Peak analysis was now used under a dn/dc of 0.185 mL/g for the isolated protein alone. This gave the protein a measured extinction coefficient of 0.75 (g/L)-1cm-1 at 280 nm, while for the modifier DNA subjected to the protein conjugate analysis, the extinction coefficient of 13.2 (g/L)-1cm-1 at 280 nm at a dn/dc of 0.170 mL/g was applied.
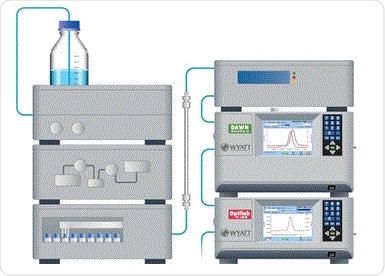
Figure 3. Schematic of SEC-UV-MALS-RI hardware for protein conjugate analysis, concentration (UV) detector, and MALS detector.
CG-MALS
A mixture of protein and DNA was added to a DAWN MALS detector and inline UV absorbance detector (Dionex) with the help of a Calypso® composition-gradient system seen in Figure 2. The ultraviolet absorbance data were then measured at two levels, 280 nm and 260 nm, at the same time. This was to find the specific stock concentration of each type of biomolecule. Each of the experiments in the MALS flow cell ran two concentration gradients for single components and one dual-component gradient where the components crossed over. This was to measure the self-association of Cre and loxP by themselves, and the heteroassociation of both of them, respectively. Following each of the runs, there was a gap in the flow of one minute in the case of self-association or 20 minutes for heteroassociation. This allowed equilibrium to be attained in the reactions taking place within the cell.
Figure 4 shows such an experiment, in which buffer-diluted Cre and loxP at about 0.02 mg/mL and 0.025 mg/mL, respectively, are filtered to 0.02 µm and then added to the Calypso. The experiment was carried out at a pH of 7.5 using HEPES buffer, comprising a mixture of 20 mM HEPES, 150 mM NaCl, and 2 mM DTT, and at a pH of 9.5 using bis-tris-phosphate (BTP) buffer composed of 20 mM BTP, 150 mM NaCl, 5 mM MgCl2, and 2 mM DTT. Both buffers were filtered to 0.1 µm first.
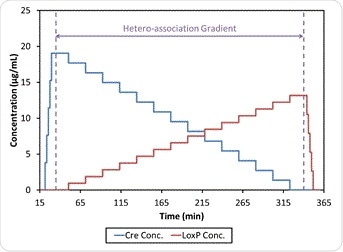
Figure 4. CG-MALS method including self-association gradients for Cre and loxP and hetero-association (crossover) gradient.
A fit-to-model was used for light scattering and composition data, on the CalypsoTM software, to obtain the stoichiometry and equilibrium dissociation constant (Kd) specific for each binding site.
Results and Discussion
Conjugate Analysis by SEC-MALS
The protein conjugate analysis method on Astra software makes use of the signals from the MALS, UV and dRI detectors to measure systems comprising two components. Both protein and modifier are measured as weight fractions per eluting slice of a chromatogram, because of the use of both UV and dRI detectors which can detect concentrations at the same time, always provided the two species taking part in the conjugation do not have the same extinction coefficients (ε), or the same specific refractive index increments (dn/dc), or both.
SEC-MALS data helps measure the molar mass for each of the two components and for the whole complex at each eluting slice. Thus the technique has been used to analyze covalent complexes of proteins and carbohydrates, as well as non-covalent complexes of membrane proteins and lipid micelles. The use of protein conjugate analysis was required to ensure that the stoichiometry of the protein-DNA complex crystallized in the PV intasome actually represented the complex when in solution.
The results are seen in Figure 5, with the molar masses of the protein-DNA complex and the individual components showing small differences across the peak, probably due to some degree of dissociation of the complex on the column. Thus the protein has a molar mass measured at 170 kDa near the leading edge which is the same as that shown in the crystal structure, with the presence of four PFV IV monomers in the intasome. At the same time, the molar mass of the DNA in the same spot is 22 kDa which confirms the presence of two oligonucleotides of 19 bp length each.
The protein conjugate analysis also yields data on the average of the protein fraction weight across the peak, which is 89.6%, which means the average dn/dc across the peak is 0.183 mL/g. This agrees with the original 0.182 mL/g estimate. This method avoids the need for a prior measurement of the protein and DNA needed for the experiment, provided the extraction coefficients and dn/dc per component are available, making it an independently valid measurement.
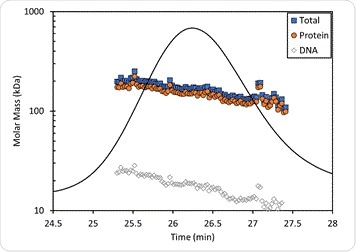
Figure 5. Protein conjugate analysis of PFV IN bound to U5 DNA. The molar mass of the protein fraction (orange circles), DNA fraction (open diamonds), and total complex molar mass (blue squares) are overlaid on the UV chromatogram.
Affinity and Stoichiometry by CG-MALS
At both pH 7.5 and 9.5, the CG-MALS data shows the occurrence of hetero-association between Cre and loxP. The weight-average molar mass as measured during the hetero-association gradient using CG-MALS is shown in Figure 6, while Figure 4 shows that during each of the two self-association gradients the molar mass of the individual components remain in an unchanged relationship with the concentration at 39 kDa and 23 kDa respectively, which means no self-association occurs in this type of condition. Thus increased molecular weight with binding is solely due to Cre-loxP heteroassociation alone.
The graph also shows that both binding affinity and stoichiometric ratios vary with the buffer pH. However, under both sets of conditions the [Cre] = 2[loxP] molar ratio is associated with the maximum molecular weight, which indicates that two Cre molecules bind each recognition site on the loxP molecule. On the other hand, the maximum molar mass shows an increase of 40% at pH 7.5 compared to pH 9.5, which means complexes of higher order are formed at higher pH. The fit-to-data analysis at each condition yields the equilibrium association constants and the absolute stoichiometry for each complex in each buffered mixture.
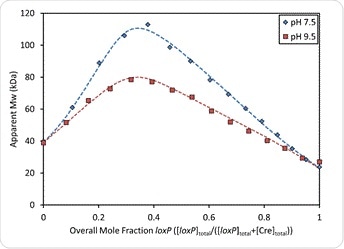
Figure 6. Overlay of measured weight-average molar mass and best fit curves (dashed lines) at pH 7.5 and pH 9.5. In both cases, the Mw reaches a maximum where [Cre] = 2[loxP] or an overall mole fraction of loxP = 0.33.
Binding at pH 7.5
Figure 6 also shows that the maximum measured molecular weight is at the [Cre] = 2[loxP], which indicates that the stoichiometric ratio of Cre to loxP site is 2:1 overall. Yet the maximum measured molecular weight of 113 kDa exceeds the molar mass of the complex described above, which is only 101 kDa, suggesting the formation of higher-order complexes.
When the pH is 7.5, slow association kinetics are in play according to the CG-MALS data obtained from the hetero-association gradient, shown in Figure 7. Cessation of flow allows equilibration of the complex in the flow cell. The light scattering signal increases with the molar mass over time due to the increase in the number of Cre-loxP complexes, which eventually plateaus at about 15 minutes. This is significant because this is the time scale that is often seen with the formation of higher-order assemblies of biomolecules.
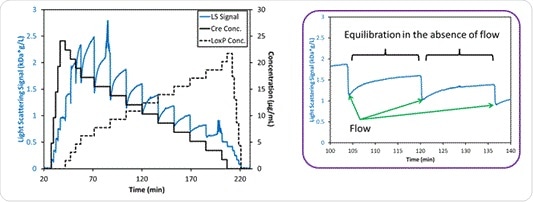
Figure 7. Left: Measured light scattering signal for the interaction between Cre and loxP at pH 7.5. Right: Light scattering intensity for two mixtures of Cre and loxP, showing the time during which the flow is stopped and the hetero-association reactions come to equilibrium within the MALS flow cell over ~15 minutes.
Binding at pH 7.5
Multi-Order Cooperativity
Fitting to the CG-MALS data required a set of three Cre-loxP complexes for the association model, which corresponded to 1:1, 2:1, and 4:2 stoichiometric ratios. Thus the binding sites are bound by Cre with positive cooperativity; the first to each of the palindromic recognition sites on loxP to return a Kd = 170 nM, and the second at about ten times higher affinity, Kd = 19 nM.
The occurrence of the 2:1 ratio is associated with synapsis or the formation of self-assemblies to form a 4:2 stoichiometry at the end, Kd = 400 nM, as shown at ph 7.5 in Figure 8. Both (Cre)2(loxP) and (Cre)4(loxP)2 are at highest concentration when [Cre] = 2[loxP] = 462 nM. Synapsis fails to appear at pH 9.5 which means that the first binding step of Cre to loxP causes the affinity to increase and then cooperativity also rises further beyond this.
Benefits of CG-MALS
The use of CG-MALS was superior to surface-based technologies such as gel shift assays because it measured the formation of all three complexes in solution. The whole mechanism of binding was thus assayed. Unlike other methods in which the Cre and loxP concentrations had first to be regulated so that only the first Cre binding could occur, on the assumption that no synapsis would then occur, or in which DNA saturation with protein had to be ensured so that synapsis could be measured, the whole interaction could be studied rather than piece by piece.
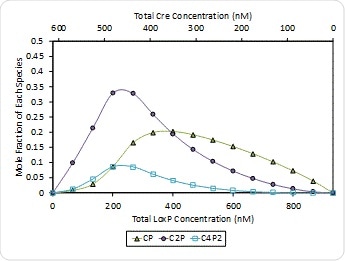
Figure 8. Molar composition of Cre-loxP complexes formed at pH 7.5 – (Cre)(loxP) (CP, green triangles), (Cre)2(loxP) (C2P, purple circles) and (Cre)4(loxP)2 (open squares). The composition of free Cre and loxP monomers has been left off for clarity.
Again, it is possible that a piecemeal approach could misinterpret the measured binding affinity because it assumes that only one type of interaction is occurring at one time. The sampling of all types of mixtures, with an excess of Cre and an excess of loxP, in different compositions, makes sure that measurement of all aspects of the complex formation is achieved. The interpretation is dependent upon the light scattering which in turn is related directly to molar mass. This makes for direct measurement of the newly-forming interactions and equilibrium constants for each.
A third advantage is the insight it provides into the kinetics of association in solution. The light scattering intensity indicates the molar mass in relation to time which tells the researcher how much time is needed to reach the equilibrium point, or whether self-assembly has no endpoint in this setup.
Binding at pH 9.5
When the pH is 9.5 the type of interaction is quite different, with an absence of slow association kinetics as at pH 7.5, a lower weight-average molar mass and thus the absence of synapsis, as shown in Figure 6. The same 2:1 ratio applies but dimerization does not occur to form a synapse tetramer.
Cooperativity is also noticeably absent at pH 9.5, and two Cre molecules bind each of the loxP with the same affinity Kd = 24 nM, which may be observed in Figure 9 which depicts how species are distributed in solution during the hetero-association gradient.
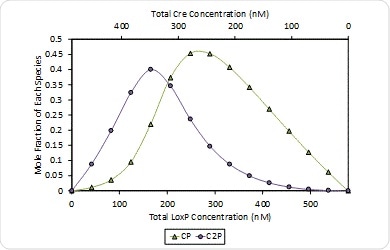
Figure 9. Molar composition of Cre-loxP complexes formed at pH 9.5 – (Cre)(loxP) (CP, green triangles) and (Cre)2(loxP) (C2), purple circles). The composition of free monomers has been left off for clarity.
At pH 9.5, the loxP has two equivalent binding sites and therefore the (Cre)(loxP) complex composition is predominant where [loxP] ≥ [Cre]. Thus this complex reaches the highest composition when [Cre] = 2[loxP] = 343 nM.
Conclusions
MALS is superior in allowing complementary measurements of protein-DNA complexes to be taken at multiple points, along with their interactions. Some important points include:
- Protein conjugate analysis using the SEC-MALS-UV-dRI allows systems with two components to be studied for the oligomeric state, the conjugation ratio and the molar masses of the components and the complexes
- CG-MALS allows such complexes to be quantitatively assessed quickly and in depth, revealing both cooperative interactions and self-assembly to result in higher-order structures. Each binding site is the target of microscopic equilibrium constant determination, as well as the kinetics of the process.
Thus SEC-MALS and CG-MALS use the same MALS, UV and dRI detectors on different samples which are prepared and delivered distinctively, to act as an easy and complete setup for the study of the biophysical characteristics of the samples. Protein-DNA interactions are well studied using these techniques which are powerful yet simple, and versatile enough to be applied to other biomolecular complexes as well.
Bibliography
[1] K. Gupta et al., "Solution conformations of prototype foamy virus integrase and its stable synaptic complex with U5 viral DNA," Structure, vol. 20, pp. 1918-1928, 2012.
[2] J. Morimoto et al., "Dextran as a generally applicable multivalent scaffold for improving immunoglobulin-binding affinities of peptide and peptidomimetic ligands," Bioconjugate Chemistry, vol. 25, pp. 1479-1491, 2014.
[3] G. Y. Berguig et al., "Intracellular delivery and trafficking dynamics of a lymphoma-targeting antibody-polymer conjugate," Molecular Pharmaceutics, vol. 9, no. 12, pp. 3506-3514, 2012.
[4] Y. Peng and L. Zhang, "Characterization of a polysaccharide-protein complex from Ganoderma tsugae mycelium by size-exclusion chromatography combined with laser light scattering," Journal of Biochemical and Biophysical Methods, vol. 30, pp. 243-252, 2003.
[5] S. Kenrick and M. Chen, "A light scattering toolbox for characterizing transport proteins and their interactions," 2014. [Online]. Available: https://www.wyatt.com/.
[6] D. J. Slotboom et al., "Static light scattering to characterize membrane proteins in detergent solution," Methods, vol. 46, no. 2, pp. 73-82, 2008.
[7] K. Ghosh et al., "Synapsis of loxP sites by Cre recombinase," The Journal of Biological Chemistry, vol. 282, no. 33, pp. 24004-24016, 2007.
[8] J. Pallesen et al., "Structures of Ebola virus GP and sGP in complex with therapeutic antibodies," Nature Microbiology, vol. 9, no. 1, p. 2016, 2016.
[9] K. Hastie and E. O. Saphire, "Understanding Antibody and Viral Glycoprotein Interactions Using CG-MALS," 2015. [Online]. Available: https://www.wyatt.com/. [Accessed 18 4 2018].
[10] M. Zhao et al., "Mechanistic insights into the recycling machine of the SNARE complex," Nature, vol. 518, pp. 61-67, 2015.
[11] D. Some, "Light-scattering-based analysis of biomolecular interactions," Biophysical Reviews, vol. 5, no. 2, pp. 147-158, 2103.
[12] J. Arora et al., "Charge-mediated Fab-Fc interactions in an IgG1 antibody induce reversible self-association, cluster formation, and elevated viscosity," mAbs, vol. 8, pp. 1561-1574, 2016.
[13] D. B. Halling et al., "Calcium-dependent stoichiometries of the KCa2.2 (SK) intracellular domain/calmodulin complex in solution," The Journal of General Physiology, vol. 143, no. 2, pp. 231-252, 2014.
[14] A. K. Attri et al., "pH-dependent self-association of zinc-free Insulin characterized by concentration-gradient static light scattering," Biophysical Chemistry, vol. 148, no. 1-3, pp. 28-33, 2010.
[15] A. Martos et al., "Characterization of Self-Association and Heteroassociation of Bacterial Cell Division Proteins FtsZ and ZipA in Solution by Composition Gradient-Static Light Scattering," Biochemistry, vol. 49, no. 51, pp. 10780-10787, 2010.
[16] S. L. Mitchell et al., "The VieB auxiliary protein negatively regulates the VieSA signal transduction system in Vibrio Cholerae," BMC Microbiology, vol. 15, no. 59, pp. 1-16, 2015.
[17] H. L. Zhu et al., "Quantitative Characterization of Heparin Binding to Tau Protein," The Journal of Biological Chemistry, vol. 285, no. 6, pp. 3592-3599, 2010.
[18] J. C. Gaulding et al., "Reversible Inter- and Intra-Microgel Cross-Linking Using Disulfides," Macromolecules, vol. 45, no. 1, pp. 39-45, 2012.
[19] G. V. Crichlow et al., "Dimerization of FIR upon FUSE DNA binding suggest a mechanism of c-myc inhibition," The EMBO Journal, vol. 27, pp. 277-289, 2008.

This information has been sourced, reviewed and adapted from materials provided by Wyatt Technology Corp.
For more information on this source, please visit Wyatt Technology Corp.