Vaccines are a crucial weapon in the fight against animal and human disease and many lives have been saved by them since the first vaccine was created more than 200 years ago.

Image Credit: David S. Goodsell, RCSB Protein Data Bank
This article will outline how the different types of light scattering can be utilized in the characterization of vaccines. By quantifying multiple characteristics such as shape, size, molar mass and additional parameters originating from these crucial attributes, light scattering assists in vaccine development, manufacture and discovery. This article discusses multiple vaccine classes that cover a broad range of physicochemical features.
The first vaccines were either attenuated virus or inactivated virus. While these classes of vaccine continue to be used, they can present safety risks and commonly require a very long time to test, develop and manufacture.
Since then, different approaches have been adopted. Listed from the oldest to the most recent, regarding adoption and development, they are:
- Subunit vaccines, which are normally protein antigens formulated to be targeted by the immune system.
- Polysaccharide conjugates which are usually for bacterial pathogens.
- Virus-like particles, which are usually recombinant, self-assembled, viral capsids that function like whole viruses (these may also consist of membrane elements); and
- Nucleic acids coding for antigens where some carrier nanoparticles are normally required.
Nearly all vaccines are in the size range that can be examined by dynamic, electrophoretic and static light scattering. The key measurements that can be determined by these methods are zeta potential, radius and molar mass.
Zeta potential and size are effective indicators of delivery success for specific vaccines, particularly for those that require nanocarriers. Molar mass, radius and other derivative measurements assist in the characterization of virus or protein aggregation, biomolecular interactions, molecular conformation and conjugate composition, such as a VLP with nucleic acid cargo.
The article will begin by describing the main concepts of light scattering and instrumentation, followed by multiple case studies of the different vaccine classes and the importance of light scattering results to their manufacture, discovery and development.
The light scattering toolkit
Three types of analytical light scattering are suitable for bionanoparticles. These are electrophoretic light scattering (ELS), which determines charge and zeta potential, dynamic light scattering (DLS), which determines hydrodynamic radius, Rh and multiangle light scattering (MALS), which, when used with a concentration detector, determines absolute molar mass M and size (root-mean-square radius, Rg).
Light scattering instrumentation
Multi-angle light scattering: The scattered intensity is measured at several angles by all online MALS instruments, which is extrapolated to 0° to determine the molar mass. The dependence of scattered intensity vs. angle can be fit to calculate Rg for samples with a radius that is greater than 10 nm.
The DAWN® instrument features 18 detectors from 22° to 147° and calculates Rg across a broad range, from 10 nm to 1000 nm. It additionally measures molar mass from 200 Da to 1 GDa when used with an online concentration detector such as the Optilab® differential refractive index detector.
For samples with a radius that is approximately less than 50 nm, for example, proteins, three angles are adequate to fit the data to calculate Rg. The miniDAWN®, for standard HPLC and the microDAWN®, for UHPLC are the two 3-angle MALS instruments available. The next section will outline the differences between UHPLC and HPLC.
An embedded WyattQELS™ module can be used to outfit any of the MALS instruments for concurrent online DLS measurements. MALS, in combination with DLS can provide information on molecular conformation because the physical bases for Rg and Rh vary and their ratio includes data that shows how mass is distributed across the molecule.
Online measurements normally include the separation of species in solution. DLS measurements can similarly be performed in “batch,” that is, with no fractionation.
Batch DLS/ELS: Three batch DLS instruments are offered by Wyatt Technology. These are Mobius®, NanoStar® and the DynaPro® Plate Reader (DPR). Along with calculating Rh, the NanoStar and DPR can also carry out single-angle static light scattering (SLS) measurements to determine the weight-average molar mass, with a 1 MDa upper limit.
In conjunction with DLS, Mobius carries out ELS measurements which directly calculate electrophoretic mobility, from which charge and zeta potential can be determined.
Light scattering with separation
Field-flow fractionation (FFF) and size-exclusion chromatography (SEC) are two auxiliary methods that complement and optimize light scattering, both of which separate nanoparticles and macromolecules in relation to size. After separation, each fraction is analyzed by downstream inline detectors such as DLS, MALS and more.
The combination of characterization and separation, given the term FFF-MALS or SEC-MALS, delivers high-resolution distributions of molar mass and size, along with more comprehensive information on conjugate content (for example cargo in the case of gene vectors) and structure.

Figure 1. Typical SEC-MALS setup, with chromatography pump, autosampler, DAWN MALS detector and two concentration detectors: UV HPLC module and Optilab RI. Image Credit: Wyatt Technology
One type of high-performance liquid chromatography (HPLC) is called SEC which is a popular technique for the fractionation of macromolecules that uses a packed column as stationary phase. UHPLC has recently developed conventional HPLC with the addition of specialized columns.
The benefits of UHPLC are a lower minimum sample requirement, higher resolution and a more efficient runtime. The microDAWN instrument is specifically configured to couple with UHPLC columns and pumps and to uphold the superior resolution offered by this method, together known as UHP-SEC-MALS.
Instead of a packed stationary phase, FFF employs an open channel and the technique delivers specific benefits compared to SEC. Firstly, its separation range of 1 to 1000 nm radius is much greater than that of SEC, which makes it more appropriate for standard viruses and other vaccines, which are approximately 100 nm in diameter. Secondly, fragile polymers or bionanoparticles will not be disrupted by FFF, which imparts little to no shear due to the lack of stationary phase.
An FFF-MALS system, similar to SEC-MALS, can be combined with HPLC elements such as a UV detector, autosampler and pump. FFF-MALS differs in that the column is replaced by an Eclipse FFF channel and controller. Refractive index, fluorescence, light scattering and additional inline detectors may be installed downstream for complex characterization.
Measuring biomolecular interactions
Binding can be analyzed in detail using a technique known as CG-MALS, achieved by combining the DAWN MALS instrument with a Calypso® composition-gradient delivery system.
The weight-average molar mass of a solution in CG-MALS is measured as a function of composition and concentration to establish the binding affinity and absolute stoichiometry of complex formation.
It is a label-free technique for the analysis of interactions in solution and is appropriate for hetero-association, self-association and detailed multi-valent interactions.
Real-time MALS for process analytics
As with many biologics, production processes for vaccines are comprehensive and should be closely observed to uphold product quality. While process analytical technology (PAT) of downstream purification processes and bioreactors normally analyze process parameters, it is much more advantageous to analyze, in real time, actual product characteristics.
UltraDAWN® is a specialized MALS detector designed for process control and process development. With OBSERVERâ software, the ultraDAWN details particle concentration, molar mass and particle size via real time MALS (RT-MALS).
The system can be utilized on-line for high flow rates or inline for low flow rates and can be programmed to process endpoints or activate fraction collection in line with the criteria connected to these quantities.
Case studies
The light scattering toolkit measures several characteristics of biological macromolecules and additional nanoparticles that are vital during product and process development, discovery, quality assessment and the manufacture of vaccines. These are:
- Glycan content of glycoproteins
- Protein-protein and protein-nucleic acid binding
- Size and structure
- Nucleic acid cargo content of carrier nanoparticles
- Aggregation and stability
- Zeta potential of carrier nanoparticles
- Particle concentration
The rest of this article outlines each measurement in additional detail by offering comparisons with other techniques and examples. Lastly, the applications of MALS as process analytical technology are discussed.
Antibody-antigen binding
The adaptive immune response is mediated by the recognition of a T-cell receptor or an antibody to an antigen. A vital early stage in vaccine research is the characterization of the binding of immunoglobulins to putative immune targets such as viral surface glycoproteins.
These interactions rely not only on the specificity and strength of binding but also on the pathogenic target’s oligomeric state, several of which are not monomeric. As absolute molar mass is measured by MALS, it is ideal for the clear characterization of the stoichiometry and strength of binding interactions.
Complexes can be characterized either without fractionation, using composition-gradient MALS (CG-MALS), or with fractionation, through size-exclusion chromatography (SEC-MALS). Using either of these approaches, different information about the interacting species can be revealed.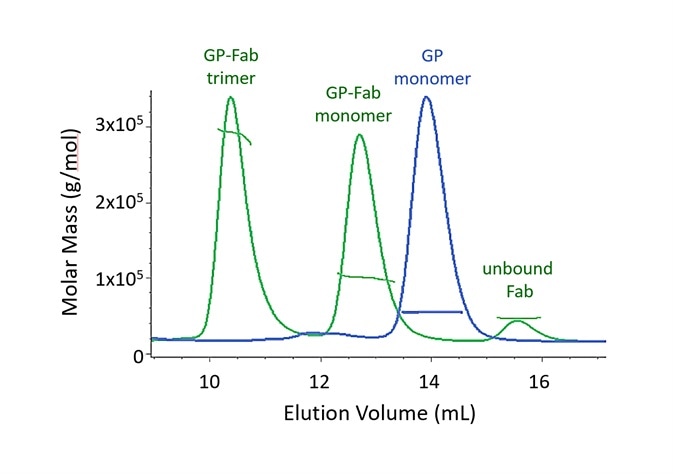
Figure 2. Both monomer and trimer forms of Lassa virus surface glycoprotein, GPCysR4, bind tightly to the Fab fragment of a neutralizing antibody. Adapted with permission from Hastie, et al.1. Image Credit: Wyatt Technology
In SEC-MALS, the existence of molecular complexes and their oligomeric state is analyzed based on multiples of a particular molar mass of a monomer. Two SEC-MALS chromatograms are presented in Figure 2, of a Lassa virus glycoprotein (GP) and of the species created after GP is incubated with an IgG Fab domain that binds to GP1.
The molar masses calculated by MALS analysis at each point in the peak are displayed on the chromatogram.
When comparing the unbound Fab and GP monomer, it is apparent that these proteins elute at different volumes, although they have molar masses that are alike.
This is a result of varying conformations. The glycoprotein consists of a substantial fraction of glycans, which, compared to an equal mass of well-folded protein, cover a much bigger hydrodynamic volume. The measurement of conjugated proteins like this viral surface moiety is outlined in the following section.
The GP-Fab monomer complex is clearly determined as such by its molar mass, which is just the total of the masses of GP and Fab.
In theory, while it could comprise of a GP dimer (which would have a molar mass that is highly similar), this possibility is eradicated through the conjugate analysis, which demonstrates that the content of glycan is equivalent to that of GP + Fab instead of GP + GP. The GP-Fab trimer is additionally observed in the same way.
The affinity must be sufficiently high in order to identify the complexes so that they do not dissociate on the column.
The decreasing molar mass on the trailing shoulders of dimer peaks and GP-Fab monomer is caused by complex dissociation as a result of dilution while traveling through the SEC column. A precise equilibrium dissociation constant Kd cannot normally be quantified by SEC-MALS because the solution is not in equilibrium.
A novel technique for measuring the Kd and stoichiometry of protein interactions can be realized by coupling a MALS detector to a Calypso composition-gradient delivery system (CG-MALS).
CG-MALS is effective for complex interaction combinations along with basic heterodimer formation. As an example, if CG-MALS was used to measure the sample in the green trace of Figure 2, all three populations would be found, in addition to the corresponding stoichiometries and binding strengths for the two complexes.
No labeling is involved in CG-MALS, unlike FRET or additional dye-based binding assays. This method also offers crucial advantages when compared to SPR, ELISA and further surface-bound assays, which can introduce artifacts when the orientation of surface properties or immobilization modify the binding characteristics.
Protein conjugate analysis quantifies glycan content of antigenic glycoproteins
Glycosylation is a primary characteristic of the majority of viral antigens. In the biochemical arms race between the host immune system and pathogens, glycosylation of viral antigens may function to conceal the invading pathogen2. Due to this, in the logical composition of subunit vaccines, a first stage may be to consider the total content of glycan.
Either refractive index detection or UV absorption can be used in standard SEC-MALS analysis to quantify this concentration. The glycans cannot be detected by UV in a glycoprotein and the dn/dc values of proteins and glycans are different. As such, a precise molar mass result cannot be provided by this analysis.
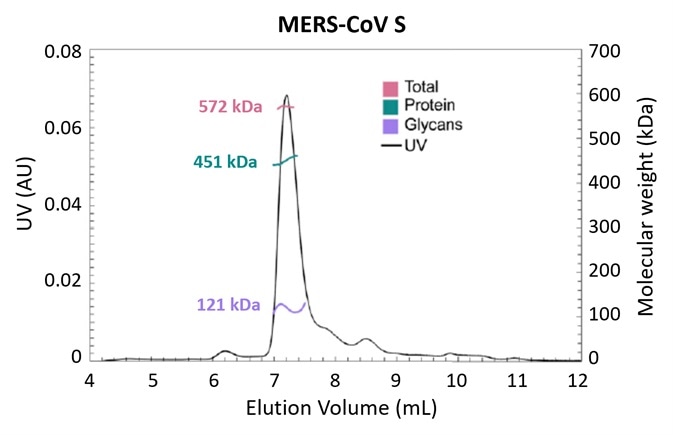
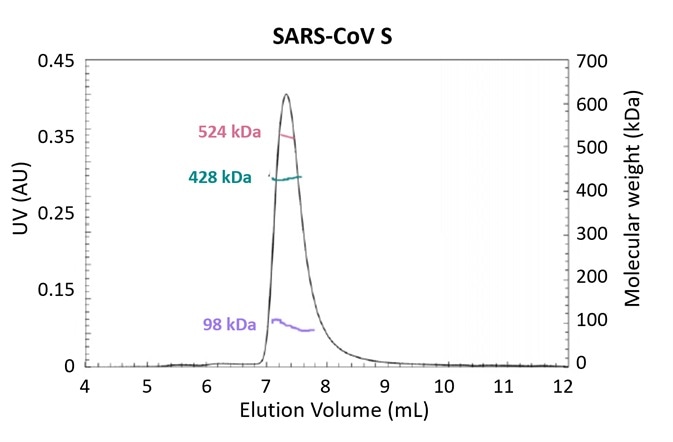
Figure 3. Glycosylation is one strategy employed by pathogens to evade the immune system. Using the MALS-UV-RI Protein Conjugate Analysis method to distinguish between the total proteinaceous molar mass and that of glycans, total glycan content in both SARS-CoV and MERS-CoV spike protein is found to be ~25% by mass. Adapted from Walls, et al.3 with permission. Image Credit: Wyatt Technology
The molar masses of both protein and glycan components (along with the total molar mass) in glycoproteins and other conjugates can be simply measured with the use of ASTRA’s Protein Conjugate Analysis in an SEC-MALS study that employs both UV and RI concentration detectors.
Figure 3 presents the results of an experiment investigating the structural determinants of antibody neutralization and binding. The total glycan content was determined to be ~25% of the total mass as a starting point to measure the nature and prevalence of glycosylation in the spike (S) target antigen for both SARS-CoV and MERS-CoV3.
The UHPLC-compatible microDAWN and microOptilab™ were used to collect this data. As little as 1 µL of sample can be measured in a fraction of the run time compared to conventional HPLC with the higher resolution offered by UHPLC pumps and columns.
Protein conjugate analysis can also be effectively used for the quantification of nucleic acid cargo in carrier nanoparticles, as outlined in the following section.
Detecting and quantifying nucleic acid cargo in carrier nanoparticles
During purification, expression, assembly and packaging, carrier nanoparticles such as VLPs or LNPs can be observed for attributes such as incomplete assembly, size, nucleic acid content and aggregation through the use of various methods in the light scattering toolkit.
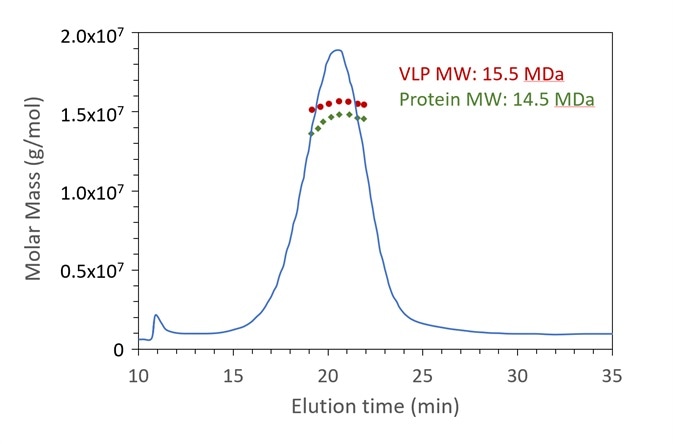
Figure 4. FFF-UV-MALS-RI confirms the expected molar mass of protein capsid and genetic content for a VLP sample. The Rg also agrees with the expected value. Data courtesy A. Citkowicz, Bayer Healthcare Pharmaceuticals. Image Credit: Wyatt Technology
DNA cargo of VLP via conjugate analysis
As outlined in the previous section, protein conjugate analysis provides information on the molar masses along with the relative quantities of two moieties. While frequently employed to measure glycan and protein in the context of glycoproteins, it can also quantify nucleic acid and protein in the context of gene vectors and additional protein-nucleic acid complexes.
When combined with a fractionation method such as FFF, high resolution size distribution can highlight the existence of aggregates, dimers, or oligomers.
In the example of FFF-UV-MALS-RI demonstrated in Figure 4, a final VLP product with DNA cargo is shown to be 15.5 MDa total, comprising of 14.5 MDa protein capsid, with 1 MDa of DNA (not presented) in relation to the full genome of 1.6 kbp4. The Rg is also calculated at 22 nm (not presented).
mRNA cargo of LNP via conjugate analysis
The protein conjugate technique was so named because it was first used in glycoproteins, but it can be employed for any conjugate particle, so long as either or both the dn/dc and the UV extinction coefficient of the two moieties differ.
The same technique and principle as in the previous example of VLP can be employed to characterize RNA cargo in lipid nanoparticles (LNPs). Both RI and UV concentration detectors are necessary for this investigation and UV scattering will invalidate the concentration measurement in particles that have a radius of approximately more than 30 nm.
A proprietary technique can amend the UV scattering in the extinction coefficient and the molar mass of both lipid and RNA is calculated for each fraction. From these results, the RNA mass fraction Fw = Mw, RNA: Mw, total can be determined.
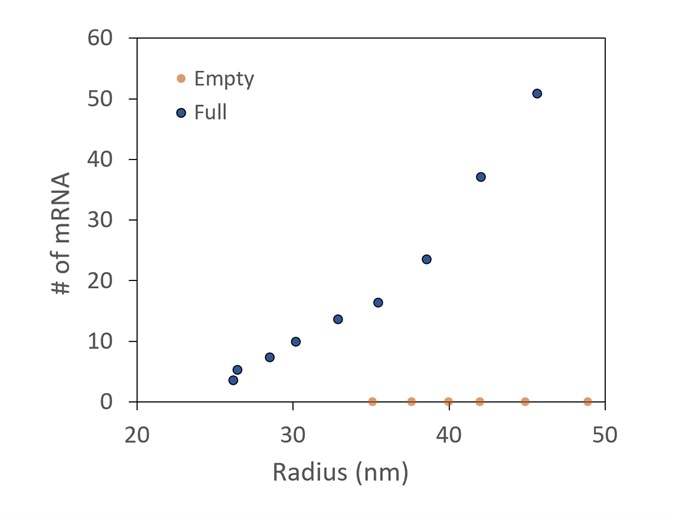
Figure 5. Conjugate analysis, with correction for UV scattering, shows two different preparations of LNPs, one with and one without mRNA cargo. It is confirmed that there is no mRNA detected in the empty sample. In the full, more mRNA molecules are taken up by the larger LNPs. Image Credit: Wyatt Technology
A comparison between LNP preparations with and without mRNA encapsulated is presented in Figure 5. The number of mRNA molecules loaded can be measured using the specialized LNP analysis.
It is shown that no mRNA is identified in the empty control. The total mRNAs in each LNP increase as the LNP size increases in the encapsulated sample.
Sizing for LNPs, VLPs and other carrier nanoparticles
Size is one of the most effective indicators of the potency of nanocarriers and pharmacokinetic behavior, particularly if entry into a nucleus or cell is required.
As an example, for lipid nanoparticles (LNPs) employed in mRNA vaccines, those that have a radius that is less than 75 nm are most effective in reaching the target tissue and being taken up by antigen presenting cells (APCs)5. For regulatory purposes, size is also a common feature for the evaluation of reproducibility and quality.
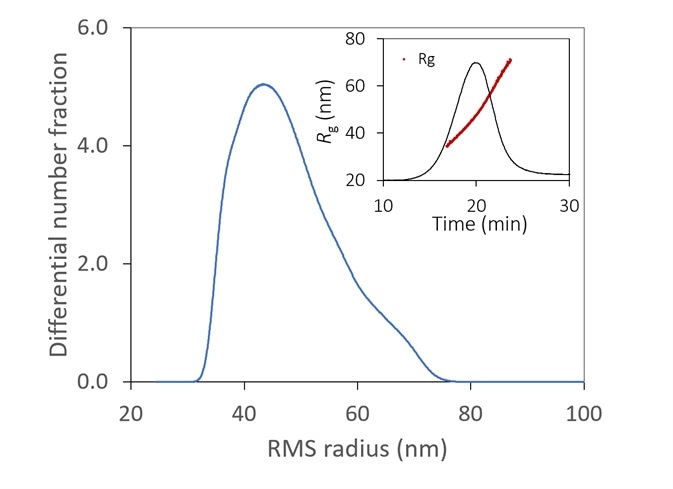
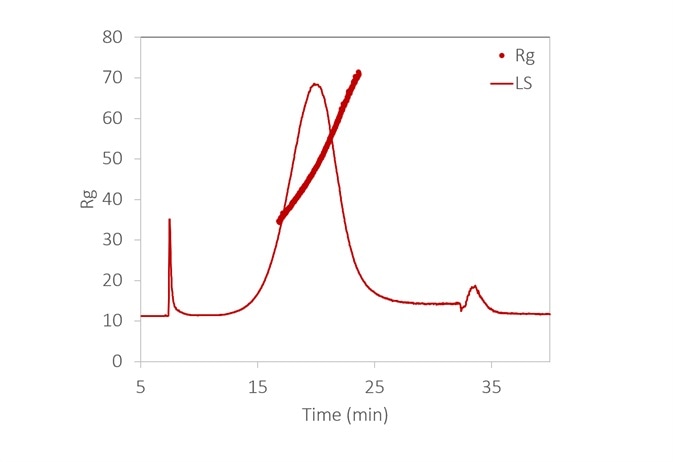
Figure 6. With the aid of FFF to fractionate the sample, the size distribution of a lipid nanoparticle preparation is determined with high resolution. It is relatively monodisperse, with 99% between 35 - 70 nm. Inset: original fractogram, with rms radius overlaid. Image Credit: Wyatt Technology
Nanoparticles can be monodisperse or highly polydisperse, depending on how they are synthesized. Both FFF-MALS and SEC-MALS, with online DLS as an optional inclusion, deliver high-resolution size distribution data, as the rms radius Rg and/or the hydrodynamic radius Rh can be quantified at the same time (view WP9001 for nanoparticles and WP2608 for LNPs).
Particle concentration can also be accurately and directly measured employing a MALS detector alone, as outlined in the following section.
Figure 6 displays the size distribution of an LNP sample, measured by FFF-MALS. More than 90% of the particles are in the range of 35 to 70 nm Rg, with no detection of aggregates.
Particle concentration of virions
It is crucial to understand the level of aggregation and the total physical titer of virions at each stage of the process when creating effective and safe vaccines. FFF-MALS achieves this with no tedious sample preparation or specialized reagents.
Once a technique has been decided upon, a run can be completed in 30 to 60 minutes with minimal preparation time and a standard HPLC autosampler can be used to automate this process.
SEC-MALS can additionally be employed for this kind of research, but SEC is restricted to a much smaller radius compared to FFF. In both examples, a precise particle concentration is acquired, needing only a MALS detector with the refractive index of the particle as input.
Opposed to PCR techniques, which are utilized to predict infectious titer, FFF-MALS identifies all particles, including those lacking genetic material or defective virions. The presence of a target nucleic acid sequence for amplification is not required by FFF-MALS.
Table 1 displays a comparison of percent aggregate and total count (by integrating concentration, in particles/mL) of an influenza virus sample, quantified by four methods, two of which use MALS and two that are based on microscopy6.
The total count from FFF-MALS corresponds well with TEM and offers a precision that is five times higher. The total count is underestimated by the SEC-MALS result, probably due to larger particles being poorly resolved or held up in the column. FFF-MALS also identify aggregate content that SEC-MALS cannot detect and corresponds well with TEM.
Table 1. In an influenza sample, FFF-MALS outperforms SEC-MALS in terms of detecting aggregate and in total virus count, as confirmed by microscopy (TEM). Both FFF-MALS and SEC-MALS measure much larger ensembles than TEM with correspondingly smaller %CV in total count. Source: Wyatt Technology
| Method |
log10 total virus count (mL) |
% Aggregate |
| Average |
%CV |
Average |
%CV |
| FFF-MALS |
10.4 |
1.8 |
25 |
24.5 |
| SEC-MALS |
9.9 |
0.8 |
19 |
4.4 |
| AFM |
NA |
NA |
23 |
8.9 |
| TEM |
10.2 |
10.0 |
25 |
8.2 |
Stability, aggregation and formulations
Aggregation is a key concern for vaccine candidates with a range of sizes and chemistries, from VLPs to proteins. At best, it may decrease yields and the efficiency of industrial procedures and at worst, it can produce toxicity. It is also an indicator of an unstable native quaternary and tertiary structure.
To uphold total stability and decrease the risk of aggregation, panels of hundreds of combinations of excipients and buffer conditions are investigated during the early formulation stage.
DLS provides a range of benefits in aggregation screening:
- Results are achieved in seconds.
- The analysis requires only a few parameters, irrespective of the analyte’s chemical composition. Only the viscosity and solvent refractive index are required and the DLS software offers these values for the most widespread buffers and solvents.
- Automated temperature ramping is supported by all three Wyatt batch DLS instruments.
- Volumes as low as 4 µL are required in the 1536- well plate and as low as 1.25 µL for the NanoStar quartz cuvette. The DynaPro Plate Reader has compatibility with standard well plates of 96, 384 and 1536 wells.
- In particular, the DPR enables high throughput measurements, with each analysis taken in as little as 10 seconds.
To estimate shelf life and evaluate stability, samples are normally stressed by thermal ramping, agitation, or freeze-thaw cycling. More detail about the relative concentrations of aggregates and oligomers and the size distribution can be provided by adding fractionation to the analysis.
In a study where formulation conditions of recombinant murine polyomavirus (MuPyV) were optimized, the virus was measured using TEM, batch DLS and FFF-MALS in a DynaPro Plate Reader both prior to and after the sample was exposed to an increased temperature of 48 °C for 1 hour.
In all three measurements, the naïve sample had the predicted radius of approximately 25 nm. The sample was centrifuged after heat stress and the supernatant was analyzed by FFF-MALS, which could not identify an observable quantity of material, either as aggregate or monomer.
After heat stress, material with no additional treatment (for example, no centrifugation) was also investigated by DLS and TEM. TEM identified several amorphous aggregates and DLS identified high overall scattered intensity and large (micron-sized) particles.
Fractionation usually exhibits higher resolution of molar mass distributions and/or size compared to a batch measurement like DLS. In this example, FFF-MALS did not identify any VLPs in the supernatant of the centrifuged sample as thermal stress precipitated the sample.
Dissimilar to FFF, it is not required to centrifuge the sample to protect a channel from fouling or clogging in a batch DLS study.
Batch DLS identified large particles that were evident in an uncentrifuged sample, with an estimated average Rh of 2300 nm7. The precipitate was identified at 100 seconds per measurement and using only 2 µg of sample.
A temperature ramp was carried out in the DPR in the same experiment to establish the ideal formulation conditions for thermal stability. This included the sampling of twenty-eight formulations. They comprised of different concentrations of trehalose or sucrose and the polyols sorbitol or mannitol, both with and without 0.5% polysorbate 20.
In an automated, single study, the condition that generated the highest Tagg was determined to be 40% sucrose or sorbitol, along with 0.5% polysorbate 20. The total sample amount employed in the study was less than 150 µg.
Zeta potential is critical for LNPs and nanocarriers
Zeta potential is an indicator of stability against aggregation in solution. It is one of the most critical indicators of the effective delivery of carrier nanoparticles to target tissues, along with the overall charge.
There seems to be an optimal charge for lipid nanoparticles specifically, which are frequently utilized to deliver mRNA. Some positive charge is necessary to decrease repulsion from the negatively charged nucleic acid cargo, in addition to facilitating localization to the negatively charged cell membrane, but too positive can be harmful5.
Though zeta potential is vitally important as a predictor of the stability of carrier nanoparticles, a more detailed picture can be achieved with the introduction of DLS to the analysis. In Figure 7, two LNP formulations were measured with a Mobius, which simultaneously calculates hydrodynamic radius (using DLS) and charge and zeta potential (utilizing ELS).
Presented on top are the raw mobility graphs from which zeta potential is established. Each with a zeta potential of ~-11 mV, the two graphs are almost identical.
On the bottom, the DLS results indicate the presence of aggregates in the LNP1 (red) sample and their absence in LNP2 (blue). Important further details are uncovered with the additional DLS detector, even though zeta potential is a good indicator of aggregation.
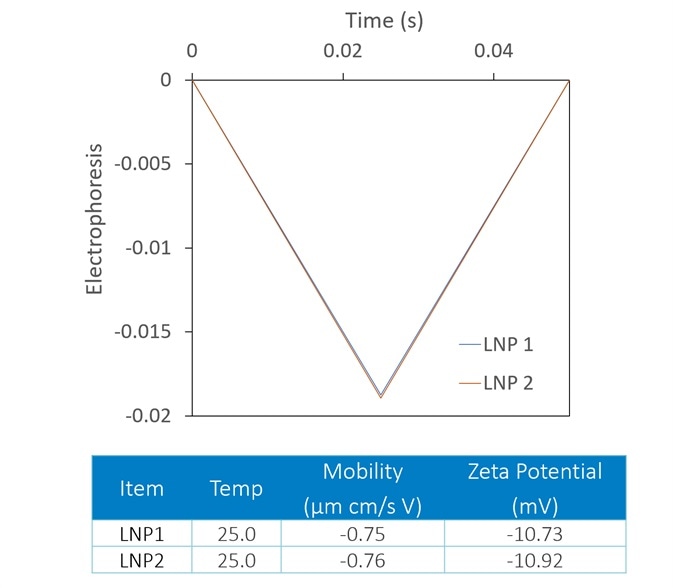
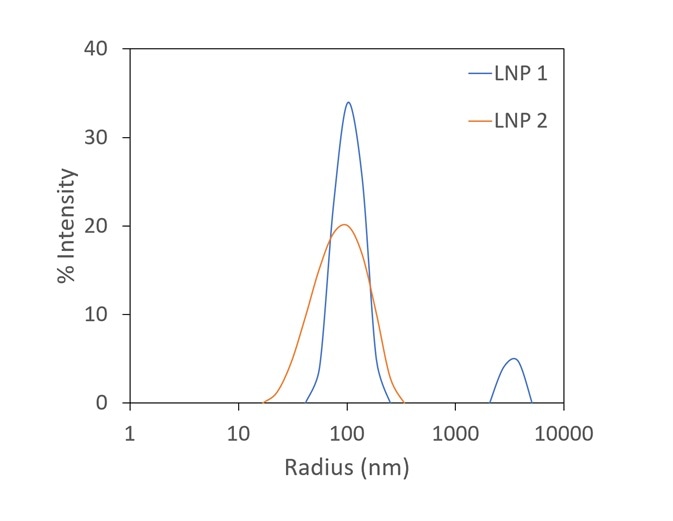
Figure 7. The Mobius measures zeta potential (top) and Rh (bottom) simultaneously. This allows distinction between two LNP samples that appear identical in terms of zeta potential; the DLS reveals trace aggregate in LNP1. Image Credit: Wyatt Technology
Real time MALS in process analytical technology
As outlined by the FDA, the aim of process analytical technology (PAT) in industrial processes is to produce an effective manufacturing system that compensates for variability to create a consistent product8.
The collection of data at relevant intervals is one of the criteria for this process. In this respect, the real-time tracking of key quality indicators, such as molar mass or size, produces a reproducible and streamlined process.
While similar to the DAWN regarding its measurement range, the ultraDAWN is created for live MALS (RTMALS) measurements. The OBSERVER™ software that accompanies it offers information on size, particle concentration and molar mass in real time.
The user outlines a suitable target range for either particle concentration, molar mass, or radius and the OBSERVER will create a trigger to indicate a process endpoint or automatically gather data within the specified range.
Figure 8 presents an example of virus purification. The viruses are predicted to be in the range of 85 to 105 nm, while smaller particles are related to different cellular components in the lysate like nucleic acids and inclusion bodies.
The sample that leaves the ion-exchange column is slipstreamed to the ultraDAWN and the OBSERVER software monitors real-time data, with a 22-second lag time from the exit of the chamber.
The light scattering intensity (relating to the sixth power of the radius and the product of particle concentration) is plotted in grey, while the radius is plotted in blue. The activations to stop and start collecting are highlighted by the red and green vertical lines, respectively.
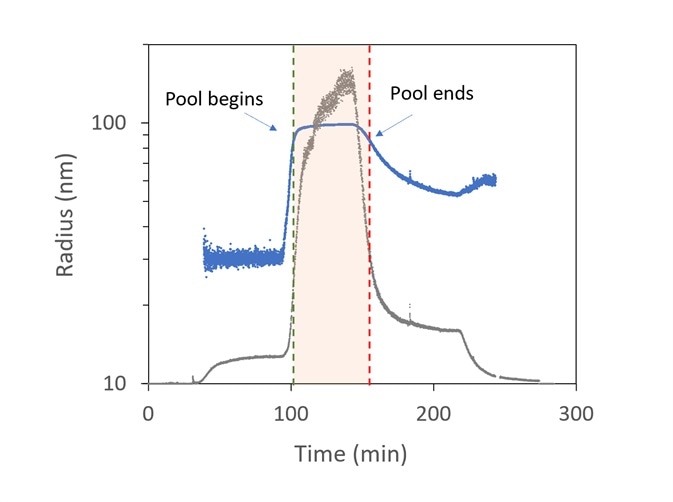
Figure 8. Trace of radius (blue) and light scattering intensity (grey) in OBSERVER software, measured by ultraDAWN, used to control collection of viral fractions during ion-exchange purification. Image Credit: Wyatt Technology
At approximately 100 minutes, the collection of virus fractions starts when R reaches 85 nm and halts at 150 min. Viral concentration is integrated during pooling to predict the total number of virions and average particle concentration in the pool.
Conclusions
Vaccines cover a wide range of molecular classes, with varying physicochemical characteristics. As they are all in the size range that can be analyzed by light scattering, ELS, MALS and DLS can provide information on crucial features and quality attributes such as aggregation, size, interactions, stability, conformation and composition.
Not only are the techniques described here employed in research, but several of these features are essential for quality control, production and validation of lot-to-lot reproducibility in regulatory settings. The tools in Wyatt’s light scattering toolkit, therefore enable rapid, safe and effective vaccine production and development.
References and further reading
- Hastie, K. M. et al. Structural basis for antibody-mediated neutralization of Lassa virus. Science 356, 923–928 (2017).
- Walls, A. C. et al. Glycan shield and epitope masking of a coronavirus spike protein observed by cryo-electron microscopy. Nat. Struct. Mol. Biol. 23, 899–905 (2016).
- Walls, A. C. et al. Unexpected Receptor Functional Mimicry Elucidates Activation of Coronavirus Fusion. Cell 176, 1026- 1039.e15 (2019).
- Citkowicz, A. et al. Characterization of virus-like particle assembly for DNA delivery using asymmetrical flow field-flow fractionation and light scattering. Anal. Biochem. 376, 163– 172 (2008).
- Reichmuth, A. M., Oberli, M. A., Jaklenec, A., Langer, R. & Blankschtein, D. mRNA vaccine delivery using lipid nanoparticles. Ther. Deliv. 7, 319–334 (2016).
- Wei, Z. et al. Biophysical characterization of influenza virus subpopulations using field flow fractionation and multiangle light scattering: Correlation of particle counts, size distribution and infectivity. J. Virol. Methods 144, 122–132 (2007).
- Mohr, J., Chuan, Y. P., Wu, Y., Lua, L. H. L. & Middelberg, A. P. J. Virus-like particle formulation optimization by miniaturized high-throughput screening. Methods 60, 248–256 (2013).
- Simon, L. L. et al. Assessment of Recent Process Analytical Technology (PAT) Trends: A Multiauthor Review. Org. Process Res. Dev. 19, 3–62 (2015).
Acknowledgments
Produced from materials originally authored by Camille Lawrence from Wyatt Technology.
About Wyatt

With a long history of excellence in scientific instrumentation, Wyatt Technology is the recognized leader in innovative light scattering instruments, accessories, software and services for determining the properties of macromolecules and nanoparticles in solution. Wyatt provides cutting-edge solutions for in-line multi-angle static light scattering (SEC-MALS), field-flow fractionation (FFF-MALS), composition gradients (CG-MALS), high-throughput and traditional dynamic light scattering (DLS), electrophoretic mobility via phase-analysis light scattering (MP-PALS), differential refractometry and differential viscosity. With a staff composed of 20% Ph.D. scientists and many more dedicated and experienced support personnel, Wyatt's aim is to delight the customer with the best products, training, customer support and service available in the industry.
Sponsored Content Policy: News-Medical.net publishes articles and related content that may be derived from sources where we have existing commercial relationships, provided such content adds value to the core editorial ethos of News-Medical.Net which is to educate and inform site visitors interested in medical research, science, medical devices and treatments.