Fourier-transform infrared spectroscopy, also known as FTIR spectroscopy, has made its mark as a very versatile technique of analysis with utility in a range of scientific research areas in different disciplines. One such area is the use of the Thermo Scientific™ Nicolet™ iS10 and Nicolet iS50 FTIR spectrometers, fitted with Attenuated Total Reflection (ATR)-FTIR and Transmission-FTIR, to analyze the secondary structure of various proteins. This was based on a database of protein structures along with spectral deconvolution, and resulted in a rapid and simple analysis.
Introduction
The term secondary structure refers to the way in which proteins and peptides gain repeated folds and kinks. These follow two main forms, the α-helix and the β-sheet, which are differentiated by the way in which hydrogen bonds are formed between amines and carbonyl groups on the peptides that compose the backbone of the protein. A better insight into the secondary structure of a protein will help to determine its stability and conformation under different conditions. For instance, finding how it changes with temperature is crucial in establishing criteria for safe storage of active protein drugs used in therapeutics. Such studies also help to clarify the relationship between the structure and the function of a protein as well as the enzyme kinetics of various proteins.
The use of FTIR has been established in this area because of the power it offers to explore both the secondary structure and the local changes in conformation of a protein. Usually, protein infrared (IR) spectroscopy shows nine amide bands and vibrations originating from both the peptides forming the backbone and the amino acid side chains. The Amide I and Amide II bands are particularly relevant in the formation of the secondary structure as they take part in hydrogen bonding between different parts and functional groups of the protein. These relate to spectral absorption occurring in association with C=O and N=H bond stretching respectively. As a result, their positions change with the composition of the secondary protein structure, with Amide II having a broader utility in quantifying the number of bonds in this structure.
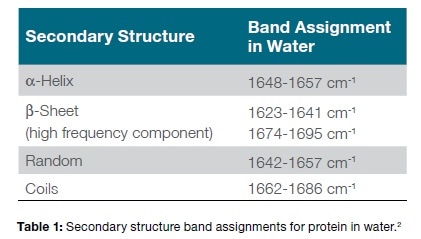
The Amide I band typically shifts less compared to the intrinsic band width, so that it displays a single broad peak rather than an array of different peaks with each of the secondary structure types. These band overlaps may be resolved by mathematical techniques such as Fourier deconvolution and second derivatives, to yield a quantitative analysis of the secondary structure, as shown in Table 1, which assigns bands for various secondary structure of different proteins in water. Each of these band assignments is rather a range of values as the peaks vary in position between proteins with the differences in interactions between various hydrogen bonds as well as the environment.
FTIR also offers several sampling techniques such as ATR, transmission and infrared reflection absorption spectroscopy (IRRAS) which makes it extremely adaptable to a range of applications, giving it a great advantage over other analytical techniques for this area. The protein samples used for FTIR may be in the form of aqueous solutions, colloids or lyophilized powders, as well as other forms.
The present article describes two determinations of protein secondary structure using transmission-FTIR and ATR respectively, both of which give quick results, using only very small amounts of sample, and without significant preparation of the sample being required.
Experimental materials and methods
The proteins used in this experiment were obtained from Sigma-Aldrich (MO, USA) and no additional preparation of the sample was done. A BioCell™ Calcium Fluoride Cell (Biotools, Jupiter, FL) was used for the transmission measurements, which were performed at room temperature. A 10 µL sample of protein solution was placed between two windows containing CaF2, in the center of the window, and the whole was put into the holder. The protein concentration showed as being between 6 and 12 mg/mL. The two CaF2 windows were sandwiched to create a path length of 6 µm, since such windows are useful for the analysis of water-based samples. Water has peak absorption at the 1645 cm-1 region, which means that using such a small path length precludes the occurrence of saturated water peaks successfully.
The instrument used for transmission analysis was a purged Nicolet iS10 FTIR spectrometer, equipped with a DTGS detector, using a 256-scan parameter at 4 cm-1 resolution. The device was fitted with an accessory, the Thermo Scientific™ Smart OMNI-Sampler™ Transmission Accessory, which helps achieve a rapid chamber purge without having to subtract water vapor during the analysis in most cases. Once the buffer-subtracted spectra were acquired, the analysis of the secondary protein structure was performed with the PROTA-3S™FT-IR Protein Structure Analysis Software with which the device is equipped, which utilizes a database of 47 secondary structures.
The ATR analysis employed a ConcentratIR2™ Multiple Reflection ATR Accessory (Harrick Scientific Products, Inc. Pleasantville, NY) which uses a diamond crystal, fitted into a Nicolet iS50 FTIR spectrometer that has a mercuric cadmium telluride (MCT) detector. The diamond crystal gives the ATR accessory the benefit of 10 internal reflections with the nominal angle of incidence being 450 while the crystal surface is coated with the protein sample by running a stream of nitrogen over the 10 µL sample in phosphate buffer on the crystal to dry it out. The scan used a resolution of 4 cm-1 over 256 scans, and the peak resolve feature of the OMNIC software was used to perform the analysis of the secondary structure.
Results and discussion
The Biocell transmission-FTIR
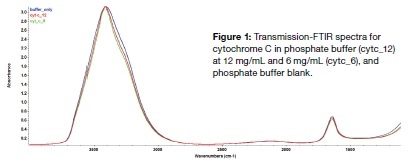
The three overlaid FTIR spectra produced are depicted in Figure 1, consisting of the phosphate buffer, the cytochrome C in phosphate buffer at 6 mg/mL and 12 mg/mL respectively. The initial impression is that water bands are most prominent, and all the three appear very similar even when the solution contains as much as 12 mg/mL.
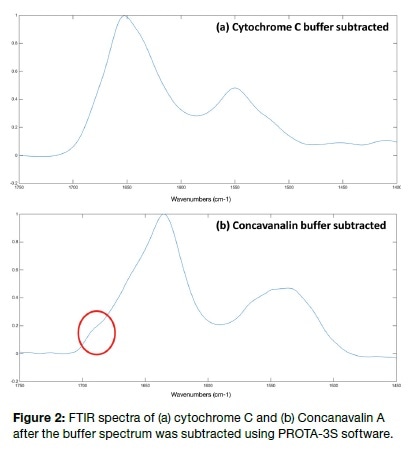
The PROTA-3S software was then used to subtract the phosphate buffer spectrum from the raw protein spectra, yielding two spectra shown in Figure 2A, for cytochrome C, and Figure 2B, of concanavalin. Both spectra are noticeable for the clear Amide I and II peaks, the first corresponding to an α-helix dominant protein secondary structure at 1654 cm-1 and for concanavalin A, the two peaks at 1633 cm-1 and 1690 cm-1 (which is actually a shoulder peak as marked by the red circle) showing a β-sheet contribution with the linked high-frequency component.
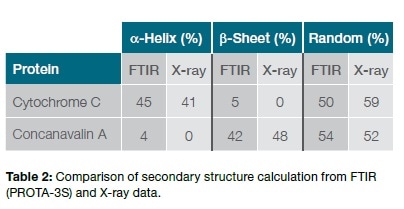
The results of the prediction of the protein structure by the PROTA-3S software shows that cytochrome C is made up of 45% α-helix with 5% having a β-sheet structure, while the corresponding percentages for Concanavalin A are 4% and 42% respectively. The data acquired by X-ray and FTIR techniques are different for several reasons, such as the various physicochemical parameters that were non-identical in the two settings: crystalline state vs solution, different temperatures, pH variation, different buffer conditions and the like. Another factor is the use of different algorithms to analyze and predict the secondary structure, which could lead to small changes in the output. Taking the broad picture, however, the fact remains that two different techniques, with different sample states and algorithms, nonetheless revealed a largely similar secondary structure for both the protein samples. We may therefore conclude that transmission-FTIR measurements may be successfully analyzed by the PROTA-3S software to yield a reliable prediction of secondary structure of proteins in solution with rapidity and convenience, while not requiring much sample preparation.
ATR-FTIR with ConcentrateIR Accessory
This method becomes more suitable when the protein sample is extremely small or low concentrations of protein are present. The ConcentratIR2 ATR accessory is meant to measure protein directly, whether in the form of a powder, gel, solution or even after drying on the surface of the ATR. One precaution to be observed when using the last method is selecting the right buffer, since both the protein and the buffer will concentrate on the crystal surface while drying.
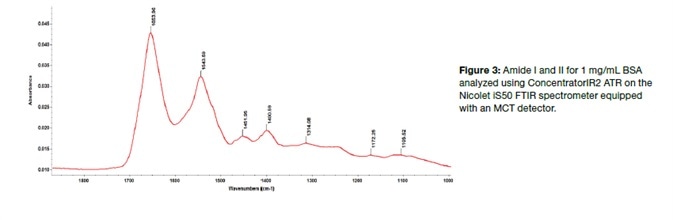
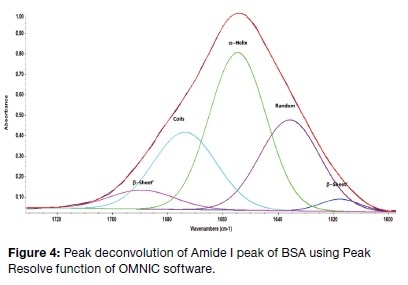
It is advised that for optimum results, buffer selection should include only those which do not show peaks in the Amide I or II regions of the spectra. This is illustrated in Figure 3, depicting the ATR-FTIR spectra of BSA in a phosphate buffer. The 1 mg/mL solution was dried on the crystal surface. The resulting spectra show both Amide I and II bands but also spectra originating in the various side chains, such as the tyrosine-induced peak at 1515 cm-1 and the peak at 1498 cm-1 due to aspartic acid. This is a key indicator of how various amino acids are found within the protein, in protonated or deprotonated states.
The Amide I peak of BSA was subjected to peak deconvolution using the OMNIC software, though very often a second derivative analysis is carried out before this step to distinguish which peaks must be included in peak fitting. In the present experiment, this second derivative study showed peaks that fitted the peaks shown in Table 1, corresponding to the secondary structure (though these peaks are not depicted in this article). Following this, baseline correction of the Amide I region was additionally performed to optimize the shape of the peak for peak fitting, and this also removed any possible peak component from the Amide II area. Peak deconvolution led to the observation of five peaks. The area under each of these was compared to the whole area. The result was the depiction of a secondary structure composed of 47% α-helix, 3% β-sheet, 24% coils, and 26% random. This agrees well with already published data on FTIR and X-ray evaluation of this compound.
Conclusion
This experiment shows that protein secondary structure was easily and correctly established using FTIR spectroscopy, which yielded transmission-FTIR measurements that were then analyzed by the PROTA-3S software. This is then a quick and convenient way to study the secondary structure of proteins in solution without prior significant sample preparation. ATR-FTIR studies are more appropriate for finding the secondary structure composition of protein in limited quantity and low concentration, as the protein is dried directly on the ATR crystals first.
References and Further Reading
- Elliott, A., Ambrose, E. J. Structure of synthetic polypeptides, Nature (1950) 165, 921-922.
- Jackson, M., Mantsch, H.H. The use and misuse of FTIR spectroscopy in the determination of protein structure, Crit. Rev. Biochem. Mol. Biol. (1995) 30, 95-120.
- Barth, A. Infrared spectroscopy of proteins, Biochim. Biophys. Acta (2007) 1767, 1073-1101.
- Byler, D.M., Susi, H. Examination of the secondary structure of proteins by deconvolved FTIR spectra, Biopolymers (1986) 25, 469-487.
- Surewicz, W.K., Mantsch, H.H. New insight into protein secondary structure from resolution-enhanced infrared spectra, Biochim. Biophys. Acta (1988) 952, 115-130.
- Sukumaran, S., Hauser, K., Maier, E., Benz, R., Mantele, W. Tracking the unfolding and refolding pathways of outer membrane protein porin from Paracoccus denitrificans, Biochemistry (2006) 45, 3972–3980.
- Klose, D., Janes R.W. 2Struc – the protein secondary structure analysis server, Biophysical Journal (2010) 98, 454-455.
About Thermo Fisher Scientific – Materials & Structural Analysis
 Thermo Fisher Materials and Structural Analysis products give you outstanding capabilities in materials science research and development. Driving innovation and productivity, their portfolio of scientific instruments enable the design, characterization and lab-to-production scale of materials used throughout industry.
Sponsored Content Policy: News-Medical.net publishes articles and related content that may be derived from sources where we have existing commercial relationships, provided such content adds value to the core editorial ethos of News-Medical.Net which is to educate and inform site visitors interested in medical research, science, medical devices and treatments.