Monoclonal antibodies (mAbs) are highly specific proteins that can recognize and bind to antigens and pathogens, such as viruses and bacteria, enabling their rapid detection through assays such as immunofluorescence and ELISA.
Beyond diagnostics, mAbs have a crucial role in oncology as they can identify tumor-associated antigens and support early cancer screening.
As therapeutics, monoclonal antibodies target tumor cells directly. For example, Rituximab binds CD20 on B-cell lymphoma cells, which catalyzes immune-mediated clearance. Antibodies can also be conjugated to radionuclides and chemotherapeutic agents to create antibody-drug conjugates (ADCs), which deliver cytotoxic payloads to tumor cells while reducing any off-target effects.
During formulation, monoclonal antibody solutions often contain dimers, trimers, and higher-order aggregates. These species pose safety concerns because they can increase immunogenicity upon administration. As a result, the accurate quantification of oligomers and aggregates is crucial for formulation development, quality control, and aggregate characterization.
Experimental section
This study used a size-exclusion chromatography (SEC) system equipped with light-scattering (LS) and refractive-index (RI) detectors. The chosen LS detector was the BeSEC LS2 from Bettersize Instruments, which has detection angles of 90 ° and 7 °. The BeSEC workstation integrated light scattering with UV or RI signals to calculate molecular weight distributions and averages, including Mn, Mw, and Mz.
System configuration:
- Detectors: Light Scattering (LS) + RI
- Column: Shodex PROTEIN LW-803
- Mobile phase: Phosphate-buffered saline (PBS)
- Flow rate: 0.7 mL/min
- Injection volume: 100 μL
- Column temperature: 40 ℃
- dn/dc: 0.185 mL/g
Sample preparation:
Three monoclonal antibody samples (A, B, and C) were prepared for analysis. The samples were each weighed, dissolved in PBS to a concentration of 2-5 mg/mL, stirred until completely transparent, and filtered through a 0.22 μm PES syringe filter.
The filtered solutions were transferred into autosampler vials for the SEC injection.
Results and discussion
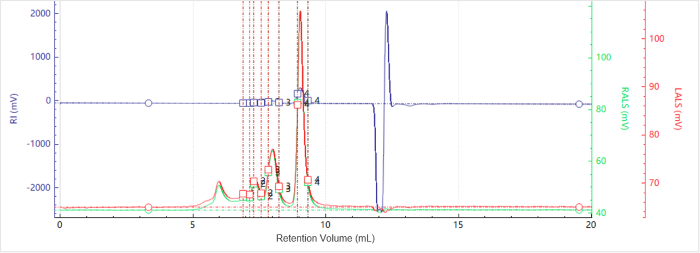
Figure 1. Elution profiles of the multi-detector signals for Sample A. Image Credit: Bettersize Instruments
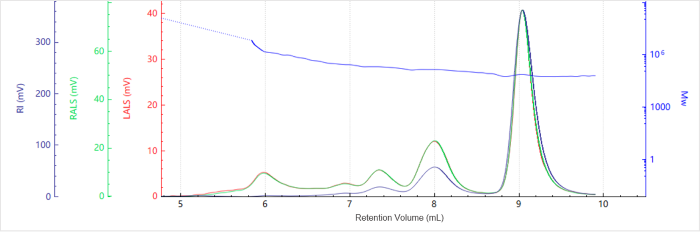
Figure 2. Elution profile of the molecular weight for Sample A. Image Credit: Bettersize Instruments
Figure 1 shows the elution profiles of the multi-detector signals for Sample A, while Figure 2 shows the corresponding molecular weight distribution.
The light-scattering signals at 90° and 7°, along with the RI trace, reveal multiple distinct peaks, suggesting that the sample contains multiple aggregation states.
The molecular weight of each species was calculated using peak-based integration, as summarized in Table 1. The elution volume versus molecular weight plot shows that as elution volume increases, molecular weight decreases.
This is consistent with the SEC separation principle, in which smaller species elute later than larger ones. Each peak shows a molecular weight plateau, which reflects the comparatively narrow molecular weight distribution of the individual oligomeric states within the protein sample.
Table 1. Molecular weight results for peaks in Sample A. Source: Bettersize Instruments
| Peak |
Mw (Da) |
Ratio of Peak n/Peak 1 |
Area (%) |
| Peak 1 |
149776 |
1 |
75.8 |
| Peak 2 |
295157 |
1.97 |
17.4 |
| Peak 3 |
450351 |
3 |
3.8 |
The molecular weight of Peak 1 was approximately 150 kDa, compatible with the theoretical value of a monoclonal antibody monomer. Peaks 2 and 3 scaled as clean multiples of Peak 1, correlating to the dimeric and trimeric species.
Quantitative analysis showed that the monomer accounted for 75.80 % of the total protein, while aggregated species collectively made up more than 5 %. For therapeutic applications involving injection, these aggregates are particularly concerning, as they could increase immunogenic risk and compromise product safety.
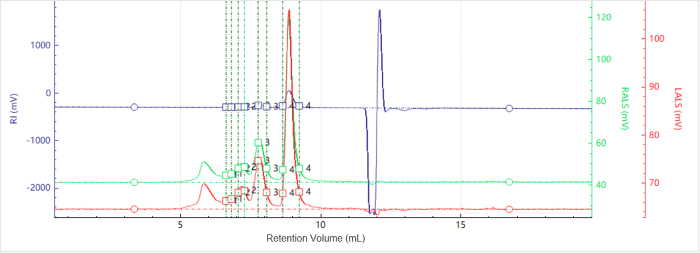
Figure 3. Elution profiles of the multi-detector signals for Sample B. Image Credit: Bettersize Instruments
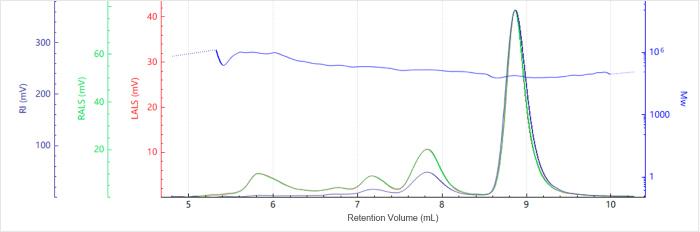
Figure 4. Elution profile of the molecular weight for Sample B. Image Credit: Bettersize Instruments
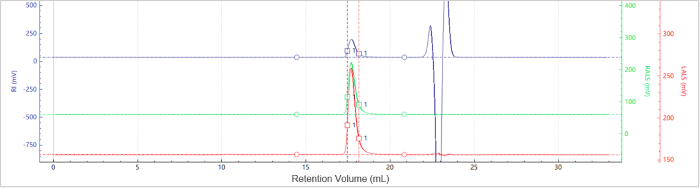
Figure 5. Elution profiles of the multi-detector signals for Sample C. Image Credit: Bettersize Instruments
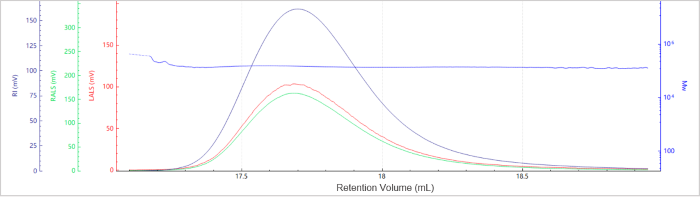
Figure 6. Elution profile of the molecular weight for Sample C. Image Credit: Bettersize Instruments
Figures 3 and 4 show the chromatogram and molecular weight profile of Sample B. A smaller peak is also seen with an earlier elution time. This suggests that higher-order aggregates were present.
Figures 5 and 6 present the chromatogram and molecular weight profile for Sample C, which exhibits a single dominant peak, suggesting minimal aggregation.
Table 2. Molecular weight results for peaks in Sample B. Source: Bettersize Instruments
| Peak |
Mw (Da) |
Ratio of Peak n/Peak 2 |
Area (%) |
| Peak 1 |
298048 |
1.97 |
1.34 |
| Peak 2 |
151546 |
1 |
98.6 |
Table 3. Molecular weight results for peaks in Sample C. Source: Bettersize Instruments
| Peak |
Mw (Da) |
Ratio of Peak n/Peak 2 |
Area (%) |
| Peak 1 |
147709 |
1 |
100 |
Table 2 shows that, in addition to the primary monomer peak, sample B also contains a dimer. The dimer’s molecular weight is approximately twice that of the monomer, and its relative abundance is low at just 1.34 %, suggestive of a low level of aggregation.
In contrast, Table 3 shows that Sample C only contains the main peak, with no detectable oligomers or higher-order aggregates. This profile reflects exceptional structural integrity and suggests that Sample C is more stable than the other tested formulations.
Conclusion
This article has detailed how the BeSEC LS2 detector was used to measure the molecular weights of monoclonal antibody samples.
The presence of aggregates in biopharmaceuticals may substantially impact patient safety and therapeutic performance, as large aggregates could trigger immune responses. Therefore, understanding the type and level of aggregates that are present in monoclonal antibody formulations is crucial.
The BeSEC system demonstrates that static light scattering can effectively resolve monomer, dimer, and higher-order species and quantify their content. This is a valuable ability for the development, stability assessment, and quality assurance of biological drugs.
Acknowledgments
Produced using materials originally created by Zhibin Guo from Bettersize Instruments.
About Bettersize Instruments 
With over 29 years of experience, Bettersize Instruments has established itself as a leading global manufacturer of analytical instruments for particle analysis. Quality is core to our business - we carry out 95 % in-house production for strict quality control.
Our mission is to empower our customers worldwide with best-in-class instruments, comprehensive solutions, and exceptional customer service. We are dedicated to helping scientists, researchers, and engineers gain deeper insights into material properties to facilitate R&D and improve production efficiency.
We are proud to have 95 patents and serve over 17,000 organizations across 92 countries and industries, including pharmaceuticals, battery materials, chemicals, coatings, mining, and more. We invest 15 % of annual revenue in R&D to continuously improve the performance of existing instruments while driving relentless innovation to ensure precise measurement results.
In 2023, we opened a new facility in Costa Mesa, California, to provide real-time support and improve product delivery for our North American customers. This facility allows us to work more closely with local material scientists, researchers, and engineers to optimize their materials analysis.
Our Main Product Series:
- BeNano Series: Nanoparticle size and zeta potential analysis by three light scattering techniques;
- Bettersizer Series: Particle sizing by laser diffraction technology with built-in dry/wet dispersion systems;
- BeVision Series: Particle size and shape analysis by dynamic/static image analysis technologies;
- BeDensi Series: Tapped and bulk density, flowability, and angle of repose measurement;
- PowderPro Series: 14-in-1 automatic powder characteristics tester;
- BetterPyc 380: Automatic gas pycnometer for volume, true density, solid content, and open cell content measurement.
International qualifications:
All Bettersize instruments have passed ISO9001 international quality management system certification and the European CE certification. Laser particle analyzers obtained the approval of 21 CFR Chapter I Subchapter J, Part 1040.10 and 1040.11.
The software complies with the FDA 21 CFR Part 11 regulation, ensuring the validity and reliability of the results and compliance with regulatory requirements.
Services and support:
1. Online Store: Hassle-free ordering of our BeDensi Series.
2. Free Sample Testing: Up to 3 free sample tests for particle size, particle shape, zeta potential, molecular weight, and powder characteristics.
3. Complete Pre-sale and After-sales Service System: Timely response to product inquiries, 2-3 years warranty, free installation and debugging, free software upgrade, spare parts supply, and more;
4. Knowledge Hub: Get free product brochures, application notes, industry solutions, guidebook whitepaper, and more;
5. Training Conference: Expert-led sessions for product training and sales strategy.
Sponsored Content Policy: News-Medical.net publishes articles and related content that may be derived from sources where we have existing commercial relationships, provided such content adds value to the core editorial ethos of News-Medical.net, which is to educate and inform site visitors interested in medical research, science, medical devices, and treatments.