The NanoDrop™ Ultra Microvolume UV-Vis spectrophotometer and fluorometers from Thermo Scientific™ leverage Thermo Scientific™ Acclaro™ Sample Intelligence Technology.
This technology features powerful contaminant identification (ID) functionality, allowing its users to detect the presence of common contaminants in protein and nucleic acid samples.
The A260/A230 and A260/A280 nucleic acid purity ratios have historically served as the primary resource for quantifying sample purity. Table 1 lists the acceptable purity ratio ranges for ‘pure’ nucleic acids.
Purity ratios may fall within the ‘pure’ range even when a contaminant is present, however, introducing significant concerns, as undetected contaminants will artificially inflate sample concentration, leading to failures in downstream reactions.
Table 1. Acceptable purity ratio ranges for “pure” nucleic acids using a blank and sample buffer at the same pH and ionic strength. Source: Thermo Fisher Scientific - UV-Vis Spectroscopy
| Nucleic acid |
A260/A280 |
A260/A230 |
| DNA |
∼1.8 |
1.8–2.2 |
| RNA |
∼2.0 |
1.8–2.2 |
The NanoDrop Ultra instrument’s built-in Acclaro contaminant ID feature analyzes individual sample spectra using chemometric algorithms and a reference spectral library to circumvent this limitation of purity ratios.
This software technology can make predictions on the existence of contaminants and the amount of contaminant present, providing users with a corrected sample concentration (Figure 1).
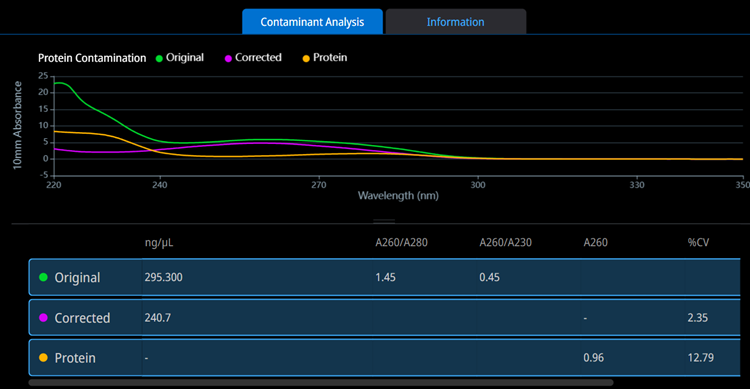
Figure 1. Acclaro Contaminant ID feature identified protein as a contaminant in a dsDNA preparation. The original, uncorrected spectrum is in green, the corrected spectrum is in purple, and the contaminant spectrum is in orange. Image Credit: Thermo Fisher Scientific - UV-Vis Spectroscopy
A number of contaminants can be identified in the dsDNA application using the Thermo Scientific™ Acclaro™ technology. Samples must fall within a certain concentration range; for example, protein and phenol detection depends on dsDNA samples being within 25–3125 ng/µL to ensure accurate prediction by the Acclaro technology (Table 2).
Table 2. Contaminants detected using the dsDNA, RNA, and Protein A280 applications with their associated sample concentration ranges. Source: Thermo Fisher Scientific - UV-Vis Spectroscopy
| Application |
Detected contaminants |
Sample concentration |
| dsDNA |
Protein, phenol |
0.5 A–62.5 A
25–3125 ng/μL |
| |
Mammal, bacteria, plant RNA |
1.0 A–20 A
50–1000 ng/μL |
| RNA |
Protein, phenol, guanidine isothiocyanate |
0.5 A–62.5 A
20–2500 ng/μL |
| |
Mammal, bacteria, plant DNA |
1.0 A–20 A
40–800 ng/μL |
| Protein A280 |
DNA |
All concentrations |
Experimental procedures
Table 3 shows the final concentrations of created mixtures of dsDNA, protein, and phenol. These were prepared as follows:
- dsDNA was prepared by diluting Invitrogen™ UltraPure™ Calf Thymus DNA Solution (Invitrogen, 15633019)
- Protein was prepared from a bovine serum albumin solution (BSA, Sigma Aldrich, A7284)
- Phenol was prepared from a buffer-saturated stock (Fisher BioReagents, BP1750I)
All mixtures were diluted in Tris-EDTA (TE) buffer, pH 7.5. This was used as the blank when performing measurements with the NanoDrop spectrophotometer.
Table 3. A. Final concentrations of phenol and dsDNA mixtures. B. Final concentrations of protein and dsDNA mixtures. Source: Thermo Fisher Scientific - UV-Vis Spectroscopy
| A |
Mixture # |
1 |
2 |
3 |
4 |
5 |
6 |
7 |
| Phenol (ppm) |
1200 |
800 |
400 |
100 |
80 |
60 |
30 |
| dsDNA (ng/μL) |
250 |
250 |
250 |
250 |
250 |
250 |
250 |
| B |
Mixture # |
1 |
2 |
3 |
4 |
5 |
6 |
| Protein (mg/mL) |
10 |
4 |
2 |
0.75 |
0.5 |
0.25 |
| dsDNA (ng/μL) |
250 |
250 |
250 |
250 |
250 |
250 |
A NanoDrop™ OneC Spectrophotometer from Thermo Scientific™ was used as a control instrument to compare results acquired using the NanoDrop Ultra.
Fresh 2.0 µL measurements were performed using both instruments. The Acclaro Contaminant ID feature is automatically enabled for both models, so this was performed using the microvolume pedestal in replicates of five with the dsDNA application.
Results
Automatic calculations of both the original and corrected dsDNA concentrations are included in the experiment report. Average and standard deviations for each mixture were calculated independently of the software, as well as average purity ratios (A260/A280 and A260/A230) (Table 4).
It was observed that the Acclaro Contaminant ID feature could correctly identify the presence of contaminating protein in a dsDNA sample. This was possible down to 0.5 mg/mL of protein or 2.5% (v/v) protein in the mixture.
The Acclaro technology also correctly identified phenol contamination down to 60 ppm or 1.2% (v/v) phenol in the mixture.
Both the protein and phenol sample sets exhibited standard deviations of 5.5 ng/µL or less, indicating excellent reproducibility in the instrument’s ability to calculate corrected dsDNA concentration.
Table 4. The original and corrected dsDNA concentrations from the NanoDrop Ultra instrument were averaged from five replicates. Standard deviation was reported for the corrected dsDNA concentration replicates unless marked as Original in the table, for which the standard deviation of the original dsDNA concentration was reported. The Acclaro Contaminant ID icon ( ) indicates the software identified a sample contaminant. Source: Thermo Fisher Scientific - UV-Vis Spectroscopy
| |
Protein contamination |
Phenol contamination |
dsDNA
control |
Contaminant
content |
10 mg/mL |
4 mg/mL |
2 mg/mL |
0.75 mg/mL |
0.5 mg/mL |
0.25 mg/mL |
1200 ppm |
800 ppm |
400 ppm |
100 ppm |
80 ppm |
60 ppm |
30 ppm |
- |
Original dsDNA
concentration
(ng/μL) |
460.0 |
345.4 |
294.6 |
280.8 |
264.9 |
267.5 |
702.1 |
563.3 |
401.0 |
303.8 |
292.1 |
285.0 |
271.9 |
254.8 |
Corrected dsDNA
concentration
(ng/μL) |
293.1 |
267.7 |
240.0 |
259.3 |
250.2 |
- |
278.7 |
274.3 |
256.3 |
264.5 |
274.9 |
259.2 |
- |
- |
Standard deviation of
corrected dsDNA
concentration
(ng/μL) |
1.1 |
5.5 |
0.7 |
0.5 |
0.9 |
0.7
(Original) |
5.2 |
1.8 |
0.9 |
0.4 |
1.1 |
0.5 |
1.0
(Original) |
0.4
(Original) |
| A260/A280 purity ratio |
0.87 |
1.26 |
1.46 |
1.68 |
1.74 |
1.82 |
1.65 |
1.86 |
1.79 |
1.83 |
1.83 |
1.84 |
1.85 |
1.87 |
| A260/A230 purity ratio |
0.41 |
0.30 |
0.45 |
0.85 |
1.06 |
1.49 |
1.97 |
2.15 |
2.16 |
2.26 |
2.27 |
2.29 |
2.31 |
2.34 |
| Acclaro flag |
|
|
|
|
|
No |
|
|
|
|
|
|
No |
No |
It was also observed that purity ratios for the phenol-contamination samples predominantly fell within the acceptable range (Table 1). These results highlight the importance of leveraging the Acclaro contaminant ID feature in identifying contaminants that may not necessarily affect purity ratios.
Figure 2 outlines the corrected dsDNA concentration’s percent error from the NanoDrop Ultra instrument versus the theoretical concentration for each sample.
All corrected concentrations were found to be within the Acclaro Contaminant ID technology’s 20% error limit, with the greatest error found to be 17.2% for the highest concentration of protein contamination (10 mg/mL).
The majority of samples exhibited less than 10% error from the theoretical concentration, confirming the accuracy of the corrected dsDNA concentration.
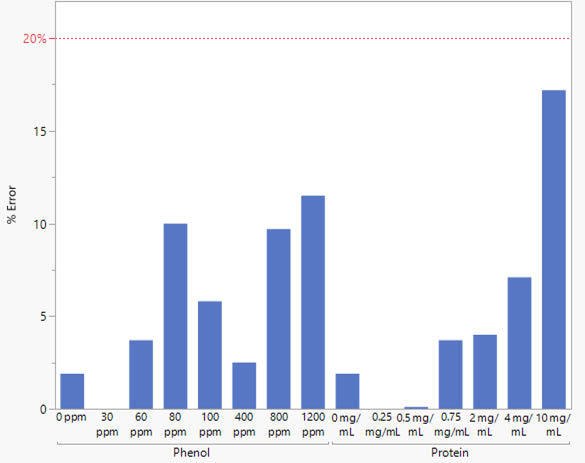
Figure 2. Percent error of the corrected dsDNA concentration from the NanoDrop Ultra instrument compared to the theoretical concentration. The red, dashed line denotes the 20% error limit of the Acclaro Contaminant ID feature. Bars are absent from the 30 ppm and 0.25 mg/mL samples as they were not flagged by Acclaro technology. Zero ppm and mg/mL represent the control dsDNA sample using the original concentration. Image Credit: Thermo Fisher Scientific - UV-Vis Spectroscopy
Figure 3 outlines a comparison of the original, uncorrected concentrations alongside the Acclaro-corrected concentrations.
Uncorrected concentrations increased with protein and phenol concentrations, highlighting the effect of contamination on dsDNA concentration. The corrected concentrations remained within the ±20% error limit after using the Acclaro technology to subtract contaminants from the UV spectrum.
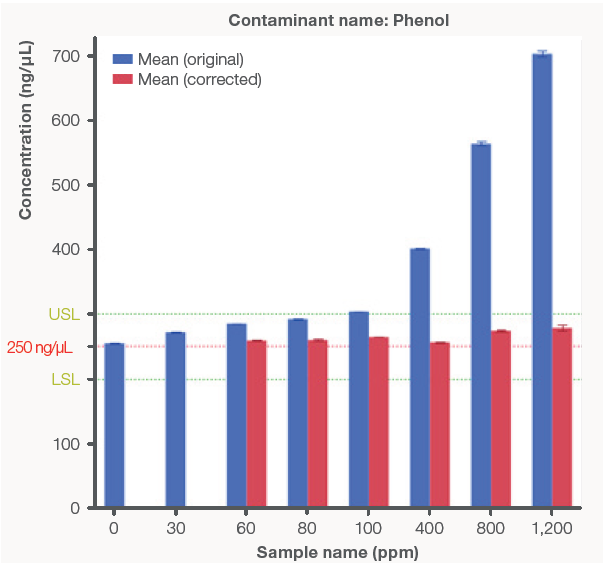
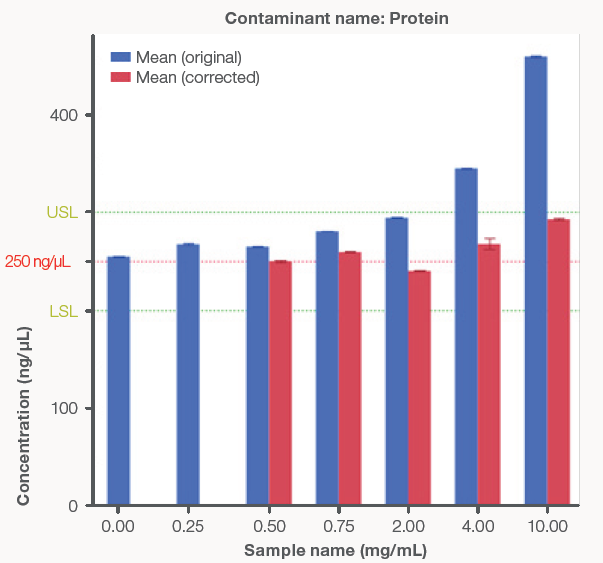
Figure 3. Bar graphs comparing the original, uncorrected dsDNA concentrations (blue bars) to the Acclaro-corrected concentrations (red bars) from the NanoDrop Ultra instrument. The red line represents the theoretical dsDNA concentration of 250 ng/μL, and the green lines represent ±20% error from the theoretical concentration to account for the Acclaro Contaminant ID algorithm error. Zero ppm and mg/mL represent the control dsDNA sample using the original concentration. A) Phenol-contaminated samples. B) Protein-contaminated samples. Error bars represent ± one standard deviation from the mean. Image Credit: Thermo Fisher Scientific - UV-Vis Spectroscopy
Figure 4 contrasts the Acclaro-corrected dsDNA concentrations with the NanoDrop OneC and NanoDrop Ultra spectrophotometers.
The NanoDrop Ultra software was able to calculate a corrected concentration for three samples (60 ppm, 0.5 mg/mL, and 0.75 mg/mL), but the NanoDrop OneC software was not able to achieve this.
This sensitivity ensures the accurate reporting of low contaminant concentrations by the Acclaro technology on the NanoDrop Ultra instrument.
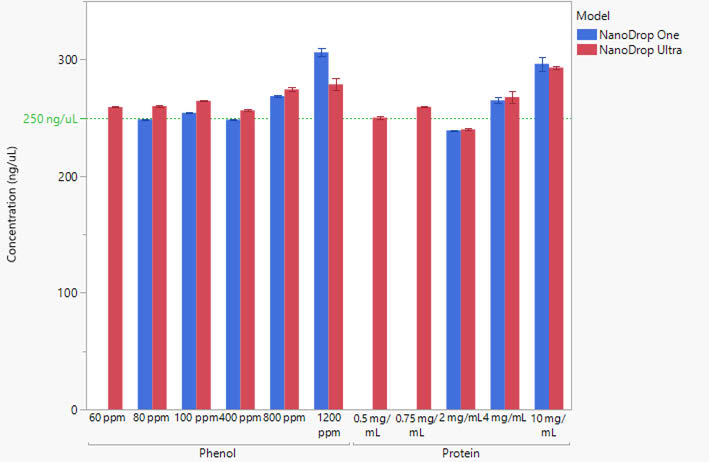
Figure 4. Comparison of Acclaro-corrected concentrations reported by the NanoDrop OneC (blue bars) and NanoDrop Ultra (red bars) spectrophotometers. The Acclaro technology on the NanoDrop OneC instrument did not flag a contaminant for samples without blue bars. The green line represents the theoretical concentration of 250 ng/μL. Error bars represent ± one standard deviation from the mean. Image Credit: Thermo Fisher Scientific - UV-Vis Spectroscopy
Conclusions
Nucleic acid purity ratios have historically offered the most useful indication of sample purity.
Salts, proteins, buffers, polysaccharides, and other contaminants can affect purity ratios in ways similar to one another, however, making it especially challenging to identify and quantify a contaminant based only on these ratios.
The Acclaro Sample Intelligence contaminant ID technology employs contaminant spectral libraries and chemometric algorithms to overcome this limitation, analyzing subtle changes in the sample spectrum and offering predictions on the presence of contaminants.
The NanoDrop Ultra spectrophotometer was able to correctly identify protein and phenol contamination down to 2.5% (v/v) and 1.2% (v/v), respectively. The instrument achieved a mean corrected concentration percent error of 6.8% versus theoretical.
This feature offers critical insights into purification protocols and the introduction of contaminants at specific steps, enabling adjustments to protocols that will better avoid failed downstream reactions.
The NanoDrop Ultra instrument’s built-in Acclaro technology makes it a useful tool for any life science laboratory, eliminating the guesswork from troubleshooting the presence of contaminants.
About Thermo Fisher Scientific - UV-Vis Spectroscopy
UV-Vis Spectrometers overview
Scientists can count on our broad range of ultraviolet (UV) and visible (Vis) spectrophotometers to deliver reliable, accurate data. The Thermo Scientific SPECTRONIC 200, GENESYS, and Evolution product lines are designed to streamline measurements, providing consistent, high-quality results, time after time. Additionally, the innovative Thermo Scientific NanoDrop microvolume family of instruments has been helping scientists accelerate the pace of discovery for over 20 years. From classroom teaching to routine measurements to discovery of the next scientific breakthrough, our line of spectrophotometers is designed to fit into any modern laboratory.
Sponsored Content Policy: News-Medical.net publishes articles and related content that may be derived from sources where we have existing commercial relationships, provided such content adds value to the core editorial ethos of News-Medical.net, which is to educate and inform site visitors interested in medical research, science, medical devices and treatments.