Thermo Scientific™ NanoDrop™ Ultra Microvolume UV-Vis spectrophotometers and fluorometers measure nucleic acid and protein samples in 1–2 µL volumes, providing accurate information on quality and quantity.
UV-Vis spectrophotometry is a reliable analytical technique in biopharmaceutical manufacturing facilities, serving as an important quality control checkpoint.
For cuvette-based spectrophotometric measurements, this checkpoint may require several repeated dilutions to reach an absorbance within the instrument's dynamic range, incurring undesirable inaccuracies.
Biologics production frequently yields highly concentrated solutions, making serial dilutions a routine and time-consuming step in the workflow.
The Thermo Scientific™ Acclaro™ Pro software, an optional add-on for NanoDrop Ultra instrument models, improves sample quantification accuracy via its sophisticated algorithm.
Acclaro Pro software accurately measures biomolecule concentrations up to 550 absorbance units (10 mm equivalent), 400 g/L IgG, and 18,150 ng/µL ssDNA with a ±5% inaccuracy.
To guarantee optimal yield and purity in monoclonal antibody (mAb) treatments, precise protein concentration is required at numerous stages. Validated protein concentrations are critical for loading chromatography columns correctly, evaluating process efficiency, and reducing end product instability.
The Acclaro Pro software provides extraordinarily accurate concentration readings in less than 30 seconds per measurement, eliminating the need for costly consumables or dilutions.
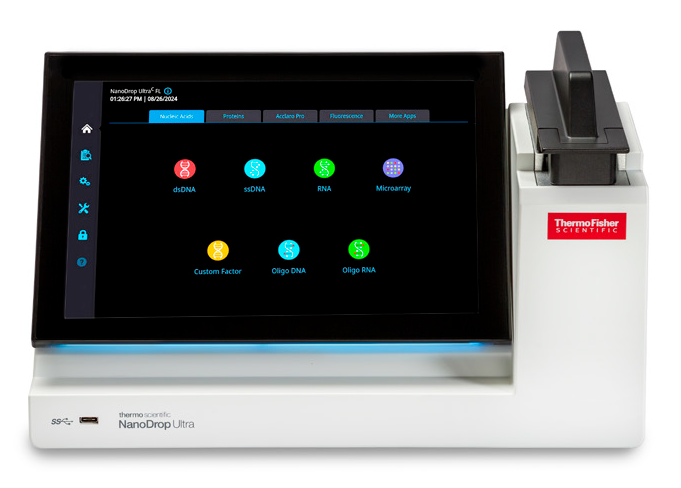
Image Credit: Thermo Fisher Scientific - UV-Vis Spectroscopy
Method
A thorough mAb downstream purification train was carried out using various chromatography and filtration technologies. Aliquots were set aside at each stage for spectrophotometric examination, and the sample names are listed in Table 1.
The Thermo Scientific™ DynaChrom™ Chromatography System was used for all chromatography and filtration procedures in the downstream train, except for the ultrafiltration and diafiltration (UF/DF) unit operation.
The MabCaptureC™ Affinity Resin (Thermo Scientific, 1963662250) was used for protein A (ProA) chromatography, efficiently eliminating harvest contaminants such as host-cell proteins (HCPs) and DNA while retaining high levels of the target mAb.
Multiple ProA cycles were run, and the protein A eluate from each cycle was pooled together. Viral inactivation (VI) was applied to the ProA pool to ensure viral clearance.
To minimize product quantities, depth filtration (DF) and single-pass tangential flow filtration (SPTFF) capsule assembly were used in series to eliminate contaminants and concentrate the mAb pool.
To eliminate leftover HCP and concentrate the AEX product, the POROS™ XQ Strong Anion Exchange Resin (Thermo Scientific, 4467820) was used in conjunction with an SPTFF capsule assembly.
The POROS™ XS Strong Cation Exchange Resin (Thermo Scientific, 4404336) was used for cation exchange chromatography (CEX) to separate the target mAb from aggregated species and complete the downstream chromatography processes.
The CEX pool was concentrated and formed with UF/DF using a Quattroflow 1200S pump. The product pool was then processed using a Thermo Scientific™ HyPerforma™ Single-Use Mixer.
Aliquots were set aside after the initial ultrafiltration (post UF), diafiltration (post DF), and the primary and secondary UF/DF recoveries. The primary and secondary recoveries were combined (UF/DF Pool) and then formulated to achieve the desired bulk drug substance (BDS Product) concentration.
Table 1. Sample aliquots reserved at each mAb processing stage. Source: Thermo Fisher Scientific - UV-Vis Spectroscopy
| Stage in process |
Description |
| ProA pool |
mAbs pooled from protein A chromatography |
| Post VI |
Post viral inactivation |
| Post DF/SPTFF |
Post diafiltration/single-pass tangential flow filtration |
| Post AEX/SPTFF |
Post POROS XQ Strong Anion Exchange/single-pass tangential flow filtration |
| CEX pool |
mAbs pooled from POROS XS Strong Cation Exchange |
| Post UF |
Post ultrafiltration |
| Post DF |
Post diafiltration |
| UF/DF primary recovery |
First pass ultrafiltration/diafiltration |
| UF/DF secondary recovery |
Second pass ultrafiltration/diafiltration |
| UF/DF pool |
Pooled mAbs from primary and secondary recovery ultrafiltration/diafiltration |
| BDS product |
Final bulk drug substance |
The mAbs at each step were measured on comparable high-concentration UV-Vis equipment, equipped with a NanoDrop UltraC spectrophotometer, the Acclaro Pro Protein A280 application, and the custom E1% mass extinction coefficient of 14.0 (g/100 mL)-1 cm-1, with a baseline correction at 320 nm.
The NanoDrop UltraC instrument was blanked with phosphate-buffered saline (PBS) for all samples except the UF/DF Pool and BDS Product. The UF/DF Pool and BDS Product were blanked with the matrix buffer, which contained histidine, arginine, and sucrose. A blank was not needed for the equivalent UV-Vis instrument.
Samples for both instruments were measured in triplicate using a ‘replicate’ format, which necessitated a new aliquot for each of the three samples.
The average and coefficient of variation (%CV) were computed from triplicate measurements, and average concentrations were compared to a comparable UV-Vis instrument to estimate the percent difference.
Triplicate readings from both instruments were timed with a stopwatch to evaluate differences in measurement time from aliquoting the first sample to the end of the experiment.
A potassium hydrogen phthalate (KHP) solution was also prepared by adding 3.678 g of KHP to 40 mL of deionized water (diH2O). To test the Acclaro Pro software's entire range, dilutions yielded absorbances of 400 A, 300 A, 200 A, 100 A, and 75 A at 280 nm (292–55 g/L IgG equivalent).
The Acclaro Pro software's accuracy was measured using a Thermo Scientific™ Evolution™ Pro UV-Vis Spectrophotometer. Stock KHP samples were diluted 1:1000 and determined with a 1 cm quartz cuvette. The absorbance at 280 nm was measured with a bandwidth of 1 nm and an integration time of one second.
Results
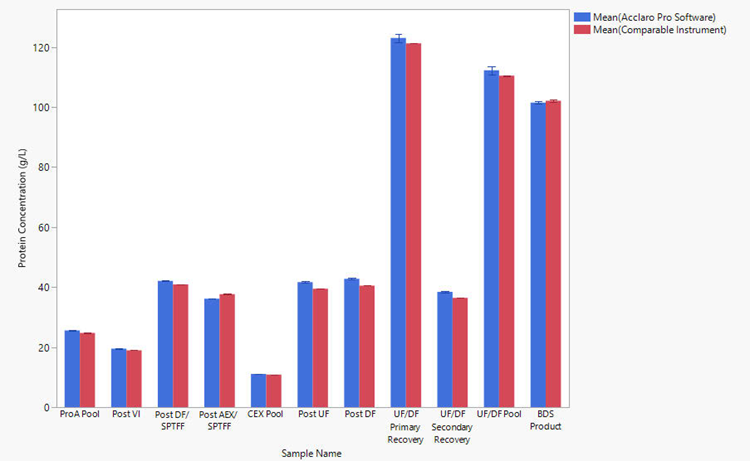
Figure 1. Average concentration (n=3) of mAbs obtained from each stage of production. Blue bars represent concentrations reported by the NanoDrop Ultra Acclaro Pro software. Red bars represent concentrations reported by a comparable UV-Vis spectrophotometer. Error bars represent one standard deviation from the mean. Image Credit: Thermo Fisher Scientific - UV-Vis Spectroscopy
Table 2 shows the concentration values and % difference for only the UF/DF and BDS samples, as absorbance spectrophotometry is normally used for the most pure product.
The table compares the results of a similar spectrophotometer and a NanoDrop UltraC spectrophotometer using the Acclaro Pro software. The Acclaro Pro software's concentration measurements are very reproducible, with a standard deviation of less than 1.4 g/L.
For the majority of samples, the percentage difference between the equivalent instrument with its software and the NanoDrop Ultra instrument with Acclaro Pro software was less than 2%.
PBS was used as the blank instead of the matrix buffer for the UF/DF primary and secondary recovery samples, which could explain the secondary recovery sample's larger percent difference (5.5%).
This emphasizes the need to perform a proper blank measurement using the same buffer in which the sample is suspended.
The Acclaro Pro software took two minutes and 22 seconds to complete a triplicate measurement from aliquoting the first sample to the completion of the experiment, compared to seven minutes and 20 seconds with similar apparatus. Acclaro Pro software analyzes triplicates three times faster, making it ideal for assessing large numbers of samples.
Table 2. Average concentrations, standard deviations, and percent differences of mAbs at separate purification stages, measured in triplicate on a comparable UV-Vis spectrophotometer and a NanoDrop UltraC spectrophotometer using the Acclaro Pro software. Source: Thermo Fisher Scientific - UV-Vis Spectroscopy
| |
Comparable UV-Vis instrument |
NanoDrop Ultra Acclaro Pro Software |
|
| Sample Name |
Average
(g/L) |
Standard
deviation (g/L) |
Average
(g/L) |
Standard
deviation (g/L) |
Percent
difference |
| UF/DF primary recovery |
121.2 |
0.04 |
123.0 |
1.4 |
1.5% |
| UF/DF secondary recovery |
36.4 |
0.02 |
38.5 |
.03 |
5.5% |
| UF/DF pool |
110.5 |
0.10 |
112.3 |
1.3 |
1.6% |
| BDS product |
102.1 |
0.4 |
101.5 |
.04 |
0.6% |
Figure 2 compares KHP dilutions measured on an Evolution Pro spectrophotometer and a NanoDrop UltraC spectrophotometer using the Acclaro Pro software, while Table 3 summarizes the results. The R2 value of the regression line is 1.000, indicating a good correlation between absorbance readings.
Table 3 shows the percentage difference for each sample, which confirms the correctness of the Acclaro Pro program. The percentage difference was 4.9% or less across all samples, which falls within Acclaro Pro's 5% criterion.
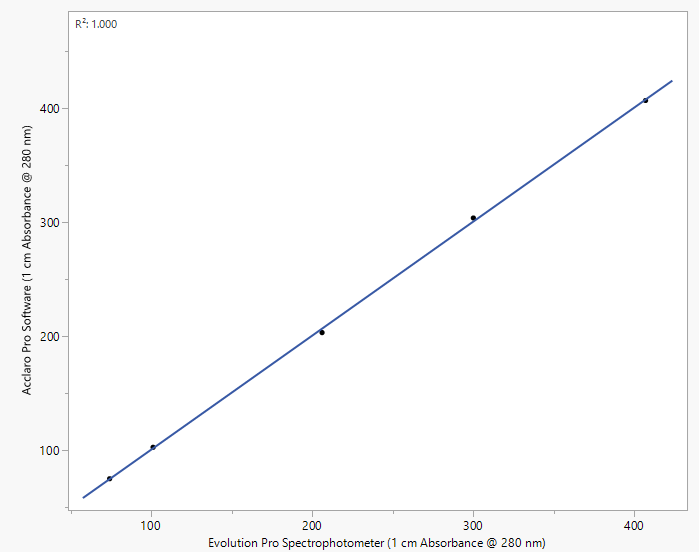
Figure 2. Comparison of absorbance at 280 nm reported by an Evolution Pro spectrophotometer and a NanoDrop UltraC spectrophotometer utilizing the Acclaro Pro software (R2=1.000). Absorbance results from the Evolution Pro instrument were multiplied by a dilution factor. Image Credit: Thermo Fisher Scientific - UV-Vis Spectroscopy
Table 3. Average absorbances, standard deviations, and percent differences for dilutions of KHP, measured on an Evolution Pro spectrophotometer (n=1, 1:1000 dilution) and a NanoDrop UltraC spectrophotometer utilizing the Acclaro Pro software (n=5). Percent differences are compared to the Evolution Pro spectrophotometer. Source: Thermo Fisher Scientific - UV-Vis Spectroscopy
| |
Evolution Pro spectrophotometer |
NanoDrop Ultra Acclaro Pro Software |
| KHP Dilution |
Abs @ 280 nm |
Average (Abs @ 280 nm) |
Standard deviation |
Percent difference |
| 400 A |
407.0 |
402.7 |
2.1 |
1.1% |
| 300 A |
300.0 |
305.2 |
1.8 |
1.7% |
| 200 A |
206.0 |
201.3 |
1.7 |
2.3% |
| 100 A |
101.0 |
103.6 |
1.8 |
2.5% |
| 75 A |
74.0 |
77.7 |
1.8 |
4.9% |
Conclusion
Acclaro Pro software for NanoDrop Ultra spectrophotometers and fluorometers yields highly accurate absorbance and concentration values up to 550 absorbance units (400 g/L IgG, 18,150 ng/µL ssDNA).
To achieve results within the specified concentration accuracy (±5% error), zero the spectrophotometer with an identical buffer in which the sample is suspended, then quantify purified biomolecules.
The NanoDrop Ultra equipment with Acclaro Pro software can be easily integrated into any oligonucleotide or antibody production workflow due to its small footprint (32 x 18 x 28 cm), 1–2 µL sample capacity, no-dilution, no-consumables design, and fast measurement time.
About Thermo Fisher Scientific - UV-Vis Spectroscopy
UV-Vis Spectrometers overview
Scientists can count on our broad range of ultraviolet (UV) and visible (Vis) spectrophotometers to deliver reliable, accurate data. The Thermo Scientific SPECTRONIC 200, GENESYS, and Evolution product lines are designed to streamline measurements, providing consistent, high-quality results, time after time. Additionally, the innovative Thermo Scientific NanoDrop microvolume family of instruments has been helping scientists accelerate the pace of discovery for over 20 years. From classroom teaching to routine measurements to discovery of the next scientific breakthrough, our line of spectrophotometers is designed to fit into any modern laboratory.
Sponsored Content Policy: News-Medical.net publishes articles and related content that may be derived from sources where we have existing commercial relationships, provided such content adds value to the core editorial ethos of News-Medical.net, which is to educate and inform site visitors interested in medical research, science, medical devices and treatments.