The Thermo Scientific™ NanoDrop™ Ultra FL/UltraC FL spectrophotometers and fluorometers use a microvolume pedestal to minimize the amount of valuable dsDNA needed for a quantitative fluorescence experiment.
The QuantiT™ PicoGreen™ dsDNA Reagent, a sensitive nucleic acid dye, requires 100 µL of reagent per 200 µL reaction. Thermo's methodology uses a microvolume pedestal to reduce the overall assay volume to 20 µL; depending on the concentration, only 2 µL or 10 µL of dsDNA is needed.
The NanoDrop Ultra FL/UltraC FL equipment can identify samples with concentrations ranging from 10 ng/µL to 0.2 ng/µL when tested with the PicoGreen dsDNA kit. This allows for sensitive quantification prior to downstream studies, such as next-generation sequencing.
Assay protocol
Supplies required
- NanoDrop Ultra FL or NanoDrop UltraC FL spectrophotometer and fluorometer
- Calibrated pipettors with nuclease-free low retention tips
- Lint-free laboratory wipes
- Microcentrifuge tubes and lids (preferably in amber)
- PicoGreen dsDNA Reagent and Kit (Invitrogen, P7589).
- Deionized, nuclease-free water
Assay preparation
- To determine the concentration of dsDNA, use the NanoDrop Ultra instrument's Nucleic Acids tab and the dsDNA application to measure absorbance.
-
- Note: To save volume, pipette up the sample from the bottom pedestal after measuring absorbance.
- Table 2 shows concentration ranges and assay volumes. The required volumes will dictate how much 1X TE and working solution to prepare.
- Prepare 1X TE by diluting the PicoGreen dsDNA Kit's 20X TE stock 20-fold with nuclease-free diH2O. The volume of 1X TE required is determined by the number of samples and the required volume of working solution.
-
- For standard curve dilutions (three standards), reference, and working solution preparation for 10 samples and standards using the 200 µL assay volume, 0.1 mL of 20X TE in 1.9 mL of nuclease-free diH2O is sufficient.
- To prepare the assay working solution, dilute the concentrated PicoGreen dsDNA Reagent 200-fold in 1X TE.
-
- To use the 200 µL assay volume, add 5 µL of PicoGreen dsDNA Reagent to 995 µL of 1X TE. This amount is enough for 10 samples and standards.
- Note: To preserve working solution stability, prepare fresh and store away from light to avoid photobleaching.
Standard curves and sample preparation
- Dilute the lambda DNA stock from 100 ng/µL to 1 ng/µL in 1X TE.
-
- For example, this could be achieved by mixing 5 µL of 100 ng/µL lambda DNA stock with 495 µL of 1X TE.
- Create a standard curve as shown below. For dsDNA concentrations approaching the lower detection limit, increase the number of standards to improve accuracy.
-
- Note: To avoid differences in fluorescent dye binding, construct a reference curve with comparable DNA to the sample.
Table 1. Suggested standard curve dilution protocol. Final DNA concentration is 2X the in-assay concentration after mixing with working solution. Source: Thermo Fisher Scientific - UV-Vis Spectroscopy
| Standard # |
Volume of 100
ng/µL stock DNA |
Volume of
Standard 1 |
Volume of 1X
TE buffer |
Final DNA
concentration |
| 1 |
5 µL |
- |
495 µL |
1 ng/µL |
| 2 |
- |
100 µL |
100 µL |
0.5 ng/µL |
| 3 |
- |
40 µL |
160 µL |
0.2 ng/µL |
| Reference |
- |
- |
200 µL |
0 ng/µL |
- Using a calibrated pipette, transfer the working solution, 1X TE buffer (if applicable), standards, and samples into labeled, nuclease-free amber microcentrifuge tubes.
Table 2. Working solution, buffer, and standard/sample volumes required for specified concentration ranges. Sample concentration ranges indicate the original, undiluted concentration. Source: Thermo Fisher Scientific - UV-Vis Spectroscopy
|
1:1 (Sample concentrations between 0.2–1 ng/µL) |
1:5 (Sample concentrations between 1–5 ng/µL) |
1:10 (Sample concentrations between 5–10 ng/µL) |
|
Standard tubes |
Sample tubes |
Standard tubes |
Sample tubes |
Standard tubes |
Sample tubes |
| Volume of working solution |
10 µL |
10 µL |
10 µL |
10 µL |
100 µL |
100 µL |
| Volume of 1X TE buffer |
- |
- |
- |
8 µL |
- |
90 µL |
| Volume of standard or sample |
10 µL |
10 µL |
10 µL |
2 µL |
100 µL |
10 µL |
| Total volume |
20 µL |
20 µL |
20 µL |
20 µL |
200 µL |
200 µL |
- Combine the standard and sample with a vortex or pipette and quickly spin to gather the liquid at the bottom of the tube. Incubate the tubes at room temperature for five minutes, keeping them away from light.
Measure samples
- To pick the blue excitation LED on the NanoDrop Ultra FL/UltraC FL instrument screen, navigate to the Fluorescence tab, then the Fluorometer application, and finally Blue (470 nm).
- In the setup window, input the following.
-
- Curve type: Linear
- Standards: 3
- Unit: ng/µL
- Replicates: 5 (recommended)
- Standard concentrations: 0.2, 0.5, 1.0 (zero reference automatically included in the setup
- Lift the instrument arm and clean the top and bottom pedestals with a dry, lint-free laboratory wipe.
- Transfer 2 µL of the zero reference to the bottom pedestal and lower the arm.
- After measuring, clean the top and bottom pedestals with a lint-free lab wipe.
- Follow on-screen directions to continue measuring standard replicates. Pipette fresh 2 µL aliquots for each replicate and clean the pedestals with a laboratory wipe between measurements.
- After completing standard replicates, a window will emerge with three options: ‘remeasure standards’, ‘load standards’, or ‘measure samples’. If standard replicates must be remeasured or additional standard concentrations are necessary, choose remeasure standards or load standards. Otherwise, go to measure samples.
- Repeat steps 3–4 to measure samples.
-
- It is recommended to conduct at least five sample replications.
- If samples were diluted 1:5 or 1:10 in the assay, the measured concentrations can be multiplied by the dilution factor (five or 10) to get the original concentration.
- Once completed, select ‘end experiment’. The results can be exported as .csv or .tsv files for additional data analysis.
Expected performance
Table 3 shows the expected performance of the PicoGreen dsDNA kit when measured with a NanoDrop UltraC FL spectrophotometer and fluorometer. Samples and standards were prepared using the PicoGreen dsDNA kit's lambda DNA standard and diluted with 1X TE.
The mean concentration of five replicates was less than 9% off over the tested concentration range, while the percent coefficient of variation (%CV) was less than 3%. This capability enables accurate and reproducible fluorescence measurements.
Table 3. Expected performance of the full dynamic range of the PicoGreen dsDNA kit measured on a NanoDrop UltraC FL spectrophotometer and fluorometer. Concentration results were averaged from five replicates. *Samples prepared using the 1:1 method. **Samples prepared using 1:5 method. ***Samples prepared using 1:10 method. Percent error (% error) is compared against theoretical concentrations. Source: Thermo Fisher Scientific - UV-Vis Spectroscopy
| Theoretical Concentration |
0.2 ng/
µL* |
0.5 ng/µL* |
1 ng/µL* |
2 ng/µL** |
5 ng/µL** |
7.5 ng/µL*** |
10 ng/µL*** |
Average
Concentration (ng/µL) |
0.18 |
0.49 |
0.97 |
2.17 |
4.94 |
7.67 |
10.36 |
| % CV |
1.83 |
1.45 |
0.96 |
1.76 |
2.36 |
2.62 |
2.37 |
| % Error |
7.54 |
2.08 |
3.20 |
8.26 |
1.17 |
2.23 |
3.57 |
Figure 1 shows the assay's linearity over its entire range. The R2 of the regression line is 0.998, indicating a high degree of agreement between observed and theoretical concentrations over nearly two orders of magnitude.
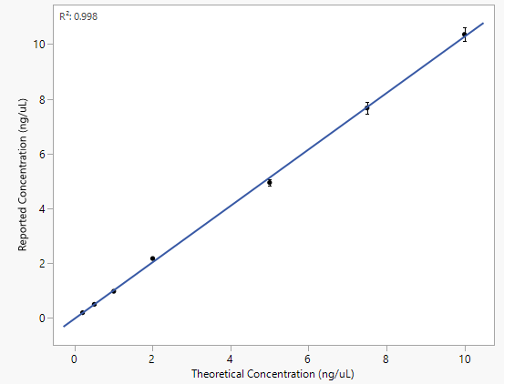
Figure 1. Linear regression of the NanoDrop UltraC FL software-reported concentration results compared to the theoretical concentration. R2 = 0.998. Error bars represent ±1 standard deviation from the mean. Image Credit: Thermo Fisher Scientific - UV-Vis Spectroscopy
Acknowledgments
Produced using materials originally authored by Jennifer Prestipino.
About Thermo Fisher Scientific - UV-Vis Spectroscopy
UV-Vis Spectrometers overview
Scientists can count on our broad range of ultraviolet (UV) and visible (Vis) spectrophotometers to deliver reliable, accurate data. The Thermo Scientific SPECTRONIC 200, GENESYS, and Evolution product lines are designed to streamline measurements, providing consistent, high-quality results, time after time. Additionally, the innovative Thermo Scientific NanoDrop microvolume family of instruments has been helping scientists accelerate the pace of discovery for over 20 years. From classroom teaching to routine measurements to discovery of the next scientific breakthrough, our line of spectrophotometers is designed to fit into any modern laboratory.
Sponsored Content Policy: News-Medical.net publishes articles and related content that may be derived from sources where we have existing commercial relationships, provided such content adds value to the core editorial ethos of News-Medical.net, which is to educate and inform site visitors interested in medical research, science, medical devices and treatments.