Examining particulate matter in diverse samples is especially difficult. Particle Vue Software, a comprehensive particle analysis solution available exclusively on Aura Systems, streamlines the discovery process through automated functionalities designed for particle detection and analysis.
This user-centric software is designed for rapid and precise operation, requiring minimal user input, and incorporates sophisticated algorithms, particle size analysis capabilities, and multi-channel image navigation.
Particle Vue Software enables the integration of images and data into a unified interface, enabling both a quick overview and in-depth exploration through sophisticated analysis and visualizations.
This automated particle analysis software is designed to reveal key insights during early phases of drug development. The software enhances research processes by integrating high-quality analytics and algorithms with multidimensional visualizations, streamlining operations, and improving efficiency.
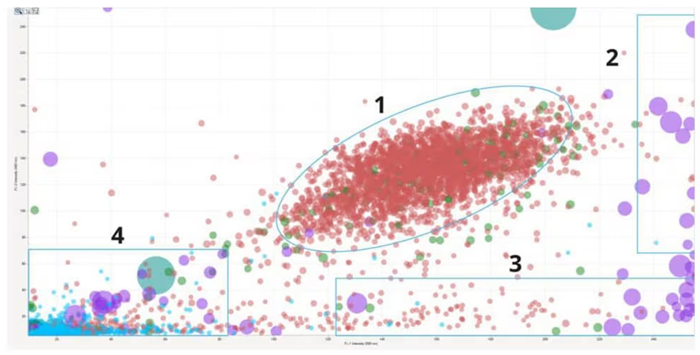
Identify cell doublets and triplets (1), cellular aggregates (2), protein aggregates (3), and plastic contaminants (4) in a cell therapeutic sample. Image Credit: Waters | Wyatt Technology
Overview
- Visualize the particles: The all-in-one particle analysis software provides a clear visualization of particles without the need for complex calibration or spectral interpretation.
- Make better judgments: The expression engine in Particle Vue Software enables the analysis of particle subpopulations. This is achieved through the use of analysis parameters, such as particle size and signal intensities from various light sources, which facilitates more informed decision-making.
- Gain early insights: The particle software allows for rapid evaluation and ranking of samples based on subvisible antibody aggregates. This provides a comprehensive understanding of their physical instabilities.
Automated particle analysis software designed for simplified visualization and compliance-ready data management on Aura Systems.
What was missing? The power of particle ID
Distinguishing between protein and non-protein particles based solely on morphology is not adequate. To accurately identify particles, it is essential to view the brightfield channel, the fluorescence channel, and the darkfield channel simultaneously in a single image.
This method enables real-time examination of individual particles, guaranteeing precise evaluation of all morphology parameters. Using fully integrated particle analysis software systems improves quality control procedures, providing thorough data essential for rigorous quality evaluations.
Particle Vue Software adheres to the standards of 21 CFR Part 11, making it well-suited for gathering, saving, and sending regulated data.
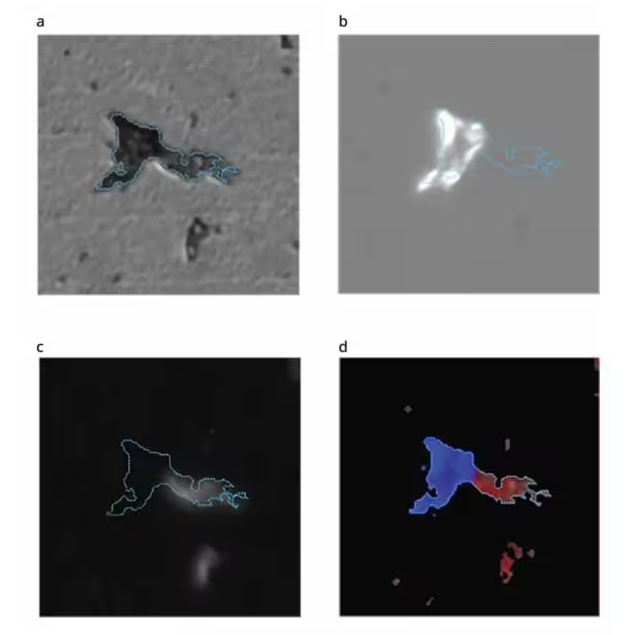
(a) Brightfield image (b) SIMI image (c) Fluorescence image (d) Combined SIMI and fluorescence image. Image Credit: Waters | Wyatt Technology
Get to know the particles at the experiment, sample, and individual level
With a single click, a histogram provides a summary of the particle distribution within a sample. User-friendly particle analysis software allows for comparison of particle count, counts per milliliter, or percentage on the y-axis against a selected particle parameter on the x-axis.
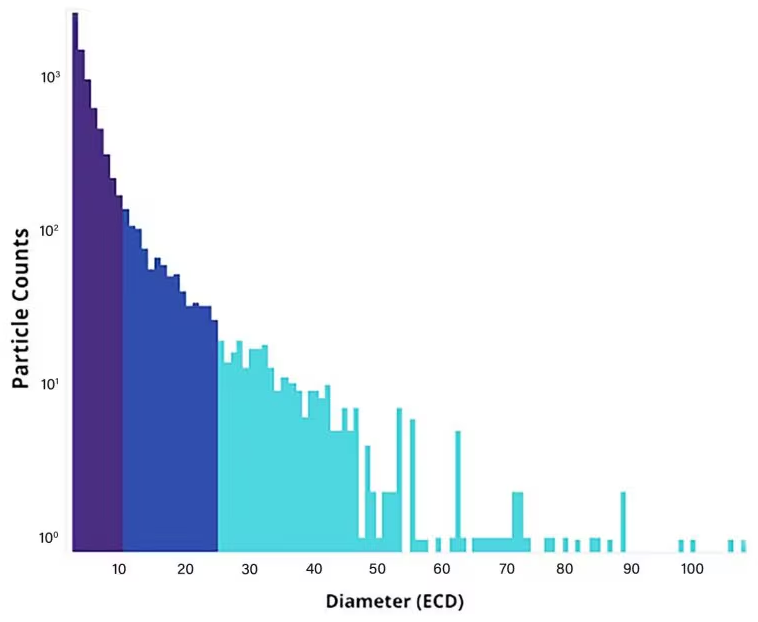
Using a histogram, you can obtain an overview of the particle distribution in your sample with a single click. Image Credit: Waters | Wyatt Technology
Analyze data the way one wants
The scatter plot functionality offers exceptional adaptability when interpreting and scrutinizing sample outcomes. Particle Vue Software provides maximum control and ease in data exploration for anomalies or insights, achieved by modifying the x- and y-axis parameters and customizing settings to meet precise demands.
When hovering over a specific particle, details like particle size and a brightfield image are readily available, courtesy of this thoroughly integrated particle analysis software.
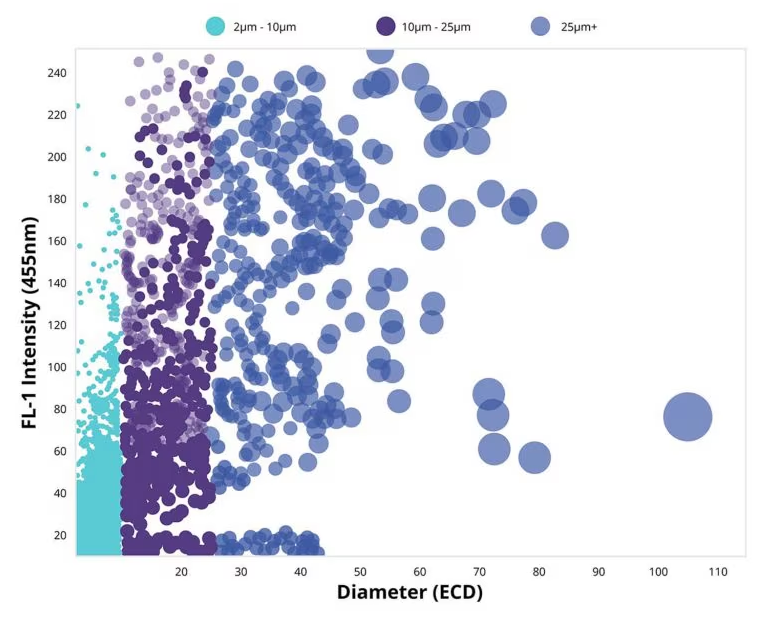
The scatter plot feature provides users with unmatched flexibility in interpreting and analyzing their sample results. Image Credit: Waters | Wyatt Technology