COVID-19 is a contagious respiratory disease caused by the novel coronavirus, severe acute respiratory syndrome coronavirus 2 (SARS-CoV-2). As of today, more than 90 million people have been infected worldwide, with over 22.6 million in the U.S alone, and the number of cases continues to rise. SARS-CoV-2 PCR and antigen testing, shelter-in-place, and social distancing are effective and complementary public health strategies, but in their patchwork implementation, they have not been adequate to stop ongoing virus transmission.
SARS-CoV-2 infection is primarily diagnosed using laboratory tests, which are frequently not administered until after symptom onset. However, SARS-CoV-2 is contagious multiple days before symptom onset and diagnosis, thus enhancing its transmission through the population.

 *Important notice: medRxiv publishes preliminary scientific reports that are not peer-reviewed and, therefore, should not be regarded as conclusive, guide clinical practice/health-related behavior, or treated as established information.
Using resting heart rate to predict COVID-19
A recent study, appearing as a preprint on the medRxiv* server, reveals the possibility of early prediction of SARS-CoV-2 infection using data on the resting heart rate in the presymptomatic period. This data was fed to a deep learning algorithm trained on retrospective datasets, collected in a time-series manner, from 25 patients with COVID-19, 11 other patients, and 70 healthy individuals.
Earlier studies have been conducted on the same premise, namely, that a higher resting heart rate might indicate early infection, using data from wearable electronic devices. However, this is the first study to examine the possibility of prediction of COVID-19 while allowing users to provide feedback on its performance. This could be used in real-time to allow large-scale early detection of SARS-CoV-2.
It is currently estimated that SARS-CoV-2 shedding may begin 5-6 days prior to the onset of symptoms and continues for the next 15-17 days, in the vast majority of cases. This long period of asymptomatic shedding, which was not seen with the earlier SARS-CoV, makes it difficult to contain the pandemic and makes it a matter of urgency to develop early detection methods.

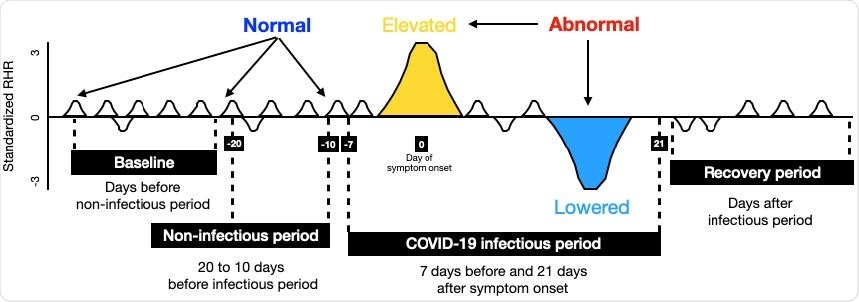
Data design and LAAD framework (LSTM Encoder-Decoder inference steps for input to reconstruct the output). (A) To detect abnormal RHR (resting heart rate) data was split into baseline (train) and test sign symptom onset day as a reference. First, test data was set by taking 20 days prior to symptom onset and 21 days after. Second, test data was split into infectious period (7 days prior symptom onset and 21 days after) and noninfectious period (20 to 10 days before infectious period), and recovery period (days after infectious period). If the RHR during the infectious period is changed (elevated or lowered) from its user’s baseline, it would be classified as “abnormal RHR”. Further, to evaluate the model performance, predictions in the infectious period were compared against the non-infectious period.
Using time-series data to detect anomalies
Wearable devices that track biometric data could be very useful in detecting SARS-CoV-2. These devices contain sensors that pick-up data on heart rate and steps taken, which could be useful in detecting and monitoring viral infections over time or even detecting the start of an infection. Such applications depend on statistical methods, which must, however, account for environmental factors such as temperature, altitude, and other conditions that may affect physiological variables. This could lead to the intrinsic variability of time-series data that is collected at regular intervals and marked chronologically.
Such time-series data can be useful if they are analyzed to find abnormalities, which could provide valuable information about underlying disease conditions. However, standard statistical methods cannot detect such anomalies since they use either static data or a pre-specified time window.

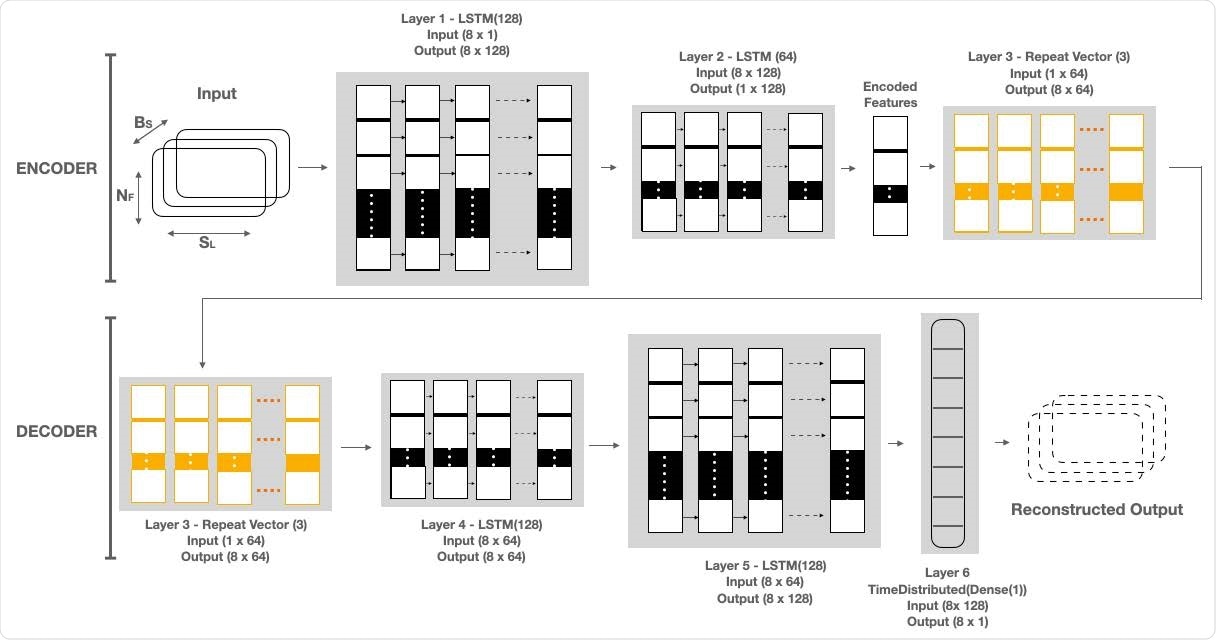
LAAD takes baseline standardized RHR data of shape (BS, SL, NF), where BS is batch size, NF is the number of features and SL is sequence length or time steps and passes it to the first layer. The input data has 8 timesteps and one feature. First layer has as many LSTM cells as the SL and makes each cell per timestep emit a signal to a second layer. Layer 1, LSTM(128), reads the input data and outputs 128 features with 8 timesteps. Second layer has half the size of LSTM cells than the previous and only the last cell emits an output. Layer 2, LSTM(64), takes the 8x128 input from Layer 1 and reduces the feature size to 64. The output of this layer is the encoded feature vector of the input data. Third layer uses a Repeat Vector that replicates the feature vector 3 times and gets a 2D array for the fourth layer (1st LSTM layer in Decoder) and acts as a bridge between encoder and decoder. The decoder layers unfold the encoding by stacking LSTM layers in the. reverse order of the encoder. Layer 4, LSTM (64), and Layer 5, LSTM (128), are the mirror images of Layer 2 and Layer 1, respectively. Layer 6, TimeDistributed (Dense(1)), is added in the end to get the reconstructed output, where “1” is the number of features in the input data.
The LAAD model for resting heart rate analysis
The current study uses a deep learning framework, Long Short-Term Memory Networks (LSTM)-based Autoencoder for Anomaly Detection (LAAD), which learns time-based patterns from the data input. This pattern is then used to build a ‘normal’ output, compare it with the baseline and find the threshold based on the reconstruction error, and thus detect abnormalities in the test data.
The LAAD can learn time-based patterns of higher complexity without knowing the duration of the pattern beforehand. Moreover, it can learn from ‘normal’ data. These characteristics allow both predictable and unpredictable time-series data to be analyzed.
The researchers collected data on heart rate and steps from wearables worn by all the 106 individuals over February to June 2020. The resting heart rate (RHR) was first decoded from the heart rate, and steps data and an aggregate one-hour RHR was calculated. Any abnormality would be defined as an elevation or lowering of the RHR from the baseline.
The wearable data was processed, data augmentation techniques were applied to compensate for the limited number of days for which training was available, and the augmented training data was used as the LAAD input.
Study results
The LAAD model detected an abnormal RHR signal in 14 cases, who had presymptomatic SARS-CoV-2 infection, and in nine individuals with symptomatic infection. However, it missed two infected individuals. RHR anomalies were observed five days before the onset of symptoms, which comes to about seven days before symptom onset in presymptomatic cases, and two days late in the post-symptomatic cases.
Among the 14 presymptomatic cases, there were seven strong and seven weak abnormal RHR signals. Of the nine cases in which RHR abnormalities were seen in the post-symptomatic period, four and five had strong and weak abnormalities of the RHR signals, respectively.
The data was evaluated for its performance by classifying it into test-normal and test-anomaly categories, based on the analysis of the non-infectious and infectious period, respectively, and matching the predictions against each other. They used the F-beta score to describe both the precision of the prediction and the recall performance. In this case, the F-beta score was 0.79.
Among the 11 patients without SARS-CoV-2 infection, there were seven who had RHR anomalies in the presymptomatic period of the infection, but two who had post-symptomatic RHR abnormalities. No signal was detected in two individuals. They found that the F-beta score was 0.77 in this group.
Among the healthy individuals, 44 had abnormal RHR in the presymptomatic period (selected at random) and 15 in the post-symptomatic period (again, selected at random). In 11 individuals, there was no signal. The F-beta score was 0.7.
What are the implications?
Overall, the LAAD model displayed good performance in all three groups of individuals, with the average F-beta score being 0.75. The SARS-CoV-2 infected patients had more extended hours of RHR abnormality, at about 90 hours, during the infectious period, relative to ~88 hours in non-infected patients and 25 hours in healthy individuals. In other words, the duration of RHR anomaly is much higher in infections relative to healthy individuals, while being only a little longer in SARS-CoV-2 than in other infections.
Secondly, ~78% of COVID-19 patients had over a day of abnormal RHR data vs. 70% of non-COVID-19 patients and ~52% of healthy individuals. RHR anomaly duration might, therefore, differentiate COVID-19 from healthy people.
The anomalies observed included five days of higher RHR and ~4 days of lower RHR relative to the baseline during the infectious period. These findings are not enough to discriminate the three groups of individuals, however.
The study is limited by the self-reported nature of symptom onset data, along with uncertainty about whether some of the healthy individuals had asymptomatic SARS-CoV-2 infection since none of them were tested. However, despite this and other limitations, the researchers suggest that wearable sensor data could help predict COVID-19 early in the course of infection.
“A detailed real-time wearable study on the COVID-19 patients with symptoms annotated by users and confirmed by laboratory tests will further our understanding about tracking, modeling, and detecting outbreaks of SARS-CoV-2.”

 *Important notice: medRxiv publishes preliminary scientific reports that are not peer-reviewed and, therefore, should not be regarded as conclusive, guide clinical practice/health-related behavior, or treated as established information.