New research reveals how a common gene variation boosts salivary enzymes, especially in people with diabetes, hinting at a possible biological link between starch digestion and blood glucose regulation.
 Study: The association between salivary amylase gene copy number and enzyme activity with type 2 diabetes status. Image credit: MattL_Images/Shutterstock.com
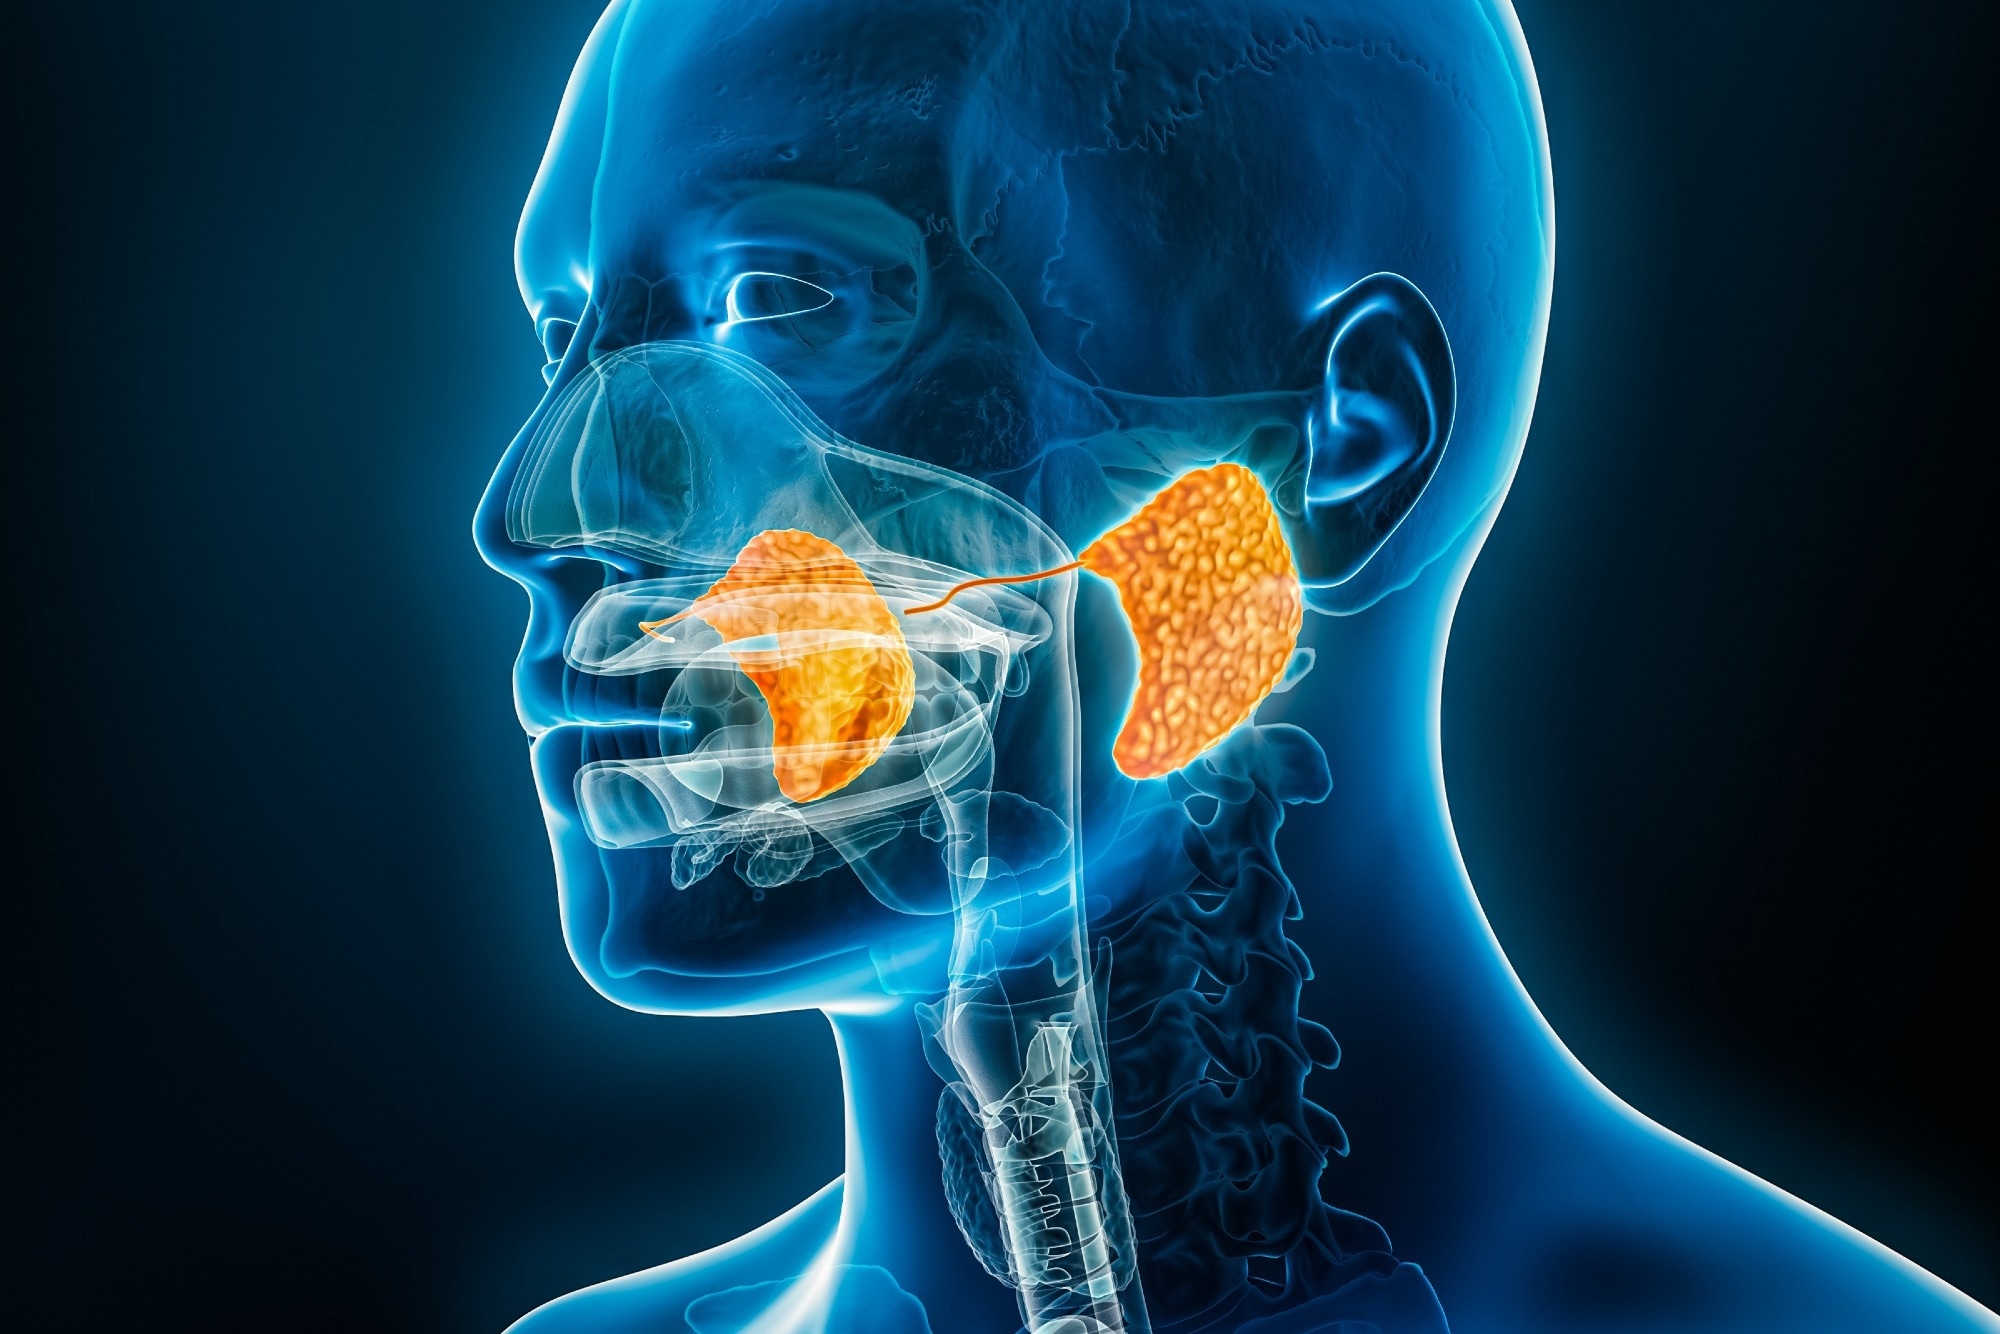
An elevated salivary amylase activity (SAA) in patients with type 2 diabetes (T2D) may represent a compensatory mechanism associated with the long-term protective effect of high amylase gene (AMY1) copy number (CN) on glucose metabolism. A recent PLOS ONE study examined the factors influencing the association between AMY1 CN, SAA, and T2D status.
Copy number variations and metabolic status
A variation in copy number (CN) between individuals refers to a difference in the number of copies of a particular DNA sequence. Typically, CN variation affects approximately 10% of the human genome. CN variants (CNVs) contribute to phenotypic variability and disease risk by altering gene expression.
One of the most common CNVs is AMY1, which encodes the salivary amylase enzyme. This gene is involved in the production of amylase, an enzyme that initiates the breakdown of starch in the mouth. In humans, the diploid AMY1 CN ranges from 2 to 20, and this difference may influence an individual's metabolic status.
Previous research has presented contradictory findings regarding the association between AMY1 CN and metabolic disorders (e.g., impaired glucose homeostasis and obesity). These inconsistencies may stem from the different methods used to determine AMY1 CN, including quantitative PCR (qPCR), fluorescence in situ hybridization (FISH), droplet digital PCR (ddPCR), paralogous ratio tests (PRT), and computational approaches.
Although a positive correlation exists between AMY1 CN and salivary amylase protein quantity and SAA, this association may vary in the context of physiological implications. Previous studies have documented higher SAA levels in people with T2D compared to healthy controls, and have proposed that these measures could be utilized as diagnostic biomarkers for T2D.
About the study
The study population consisted of two cohorts: one included healthy adults in the starch study, while the other comprised individuals aged 45 years or older with a self-reported diagnosis of prediabetes or type 2 diabetes in the T2D microbiome study. Participants for each cohort were selected from the local community in and around Ithaca, USA.
Participants for the starch study were enrolled between August 1, 2019, and December 31, 2019, and from September 2, 2020, to October 2, 2020. Similarly, participants for the T2D microbiome study were recruited between October 13, 2019, and March 14, 2020. To confirm prediabetes or T2D diagnosis, each participant in the T2D cohort was requested to provide the name of the medication prescribed for diabetes or a doctor’s note.
To assess glucose dysregulation, participants in the T2D cohort underwent an oral mixed-meal tolerance test. Saliva from 196 participants was collected to determine AMY1 CN. In a subset of 94 participants, saliva samples were collected to measure SAA. Before saliva collection, participants were asked not to brush their teeth for at least six hours and to refrain from consuming any food or beverages for at least 30 minutes. Genomic DNA was extracted from the saliva samples. AMY1 CN was measured using qPCR and ddPCR.
The final analysis that assessed the relationship between AMY1 CN and SAA in relation to T2D status included 16 participants with T2D or prediabetes and 74 healthy controls. Although the T2D group was older, the researchers found no significant association between age and SAA levels. The study also notes that consistent timing of saliva collection is important for reliable interpretation of SAA as a biomarker, due to its natural daily variation.
Study findings
The median AMY1 CN obtained via qPCR was 7.5 (ranging from 2 to 19 copies) and by ddPCR was 7.0 (ranging from 2 to 20 copies). The AMY1 CN estimates of the reference Coriell DNAs were obtained using qPCR and ddPCR. The overall AMY1 CN estimates varied between 0.20 and 2.54 for each Coriell DNA, with a median standard deviation of 0.73.
Linear regression was performed to determine the association between CNs obtained via qPCR and ddPCR for all 210 samples, i.e., 196 participants and the Coriell DNAs. Although qPCR measurements were predictive of the ddPCR measurements, the qPCR-estimated CN values were found to be more dispersed. This finding indicated that for a given AMY1 CN, qPCR generated more variable estimates than ddPCR.
Although the overall variance between qPCR and ddPCR was statistically similar, a decreased precision in qPCR estimates of AMY1 CN was observed. The intraclass correlation coefficient was estimated to be 0.95, indicating a high level of consistency between qPCR and ddPCR in estimating AMY1 CN.
A linear mixed model indicated that SAA increased as the day progressed. In line with the current findings, a previous study also showed a surge in SAA from morning to midday, followed by a slower rate of change throughout the afternoon. For every one-hour increase in saliva collection time, the expected value of SAA increased by 19% in the samples collected at or before noon.
The current study observed a significant positive association between AMY1 CN and SAA. Interestingly, AMY1 CN was independently found to be responsible for 18% of the variance in SAA. The authors perceived that the AMY1 CN and interindividual differences that cause variance in SAA could be attributed to the potential biological or other factors not considered in this study.
A significantly strong association was observed between AMY1 CN and T2D/prediabetes status. For every additional copy of AMY1, SAA increased by almost 14% in the control group and 43% in the T2D/prediabetes group.
The researchers suggest that higher SAA may either help mitigate or contribute to glucose dysregulation in T2D patients, but note that longitudinal studies are needed to clarify this directionality.
Conclusions
The current study highlighted that T2D/prediabetes status influences the association between AMY1 CN and SAA. Furthermore, both qPCR and ddPCR methods were confirmed to be effective in measuring AMY1 CN.
However, because of the cross-sectional design and relatively small number of participants with T2D/prediabetes, the authors advise caution in drawing causal conclusions from these findings.
The study also raises an important question about whether AMY1 CN, a stable genetic marker, or SAA, a dynamic phenotype affected by the environment, is a more informative marker of metabolic health, a distinction future research should investigate. The timing of saliva collection, dietary context, and other factors will be important considerations in developing SAA as a reliable health biomarker.
The study findings suggest that the role of SAA in glucose homeostasis warrants further research to fully comprehend its health applications.
Download your PDF copy now!
 Renowned physician‑scientist to lead Houston Methodist's cell and gene therapy research