By tracking how blood metabolites shift years before illness, researchers created a powerful atlas and risk score that reveal hidden signals of future disease, transforming prevention and early diagnosis.
In a recent study published in the journal Nature Metabolism, researchers mapped the plasma metabolome to its relationship with human health and disease. Metabolites provide a unique readout of health and disease, and are more closely linked to phenotypes than other blood-based biomarkers. As such, metabolic disturbances offer precise, comprehensive, and dynamic insights into disease status. Moreover, characterization of metabolic changes preceding disease diagnosis could help delineate biological signatures and etiology.
The study and findings
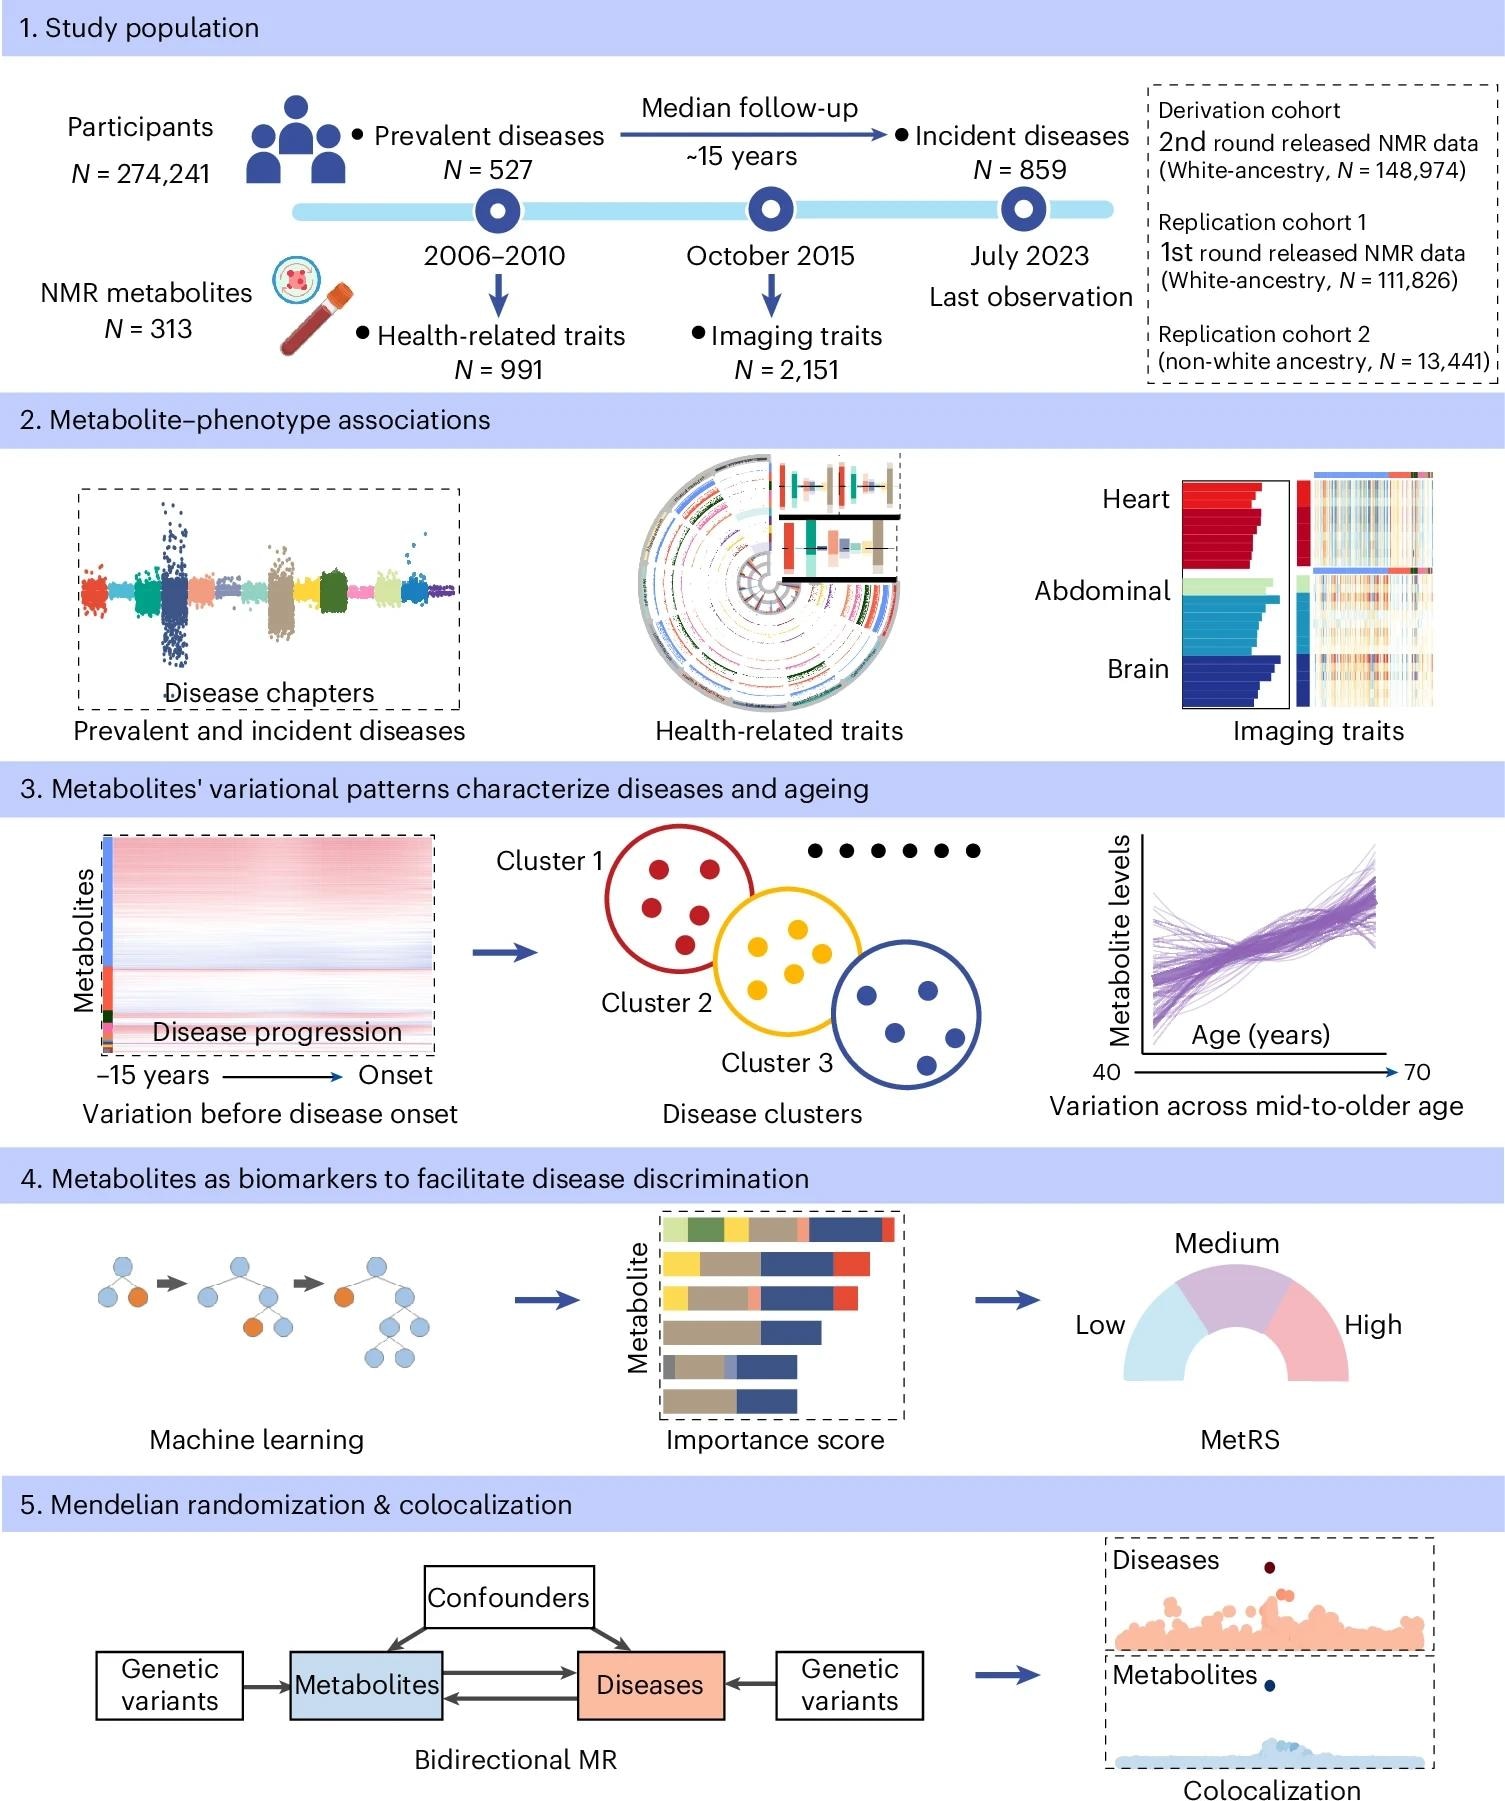
In the present study, researchers presented a human metabolome, phenome atlas, examining associations between plasma metabolites and human phenotypes in health and disease. This analysis included 274,241 participants from the United Kingdom Biobank, with a median prospective follow-up of 14.9 years. Participants had a median age of 58 years at the time of blood sampling. Blood was collected at baseline, and 313 nuclear magnetic resonance (NMR) metabolic profiles were measured, comprising 249 directly quantified measures and 64 derived ratios (including pre-existing and biologically informed new ratios).
Participants were grouped into three cohorts: one derivation and two replication cohorts. The derivation cohort comprised 148,974 White individuals. One replication cohort included 111,826 White individuals, and the other included 13,441 non-White individuals. Studied phenotypes comprised two categories: traits and diseases. Traits included 2,151 imaging and 991 health-related traits. Diseases included 527 prevalent and 859 incident diseases, defined using the ICD-10 coding system with FinnGen quality control (minimum 300 cases per disease).
Metabolite, disease relationships were analyzed prospectively for incident diseases and cross-sectionally for prevalent diseases. The cross-sectional analysis identified 18,594 associations, with hematologic and immune diseases constituting the highest proportion. The prospective analysis identified 34,242 associations, with metabolic and endocrine diseases accounting for the largest proportion. 42.5% of associations were significant in both analyses. The ratios of cholesterol to total lipids in large low-density lipoprotein particles (L-LDL-C%) and triglycerides to total lipids in large LDL particles (L-LDL-TG%) were the top metabolites associated with both incident and prevalent diseases. Furthermore, 62,887 health-related traits and metabolite associations were identified.
The high-light scatter reticulocyte counts in urine and blood assays were associated with the most metabolites. Lipoproteins, lipids, and metabolic ratios showed the most associations among metabolite categories. Notably, 542 associations showed different effect directions in age and sex subgroups. For example, 31 studies on alcohol intake, associated lipoproteins, and lipids showed opposite directional effects between males and females. Similarly, 47 cognitive functions, associated metabolomes had opposite effects between older and middle-aged groups. Further, 10,752 associations were observed for imaging traits, mainly in aortic and cardiac function. Fourteen metabolites were associated with diet and food preferences, as well as abdominal magnetic resonance imaging (MRI) analysis. Heart MRI analysis revealed nine metabolites related to cardiovascular system diseases.
Lipids and lipoproteins were the most frequently associated with traits and diseases, followed by fatty acids and metabolic ratios. Replication studies showed significant ancestry-based heterogeneity: 97.6% (cross-sectional) and 97.5% (prospective) metabolite and disease associations were validated in White participants, whereas only 31.6% and 45.3% were validated in non-White participants. Similarly, 97.2% vs. 42% of metabolite-trait associations replicated. Most associations remained significant after adjusting for kidney function, as measured by the estimated glomerular filtration rate (eGFR).
Using a nested case, control design, the team delineated metabolite variations across 15 years preceding disease onset. Approximately 57.5% of metabolites associated with disease in the prospective analysis exhibited significant variations from those of healthy individuals over a decade prior to disease onset. Hierarchical clustering grouped diseases into 44 clusters with distinct pre-diagnosis metabolic trajectories. Parallel analysis revealed metabolites change in waves during aging (peaking at ages 46 and 64), with 297 showing sex interactions.
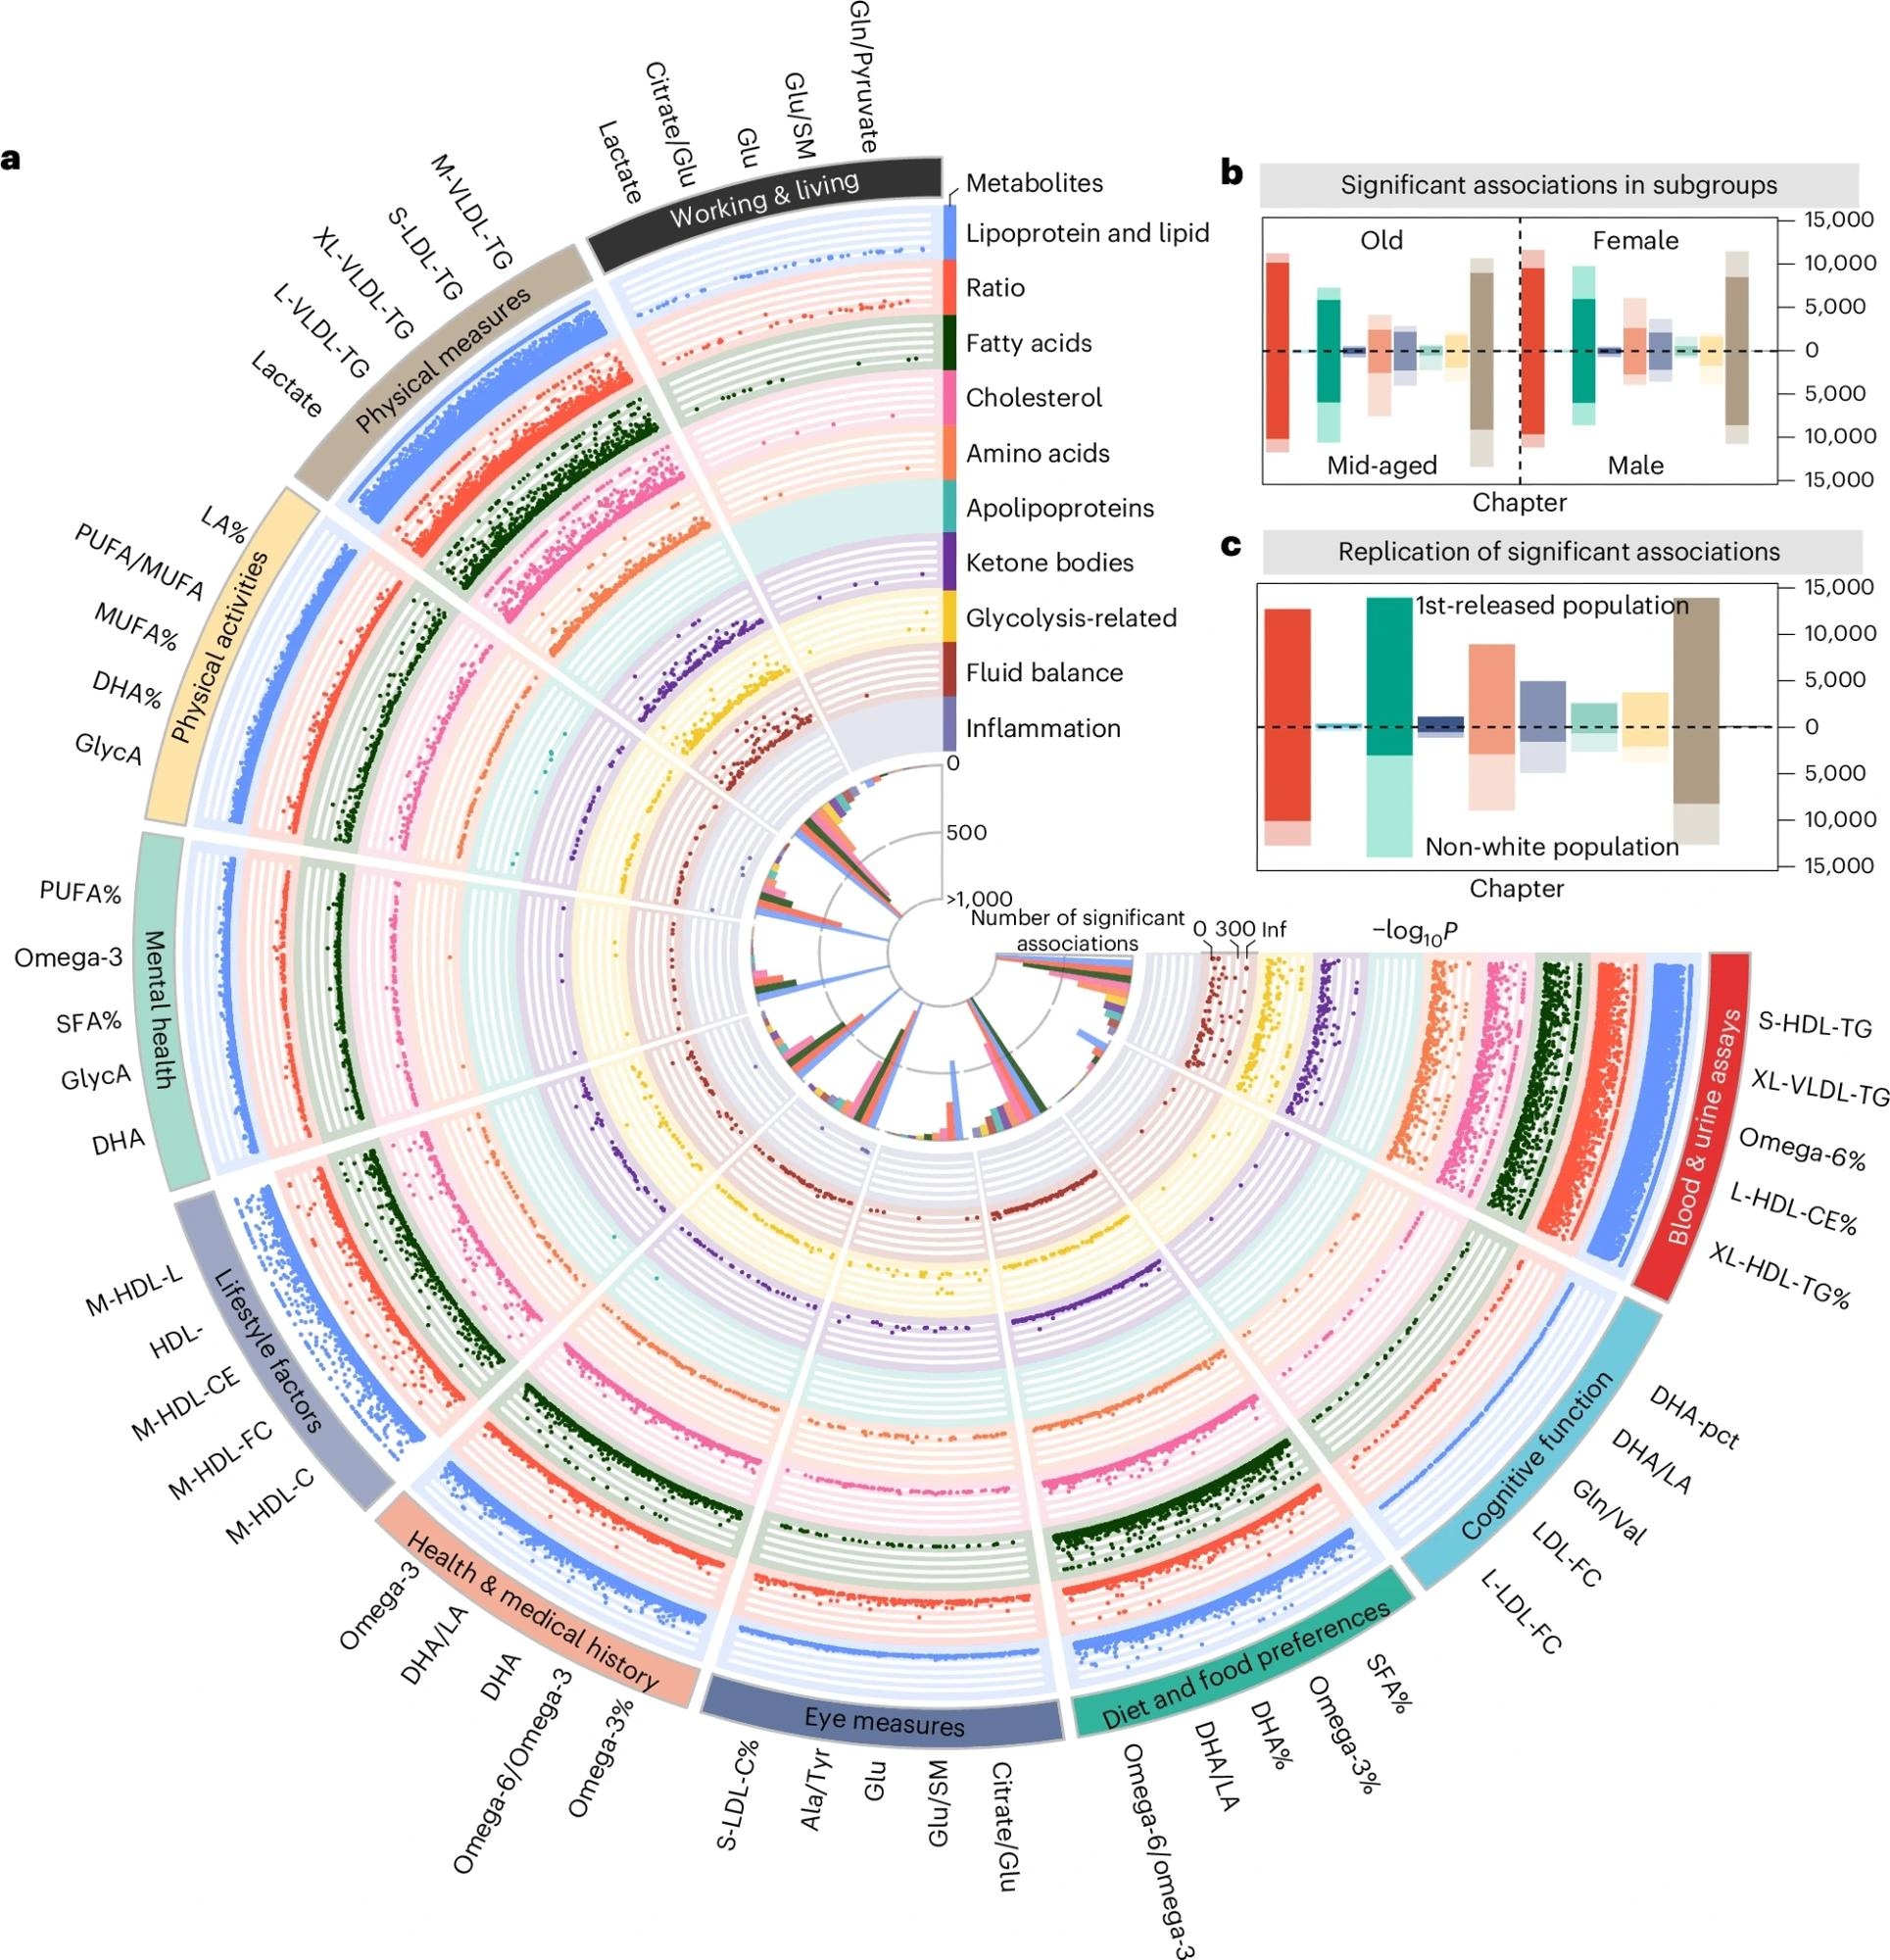
a, Fuji plot of associations between metabolites and health-related traits (n = 62,887). This circular plot displays statistically meaningful associations identified between metabolites and health-related traits. The outer ring lists the top five metabolites with the most statistically significant associations per trait category. Each dot represents a statistically meaningful association, with categories labelled around the perimeter. Colours indicate different metabolite categories. b, Associations between metabolites and health-related traits in subgroup analyses. Bars are coloured by trait categories, with darker segments indicating associations common to both sex or age subgroups. Numbers show the proportion of shared associations within each subgroup. c, Validation of associations in the replication cohort 1 (upper) and 2 (lower). Bars, coloured by trait categories, represent statistically meaningful associations in the derivation cohort. Darker segments indicate associations with P < 0.05 in replication cohorts. Numbers show the replication rate within each cohort. PUFA, polyunsaturated fatty acid; MUFA, monounsaturated fatty acid; DHA, docosahexaenoic acid.
The team established a machine learning (ML)-based metabolic risk score (MetRS) using the top approximately 10% (30) of metabolites per disease, ranked by importance, to assess the discriminative capability of the metabolome. For disease prediction, the MetRS showed moderate to excellent performance. It achieved outstanding performance in predicting future diabetic complications, such as diabetic maculopathy (AUC = 0.921), type 2 diabetes (T2D) with peripheral circulatory complications (AUC = 0.913), and diabetic kidney failure. Integrating the MetRS with demographic data significantly improved performance (yielding AUC>0.8 for 81 incident diseases and showing added value beyond demographics alone in 61.4% of diseases), especially in endocrine, metabolic, digestive, and circulatory disease categories. For prevalent disease classification, the MetRS showed good performance in metabolic, endocrine, and circulatory disease categories, and excellent performance for type 1 diabetes (Type 1 Diabetes Mellitus">T1D) (AUC = 0.944), type 2 diabetes (T2D) (AUC = 0.941), chronic kidney disease (CKD) (AUC = 0.933), and diabetic maculopathy. Creatinine, glycoprotein acetyls (GlycA), albumin, and acetate were the top metabolic markers in both prediction and classification (creatinine and GlycA were most influential across diseases).
Finally, Mendelian randomization and colocalization analyses initially identified 7,570 potential causal relationships, with 454 metabolite-disease pairs remaining statistically robust after sensitivity analyses (excluding diet-associated and highly pleiotropic SNPs). Reverse MR revealed that diseases can influence metabolites (e.g., albumin, CKD reciprocity, L-LDL-TG% influenced by genetic liability to 175 diseases). These analyses revealed potential causal relationships between 454 metabolite-disease pairs, with 402 exhibiting shared genetic determinants through colocalization (e.g., rs11591147 in PCSK9, linking phospholipids in small LDL to cardiovascular diseases, with S-LDL-PL having the most colocalized signals).
Key limitations include: ICD-10 coding may miss early disease stages; NMR coverage versus mass spectrometry; residual dietary confounding in MR; heterogeneity in non-White cohorts; computational constraints that prevent multivariable MR; and a European ancestry focus in genetic analyses.
Conclusions
In summary, the study uncovered 73,639 metabolite-trait associations and 52,836 metabolite-disease associations. The MetRS demonstrated favorable performance in distinguishing between prevalent and incident diseases. Furthermore, 454 potential causal metabolite-disease associations were identified, with 402 sharing common genetic determinants. The interactive atlas (https://metabolome-phenome-atlas.com/) organizes findings into epidemiological associations, patterns of metabolite variation, genomic causal links, and disease discrimination tools. Together, this metabolome and phenome atlas represent a comprehensive tool for better understanding human health and disease.