Mid‐infrared chemical imaging is a quantitative, non‐destructive microscopy method that can be used to visualize a variety of intrinsic biochemical markers in cells, tissues and biofluids, without any need for molecular tags or stains.
This molecular fingerprinting method is powerful and well‐established but new instrumentation is making it applicable to routine analyses in disciplines ranging from microelectronics and materials science to pharmaceutical and biomedical research. This article discusses the application of mid‐infrared chemical imaging to histology using a Spero® microscope from Daylight Solutions.
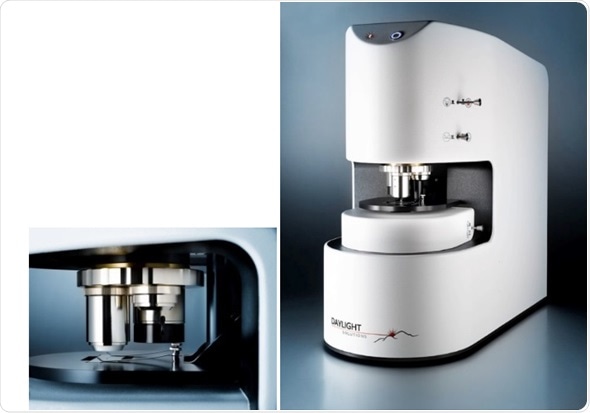
The Spero® microscope achieves large fields of view (FOV) and high resolution by combining tunable quantum cascade laser technology with proprietary wide‐field refractive infrared objectives and large format microbolometer cameras.
Achieving high SNR and diffraction‐limited resolution is no longer the tradeoff it once was and high‐throughput data collection protocols are now being implemented to accelerate sample screening by orders of magnitude.
Until recently, mid‐infrared spectroscopic imaging of tissues, cells, and biofluids was conducted primarily using FT-IR based techniques and multiple decades of research has advanced the science to the point where significant evidence now supports its usage as an adjunctive tool in clinical research and diagnostics.
Yet, with regards to FT‐IR-based microscopes, chemical imaging of tissue micro‐arrays (TMAs) and biopsy tissue sections can be time prohibitive, often taking multiple days to perform a whole slide scan. It is also computationally expensive to process the produced data sets given their magnitude (10’s – 100’s of GBs) [1].
These factors raise a valid question – are all the frequencies that are routinely obtained in a broadband FT‐IR measurement actually needed for digital infrared histopathology? This question can be addressed with Daylight’s latest tool, the Spero® microscope.
This article presents the data obtained from a large human colorectal tissue specimen, as an example case study of this novel capability.
One of the following two ways can be used to achieve the infrared chemical analysis of large sample specimens:
- In the same way as a human pathologist, global screening at low magnification (large FOV) to monitor changes in tissue architecture that are abnormal, followed by clinical classification of an image taken at high magnification (small FOV) from a diagnostic tissue region.
- As in today’s digital pathology, whole slide imaging at an optimized magnification followed by image pixel classification routines to create whole, digitally stained slide images.
Imaging results (Figure 1) mimic a point and shoot philosophy as employed by traditional pathologists. Using the amide I stretching vibration of proteins, an infrared chemical image (Figure 1a) of a large colorectal tissue section (1.6 x 1.0 cm in size) was obtained in 3.8 minutes.
This was realized by using the new, improved 4X magnification objective that offers a FOV of 2 x 2 mm2, diffraction‐limited resolution of 12 μm, and pixel size of 4.25 μm at the amide I band.
This image makes it possible to visualize the tissue microstructure and also detect tissue areas with possible abnormal architecture, requiring additional analysis at high resolution. In addition, the Spero® microscope can be used in live imaging mode, enabling users to survey a sample at video rates at a user-defined wavelength within the range of 900‐1800 cm‐1.
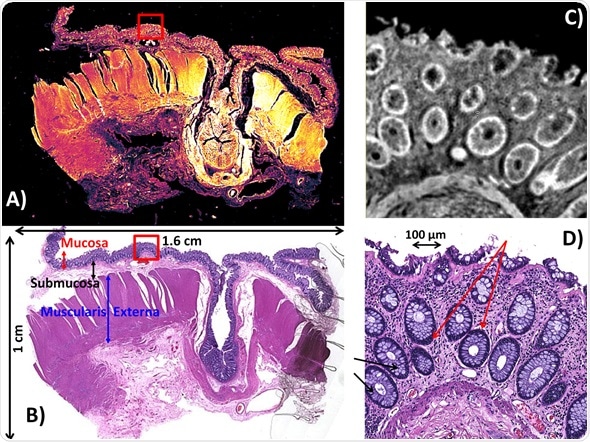
Figure 1. Spero QCL‐based infrared imaging of a colorectal microtome tissue section (192 mm2 in size). A) IR chemical image of the entire section recorded at 1656 cm‐1. The mosaic image was acquired in 3.8 minutes using the enhanced 4X magnification objective having a FOV of 2 x 2 mm2, pixel size of 4.25 μm and diffraction‐limited resolution of about 12 μm at the amide I band. B) Brightfield image of the parallel H&E stained section. C) IR chemical image at a FOV that describes the mucosa recorded at 1656 cm‐1. The image was acquired using the 12.5X magnification objective having a 650 x 650 μm2 FOV, 1.36 μm pixel size and diffraction‐limited resolution of 5 μm at the amide I band. D) Brightfield 10X magnification image of the parallel H&E stained section shown in C. Red arrows indicate colonocytes. Black arrows indicate goblet cells.
After a tissue area with diagnostic importance is detected with the 4X objective, the tissue chemistry within that region can be investigated with the 12.5X objective. Figure 1C shows an
IR chemical image acquired at the amide I stretch of proteins, using the 12.5X magnification objective at a FOV appropriate for assessing the mucosa. Figure 1D shows a H&E stained image of the parallel microtome section. Direct comparison to this H&E stained image clearly shows that the level of resolvable detail is adequate to detect the salient features of tissues.
If preference is given to a whole slide screening protocol, long data collection times and image cube file size are the predominant bottlenecks in mid‐infrared chemical imaging. These issues can be addressed by Spero® QCL‐based infrared imaging that harnesses the flexibility and power of the tunable laser source.
Often, diagnostic spectral features are situated at a reduced number of frequencies across the entire spectrum. These specific frequencies can be targeted by programming the laser, proportionately reducing the acquisition time and the data file size. In addition, it would be practical to consider the image definition needed to resolve the diagnostic features of the sample under analysis.
Amide I intensity images, shown in Figure 2A and 2B, were captured using the 12.5X (3x3 Mosaic) and 4X infrared objectives respectively of the same colon tissue region.
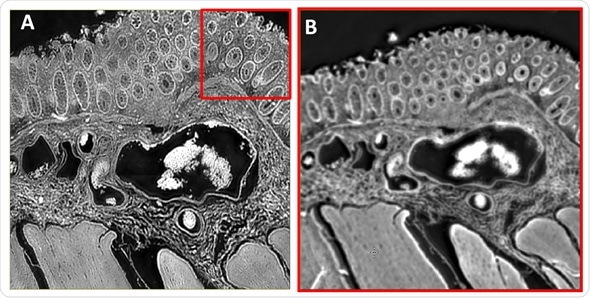
Figure 2. Comparison of images acquired using the 12.5X and enhanced 4X IR objectives. A) Mid‐infrared chemical image at 1656 cm‐1 of a colorectal tissue section describing a cross section through the mucosa, submucosa and muscularis externa. The 3x3 mosaic image was acquired using the 12.5X magnification objective. B) Mid‐infrared chemical image at 1656 cm‐1 of the same tissue area described in B). The single camera tile image was acquired using the enhanced 4X magnification objective.
The mosaic image in 2A delivers excellent spatial resolution. Also, the image in 2B, captured with the 4X objective, offers clarity that is adequate to resolve the tiny features in tissue such as the colonocytes surrounding the crypts’ goblet cells and the blood vessel walls (a reference is given by the colored arrows in the stained image shown in Figure 1D).
Raw absorbance single‐pixel spectra, shown in Figure 3, were acquired from the infrared images shown in Figure 2. After extracting the pixel spectra at the same X,Y co‐ordinates on both images, they were plotted offset from each other for better clarity. On closer scrutiny, good spectral reproducibility is observed between the objectives.
This means, spectral purity did not undergo any considerable dilution when spatial resolution was reduced. As a result, the 4X magnification objective can be practically used for whole slide screening without losing any prominent diagnostic information.
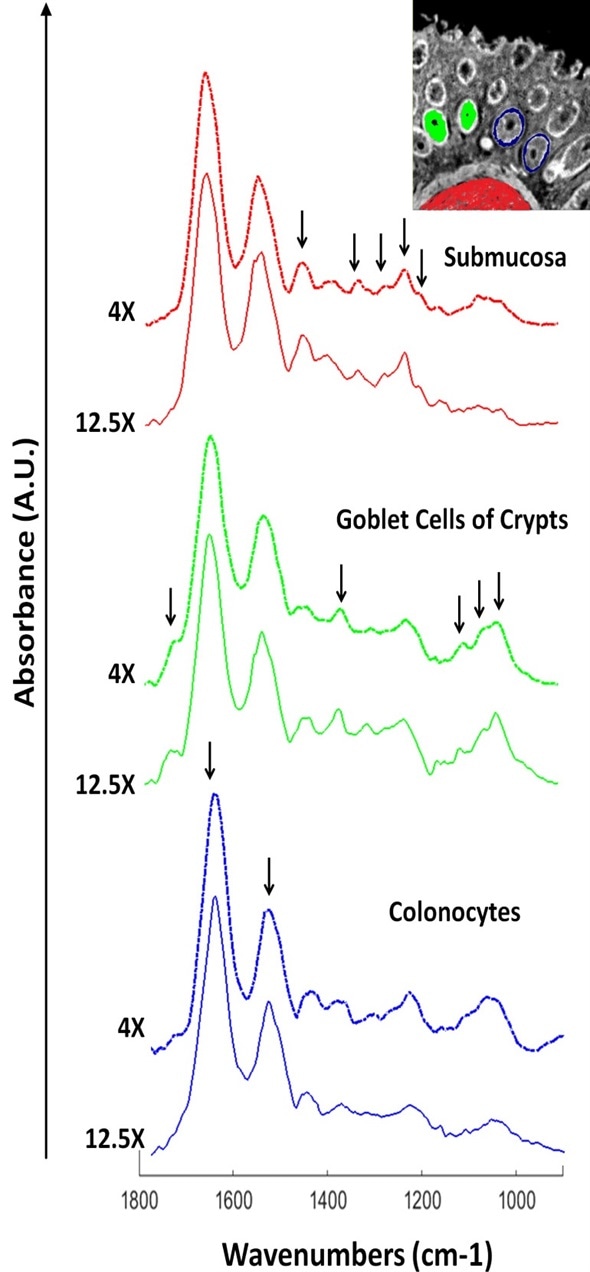
Figure 3. Extracted raw pixel spectra from the 12.5X and 4X infrared images described in figure 2. Spectra were extracted from the same X, Y co‐ordinates for both images. Prominent bands for tissue classes are highlighted.
For the main tissue structures of the submucosa and mucosa, key spectral differences are also seen. For instance, the goblet cells offer several characteristic bands that are located at 1044, 1076, 1120 and 1374 cm‐1.
These bands are related to mucin. At 1740 cm‐1, a strong lipid ester band is also noticed. In contrast, several strong bands are provided by the submucosa that can be correlated to the structural protein collagen with bands located at 1204, 1236, 1280, 1136 (amide III) and 1452 cm‐1, respectively.
A list of spectral descriptors was built using this a priori knowledge about the chemistry of the tissue types present in colorectal tissue. These spectral descriptors (Table 1) targeted the most important bands and provided optimal discriminatory power.
Table 1. List of spectral descriptors useful to differentiate different tissue classes and train a Random Forest Classifier
|
Spectral Descriptor Number
|
Peak Height Ratio Frequencies (cm-1)
|
Baseline Points (cm-1)
|
|
1
|
1652/1736
|
1796, 1480
|
|
2
|
1652/1540
|
1796, 1480
|
|
3
|
1452/1376
|
1480, 1352
|
|
4
|
1452/1336
|
1480, 1352
|
|
5
|
1236/1376
|
1352, 1152
|
|
6
|
1236/1280
|
1352, 1152
|
|
7
|
1236/1204
|
1352, 1152
|
|
8
|
1044/1076
|
1000, 1152
|
|
9
|
1044/1120
|
1000, 1152
|
|
10
|
1044/1236
|
1000, 1796
|
At different peak maxima, 12 sparsely distributed frequencies were employed to produce peak height ratio descriptors using five more baseline correction frequencies. This equates to a major reduction in image dimensionality from 226 to 17. As a result, both a time and data size advantage can be achieved by recording images only at the 17 salient frequencies with the sparse collection mode in the Spero® microscope.
In order to document collection time and data size statistics, infrared imaging datasets were recorded using the new, improved 4X infrared objective as well as the 12.5X objective. After collection, the multisensory imaging tool ImageLab [2] was loaded with infrared imaging datasets for data visualization and additional chemometric analysis.
QCL-based spectral staining
Six main tissues are observed within the tissue section studied. These include the goblet cells, muscularis externa, submucosa, lamina propria, and colonocytes. Blood cells can also be seen nestled in the center of the blood vessel walls.
The multivariate imaging toolbox within ImageLab was used to extract infrared spectra that represented each class from a single tile of the mosaic image collected using the 4X objective with 17 frequencies. Using this data, 10 spectral descriptor values (Table 1) were generated for each tissue pixel spectrum.
Subsequently, these were used to train a Random Forest classifier using 75 trees. Figure 4A shows the result of applying the trained Random Forest classifier to the 4x infrared image recorded in Figure 2. It also shows a good resemblance to the H&E stained image shown in Figure 4B.
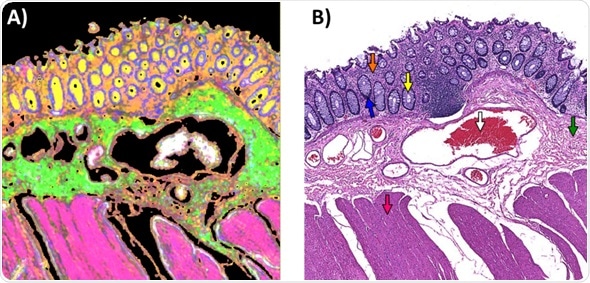
Figure 4. A) Random Forest Classification Imaging Result applied to an infrared image recorded from the unstained parallel tissue section shown in the Brightfield H&E image in B). The colored arrows indicate the 6 tissue classes as follows (white = blood, Green = Submucosa, Orange = Lamina Propria, Yellow = Goblet cells of Crypts, Blue = Colonocytes, Pink =Muscularis Externa. These colors match the spectrally stained color of the Random Forest classified Image in A).
Conclusion
QCL-based infrared chemical imaging has the ability to deliver high throughput, high resolution chemical images on a timescale that could revolutionize digital infrared spectral histopathology. Table 2 summarizes the data storage reduction and speed gains that are made possible by the Spero® microscope.
Table 2. Instrument and imaging data parameters when comparing the 12.5X and 4X infrared objectives using a full scan or sparse frequency data collection protocol
|
|
Full Scan
900-1800wn-1
(226 Frequencies)
|
Sparse Frequencies
(17 Frequencies)
|
Full Scan
900-1800wn-1
(17 Frequencies)
|
Sparse Frequencies
(17 Frequencies)
|
|
Objective
|
High Mag
|
High Mag
|
Enhanced Low Mag
|
Enhanced Low Mag
|
|
Magnification
|
12.5X
|
12.5X
|
4X
|
4X
|
|
Numerical Aperture
|
0.7
|
0.7
|
0.3
|
0.3
|
|
Pixel Size (μm)
|
1.35
|
1.35
|
4.25
|
4.25
|
|
Camera Tile FOV (mm)
|
0.65 x 0.65
|
0.65 x 0.65
|
2 x 2
|
2 x 2
|
|
Spatial Resolution (μm) (@1656 cm-1)
|
5
|
5
|
12
|
12
|
|
Tile Pixel Spectra
|
230,400
|
230,400
|
230,400
|
230,400
|
|
Tile Collection Time (mins)
|
5.35
|
1.3
|
5.35
|
1.3
|
|
Tile Data Size (MB)
|
203.4
|
15.3
|
203.4
|
15.3
|
|
Mosaic Configuration
|
25 x 19
|
25 x 19
|
8 x 6
|
8 x 6
|
|
Mosaic Size (mm)
|
16.25 x 12.35
|
16.25 x 12.35
|
16 x 12
|
16 x 12
|
|
Mosaic Pixel Spectra
|
110 Megapixel
|
110 Megapixel
|
11.05 Megapixel
|
11.05 Megapixel
|
|
Mosaic Collection Time (hrs)
|
42.35
|
10.29
|
4.2
|
1.04
|
|
Mosaic Data Size (GB)
|
92.62
|
7.28
|
9.76
|
0.73
|
In the case study, the image of a large colon tissue section, measuring 192 mm2, can be captured in an hour by using the newly released enhanced low magnification objective. The resultant image contains 11 million pixel spectra (each pixel having an independently measured spectral response) with less than 1 GB of storage space.
The spectroscopic images would compose ca. 110 million pixel spectra if diffraction-limited spatial resolution was a requisite for the diagnostic application. The collection time can be successfully quartered and compose a tenth of the data storage space by using a frequency targeting protocol.
QCL-based infrared spectroscopy is a dynamic and exciting area that is set to expand rapidly in the years to come. The reader is referred to many recent contributions to the area [3-5], for further evidence of the potential benefits of this new technology. It indeed has very bright prospects.
Here, a large colorectal tissue section was studied using the Spero® QCL microscope and highlighted:
- A new proprietary 4X wide-field objective that offers spatial resolution on the order of a single cell (12 μm at 1656 cm-1 : amide I stretch of proteins)
- High definition, diffraction-limited, infrared images using the 12.5X magnification objective, which offers a field of view that excels FTIR-based systems
- Significant data size reduction through frequency targeting protocols
- Significant time benefits using a frequency targeting protocol to capture infrared imaging data
- Successful supervised algorithm (Random Forest) construction for digital spectral staining using a considerably reduced number of absorbance intensities
Acknowledgments
Produced from content authored by Benjamin Bird, Senior Applications Scientist at Daylight Solutions.
References and Further Reading
- P. Bassan, M. J. Weida, J. Rowlette, and P. Gardner, Analyst, 2014, 139(16), 3856. http://dx.doi.org/10.1039/C4AN00638K
- ImageLab, Epina, Austria: http://www.imagelab.at/
- M. J. Pilling, A. Henderson, B. Bird, M.D. Brown, N.W. Clarke, P. Gardner, Faraday Discuss., 2016 Advance Article http://dx.doi.org/10.1039/C5FD00176E
- C. Hughes, G. Clemens, B. Bird, T. Dawson, K. M. Ashton, M. D. Jenkinson, A. Brodbelt, M. Weida, E. Fotheringham, M. Barre, J, Rowlette and M. J. Baker, Scientific Reports 6, Article Number: 20173 http://www.nature.com/articles/srep20173
- H. Sreedhar, V. K. Varma, F. V. Gambacorta, G. Guzman and M. J. Walsh, Biomedical Optics Express,2016, 7(6), 2419 http://dx.doi.org/10.1364/BOE.7.002419

About Daylight Solutions
Daylight Solutions’ molecular detection and imaging products consist primarily of lasers, sensors, and imaging systems, all of which leverage the company’s mid-infrared, quantum cascade laser (QCL) technology. This core technology provides a versatile platform from which new products are developed, allowing the company to serve markets that include Scientific Research, Life Sciences, Defense, and Commercial.
The company is committed to innovation and introduced the world’s first broadly tunable mid-infrared laser system for scientific research, the world’s first semiconductor-based laser for protecting aircraft against shoulder-fired missiles, and the world’s first mid-infrared laser-based microscope for real-time biochemical imaging and material analysis.
Daylight Solutions consists of two separate business units. In 2009 the company created a wholly owned subsidiary to address the specific requirements of the defense industry. As a subsidiary, Daylight Defense developed the business and manufacturing infrastructure necessary to deliver classified, military-hardened products to the government. The Commercial business unit supports all other non-defense activities ranging from life sciences to industrial and consumer products.
Daylight Solutions and Daylight Defense are both ISO-9001 certified and possess advanced manufacturing capabilities.
Sponsored Content Policy: News-Medical.net publishes articles and related content that may be derived from sources where we have existing commercial relationships, provided such content adds value to the core editorial ethos of News-Medical.Net which is to educate and inform site visitors interested in medical research, science, medical devices and treatments.