Sponsored Content by Bio-TechneReviewed by Louis CastelJan 11 2024
Maurice is an all-in-one cIEF and CE-SDS platform that provides high-resolution, reproducible purity, identity, and heterogeneity analysis of biotherapeutic proteins. The streamlined, automated workflow minimizes hand-on-time, reducing potential error and user variability.
Maurice can be controlled with Compass for iCE software. It is also supported by WatersTM Empower® 3 chromatography data software for incorporation into the laboratory equipment.
This explores data acquisition and analysis for a monoclonal antibody using an Empower® controlled Maurice. It also highlights a new feature that enables users to visualize cIEF data as a three-dimensional (3D) spectrum for a complete understanding of how proteins focus in a single image.
Getting started
To control Maurice with Empower®, the following are needed: Empower® 3 FR2 SR2 (Win7); Empower® 3 FR4, FR5, or FR6 (Win10); Waters TM LAC/E32 server with Empower® system control license; and a Maurice instrument connected directly to the WatersTM LAC/E3 server. Please also ensure that the software included in the Maurice Empower® Control kit (ProteinSimple, 104-0040) is installed on the Maurice system.
The Empower® Control kit is only compatible with designated platforms for Waters® Empower software, as outlined in the relevant Empower Release Notes.
It is advisable to connect only one Maurice instrument to each Waters® Empower data acquisition computer, with no additional instruments or instrument control software connected or installed.
Once Maurice is Empower® control enabled, prepare samples and consumables as instructed in the appropriate Maurice Product Insert, and produce a sample set (using the Sample Set Generator (as shown in Figure 1).
For more information on cIEF or CE-SDS methods, how to monitor or pause a batch, clean or purge a cartridge, or view your data using Empower®, see the Maurice Empower® Control Software User Guide.
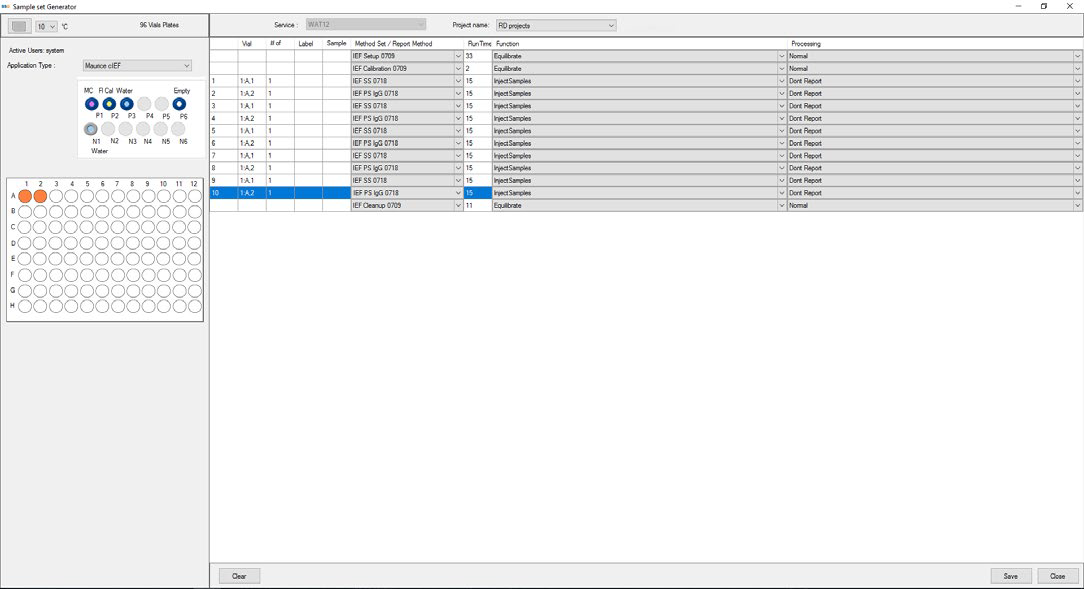
Figure 1. Maurice cIEF method created using Empower® software. Image Credit: Bio-Techne
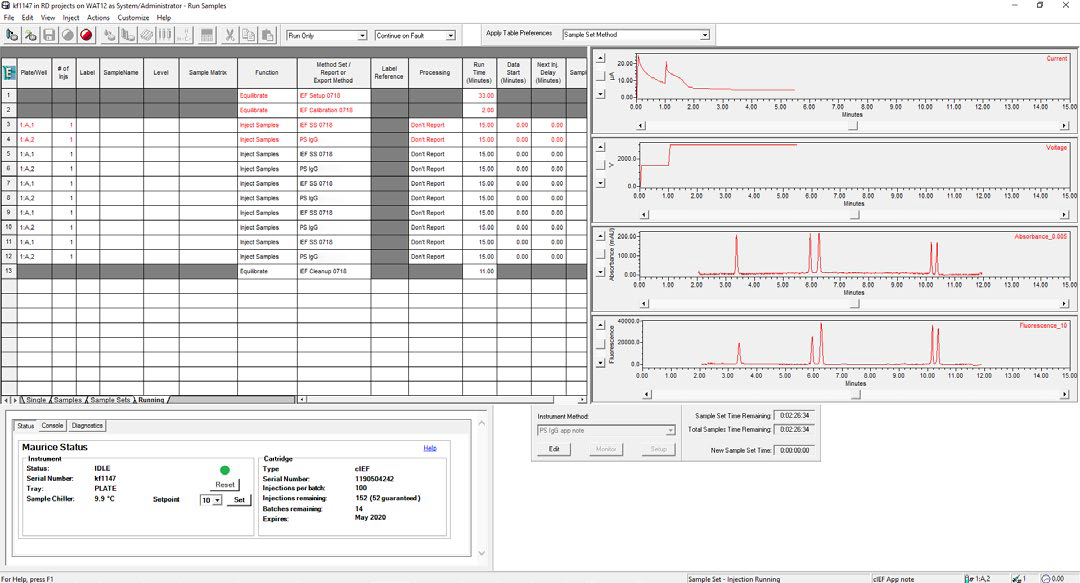
Figure 2. cIEF separation of the System Suitability monitored in real-time using Empower® software. Focusing voltage, current, and absorbance can be monitored in real-time, and fluorescence images are available for viewing for completed injections. Image Credit: Bio-Techne
Running cIEF methods
Monitoring and viewing cIEF data
Samples assessed with the Maurice cIEF method were detected using absorbance, and, for elevated sensitivity, native fluorescence. The Maurice cIEF System Suitability (ProteinSimple, 046-044) was prepared as outlined in the Product Insert and run utilizing the default System Suitability method.
Following this, 0.1 mg/ mL of the IgG Standard (ProteinSimple, 046-039) was prepared with pI markers 4.05 and 8.40 in 2 % 3–10 Pharmalyte/2 % 5-8 Pharmalyte, 10 mM arginine, 10 mM iminodiacetic acid, and 2 M urea.
Ten replicate injections of the IgG standard were run for each batch and focused for 1 minute at 1500 V followed by 8 minutes at 3000 V. The samples were run using a Maurice controlled by Empower® and a Maurice controlled by Compass for iCE.
Real-time monitoring of sample separation on the Maurice controlled by Empower® was performed using the Empower® “Run Samples” window (see Figure 2).
The focus series can be visualized spatially through a 3D spectral plot (shown in Figure 3). This allows the user to identify when peaks achieve optimal focusing in one image, eliminating the need to compare a sequence of two-dimensional (2D) images taken during the separation in ten-second intervals.
Plots appear alongside time on the x-axis, absorbance units on the y-axis, and pixel position on the z-axis.
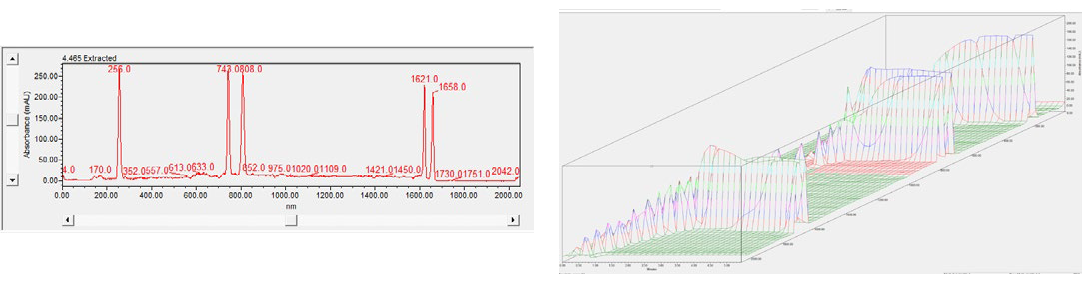
Figure 3. Spectrum data for the System Suitability in 2D (left) and 3D (right). The 3D data help you see when a peak reaches focus in one 3D image, instead of comparing a series of 2D images take every 10 seconds during the sample separation. Image Credit: Bio-Techne
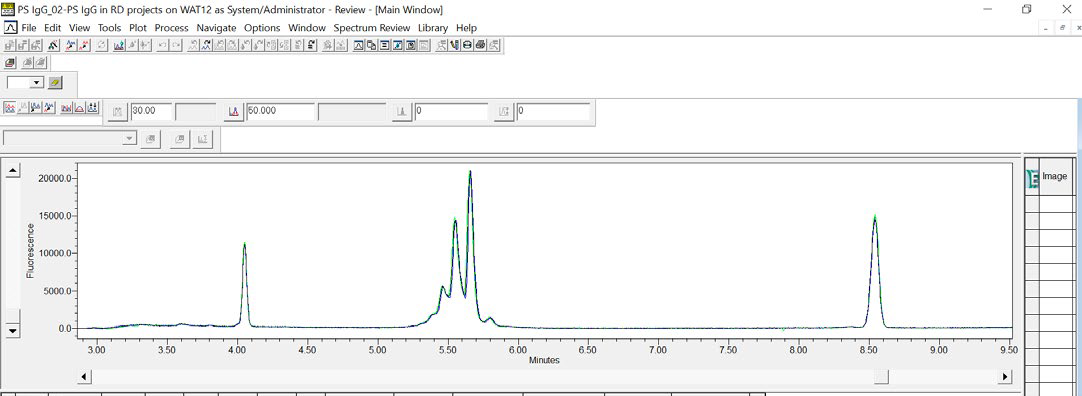
Figure 4. An overlay of three consecutive cIEF injections of the IgG Standard visually demonstrates the data reproducibility for samples run on an Empower® controlled Maurice. Image Credit: Bio-Techne
Reproducible and equivalent cIEF results
To assess reproducibility, the data generated both in Empower® and Compass for iCE were analyzed. Figure 4 shows an overlay of three consecutive injections of the IgG Standard in Empower® software. Qualitative analysis of the data revealed data consistency, with coefficients of variation (CVs) all below 2.9 % for 10 injections (refer to Table 1).
Table 1. Data summary of IgG Standard peaks with a percent composition >10 %, run on either an Empower® controlled Maurice or Compass for iCE-controlled Maurice. The data was analyzed with Empower® and proved the data was consistent between both software platforms, and within expected run-to-run and sample prep variance, with percent peak compositions all within 0.5 %, and reproducible with CVs < 2.9 %. Source: Bio-Techne
| |
EMPOWER® % COMPOSITION (FLUORESCENCE) |
COMPASS FOR ICE % COMPOSITION (FLUORESCENCE) |
| INJECTION |
PEAK 2 |
PEAK 3 |
PEAK 4 |
PEAK 2 |
PEAK 3 |
PEAK 4 |
| 1 |
13.76 |
36.19 |
43.48 |
13.88 |
36.82 |
43.72 |
| 2 |
13.82 |
36.25 |
42.90 |
13.95 |
36.61 |
43.40 |
| 3 |
12.94 |
37.47 |
44.08 |
14.10 |
36.35 |
43.76 |
| 4 |
13.44 |
36.67 |
42.54 |
14.00 |
37.47 |
43.75 |
| 5 |
13.98 |
36.58 |
43.33 |
13.69 |
37.86 |
44.38 |
| 6 |
13.56 |
36.11 |
42.60 |
13.78 |
37.57 |
43.75 |
| 7 |
13.13 |
37.07 |
44.00 |
13.81 |
36.72 |
44.70 |
| 8 |
13.75 |
35.45 |
42.89 |
14.17 |
36.43 |
43.14 |
| 9 |
12.88 |
36.87 |
42.93 |
13.87 |
36.94 |
43.87 |
| 10 |
13.59 |
36.74 |
44.05 |
14.43 |
37.78 |
43.36 |
| Mean |
13.48 |
36.54 |
43.28 |
13.97 |
37.06 |
43.78 |
| % RSD |
2.83 |
1.55 |
1.38 |
1.57 |
1.52 |
1.06 |
The quantitation additionally confirmed the equivalency in data generated using an Empower® controlled Maurice and a Compass for iCE-controlled Maurice, The percent peak composition for peaks with a percent composition above 10 % were all within 0.5 %, well within expected run-to-run and sample preparation variance.
The observed pI between data collected on both systems further substantiated the equivalency of the data. The average pI for all peaks was within 0.02 pI units (as detailed in Table 2)
Table 2. IgG Standard pI values, with % CVs in parenthesis, reported in runs controlled by either Empower® or Compass for iCE. Data was analyzed using Empower®. Source: Bio-Techne
| AVERAGE pl, (N=10) |
| PEAK |
EMPOWER® (% CV) |
COMPASS FOR ICE (% CV) |
| 1 |
5.42 (0.18 %) |
5.40 (0.18 %) |
| 2 |
5.46 (0.08 %) |
5.46 (0.04 %) |
| 3 |
5.55 (0.09 %) |
5.55 (0.04 %) |
| 4 |
5.66 (0.08 %) |
5.66 (0.04 %) |
| 5 |
5.80 (0.14 %) |
5.79 (0.07 %) |
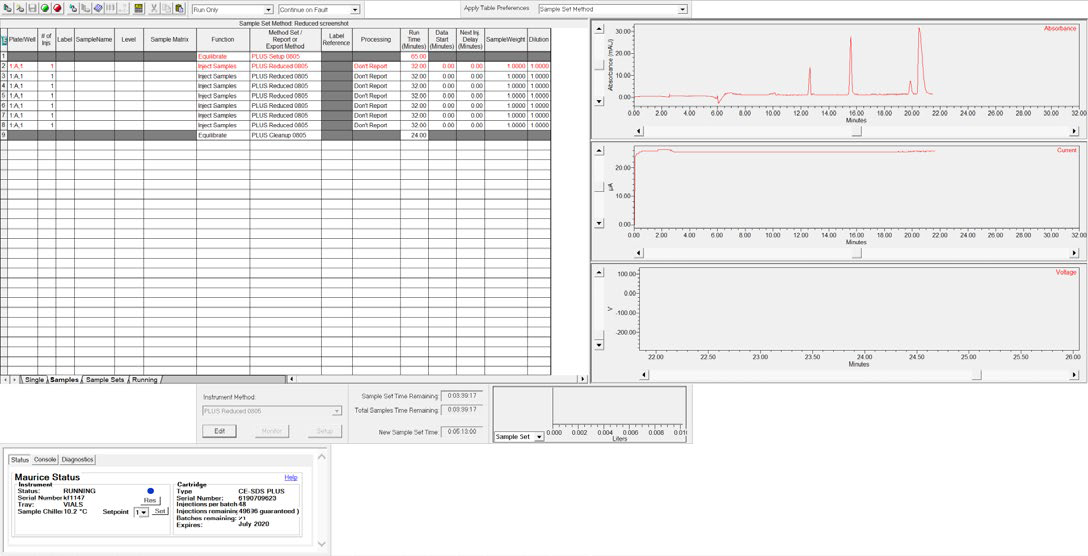
Figure 5. CE-SDS separation of the ProteinSimple IgG Standard monitored in real-time using Empower® software. Image Credit: Bio-Techne
Running CE-SDS methods
Monitoring and viewing CE-SDS data
As recommended by the ProteinSimple CE-SDS IgG Standard Product Insert, 1.0 mg/mL of reduced ProteinSimple IgG Standard was prepared. It was then run as 10 replicates on an Empower® controlled Maurice and a Compass for iCE-controlled Maurice.
The samples were separated for 25 minutes at 5750 V and sample separations were monitored in real-time in the Empower® “Run Samples” window (see Figure 5).
Reproducible and equivalent CE-SDS results
Using Empower® software, an overlay of three consecutive injections of the IgG Standard can be created, which visually establishes the data reproducibility achieved using Maurice (see Figure 6).
Quantification of the data further confirms the consistency of the results, as all CVs were under 1.0 % when samples were run by either Empower® or Compass for iCE (see Table 3).
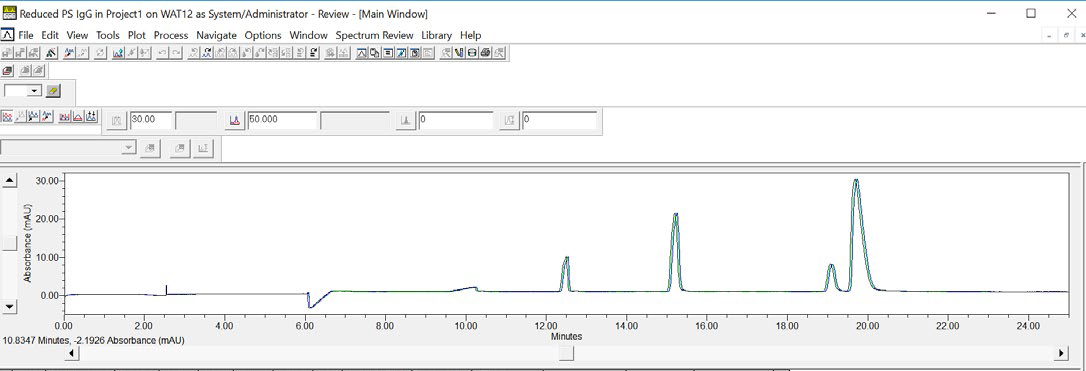
Figure 6. An overlay of three consecutive CE-SDS injections of reduced IgG Standard demonstrates the data reproducibility for samples run on an Empower® controlled Maurice. Image Credit: Bio-Techne
Table 3. Data summary for the % peak area of reduced ProteinSimple IgG Standard run on either an Empower® controlled Maurice or Compass for iCE-controlled Maurice. The data was analyzed with Empower® and is reproducible with CVs < 0.7 %, and equivalent between both software platforms with percent peak areas all within 0.3 %. Source: Bio-Techne
| |
EMPOWER® |
COMPASS FOR iCE |
| INJECTION |
LC % PEAK AREA |
NGHC % PEAK AREA |
HC % PEAK AREA |
LC % PEAK AREA |
NGHC % PEAK AREA |
HC % PEAK AREA |
| 1 |
24.09 |
8.96 |
58.51 |
24.55 |
8.87 |
57.92 |
| 2 |
24.05 |
9.00 |
58.53 |
24.40 |
8.88 |
58.09 |
| 3 |
24.15 |
8.98 |
58.35 |
24.30 |
8.92 |
58.18 |
| 4 |
24.14 |
8.93 |
58.44 |
24.36 |
8.90 |
58.22 |
| 5 |
24.01 |
8.95 |
58.36 |
24.31 |
8.88 |
58.26 |
| 6 |
24.07 |
8.99 |
58.48 |
24.31 |
8.87 |
58.29 |
| 7 |
24.09 |
8.98 |
58.49 |
24.39 |
8.87 |
58.11 |
| 8 |
24.05 |
8.97 |
58.45 |
23.97 |
8.92 |
58.66 |
| 9 |
23.76 |
8.86 |
59.04 |
24.35 |
8.91 |
58.20 |
| 10 |
24.08 |
8.99 |
58.54 |
24.24 |
8.88 |
58.33 |
| Mean |
24.05 |
8.96 |
58.52 |
24.32 |
8.89 |
58.23 |
| % RSD |
0.46 |
0.46 |
0.33 |
0.61 |
0.23 |
0.33 |
Conclusions
Characterizing biotherapeutics with Maurice is simple. Users are only required to prepare their samples and reagents, load cIEF or CE-SDS cartridges (depending on the application being run), and set up their method parameters. Maurice handles all other tasks, providing users with reliable and precise results.
CiEF and CE-SFS data are available in 10 to 35 minutes per CE-SDS injection, respectively. This allows for a quick examination of protein drug quality and identity results.
Maurice can be operated using WatersTM Empower® software, which allows seamless control of Maurice systems with preservation of all key functions and full regulatory compliance (including 21 CFR Part 11 controls) for frontline security and data integrity.
This study characterized the ProteinSimple IgG Standard using Empower® and Compass for iCE. All CE-SDS and cIEF data were analyzed in Empower® and evaluated for reproducibility and quantification with a Compass for iCE- or Empower®-controlled Maurice.
Quantifying the cIEF and CE-SDS data through Empower® showcased outstanding robustness, with CVs below 2.9 % and 0.7 %, respectively. Results from injections performed using Compass for iCE were consistent with those created using Empower®, confirming the consistency of outcomes regardless of the software platform used to run Maurice.
The runs from each platform reported pIs within 0.02 units of each other, and cIEF percent peak compositions were within 0.5 % during cIEF data analysis. CE-SDS results were ALSO equivalent, with calculated LC, NGHC, and HC percentages all falling within 0.3 % of each other.
Maurice has always provided flexibility to seamlessly transition between cIEF and CE-SDS methods. With Empower®, researchers now have the option to operate and analyze data within one program, ensuring the data reproducibility you expect and the assurance that results will always be equivalent.
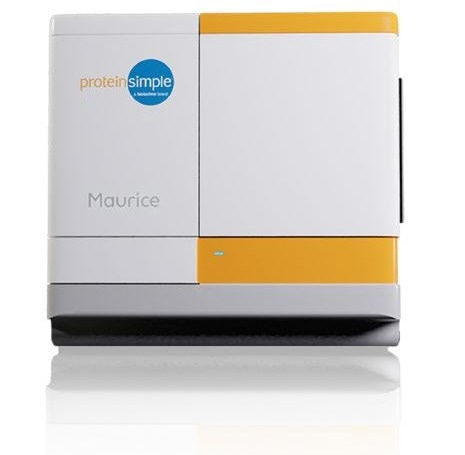
Image Credit: Bio-Techne
About Bio-Techne

Bio-Techne Corporation is a leading developer and manufacturer of high-quality purified proteins - notably cytokines and growth factors, antibodies, immunoassays, as well as biologically active small molecule compounds - which are sold to biomedical researchers and clinical research laboratories; these operations constitute the core Biotech Division, headquartered in Minneapolis, Minnesota.
The Protein Platform Division manufactures innovative protein analysis tools under the ProteinSimple brand name that greatly automate western blotting and immunoassay practices. The Diagnostics Division manufactures FDA-regulated controls, calibrators, blood gas, and clinical chemistry controls for OEM customers and clinical customers. Bio-Techne products assist scientific investigations into biological processes and the nature and progress of specific diseases. They aid in drug discovery efforts and provide the means for accurate clinical tests and diagnoses.
With thousands of products in its portfolio, Bio-Techne generated approximately $563 million in net sales in fiscal 2017 and has approximately 1,800 employees worldwide.
Sponsored Content Policy: News-Medical.net publishes articles and related content that may be derived from sources where we have existing commercial relationships, provided such content adds value to the core editorial ethos of News-Medical.Net which is to educate and inform site visitors interested in medical research, science, medical devices and treatments.