Sponsored Content by SCIEXReviewed by Olivia FrostOct 7 2026
The ZenoTOF 8600 system can be used in conjunction with ZT Scan DIA 3.0 to achieve deep proteome coverage from 50–250 ng of sample with sliding Q1 isolation windows (as low as 1 Da). These powerful capabilities redefine quantitative proteomics, improving both selectivity and experimental precision.
Using this approach, it was possible to identify a total of 9214 protein groups (94,974 precursors) from 250 ng of a commercial human cell (K562) lysate digest utilizing a 38-minute nanoflow gradient.
It was possible to robustly quantify 92% of these proteins with coefficients of variation ≤20%, showcasing this approach’s reproducibility and quantitative strength.
The powerful combination of the ZenoTOF 8600 system and ZT Scan DIA 3.0 further expands the reliability and depth of biomarker identification and quantitation. High-confidence proteomics is enabled by this approach, thereby better supporting key developments in transformative medicine.
Key features of ZT Scan DIA 3.0 on the ZenoTOF 8600 system
This approach offers a range of benefits.
Superior quantitation
ZT Scan DIA 3.0 was found to boost quantifiable protein groups and precursors in this study by 11.5% and 21.4%, respectively, versus variable-window Zeno SWATH DIA.
Enhanced protein identification
Using ZT Scan DIA 3.0 with a 2 Da Q1 width yields an 8.5% increase in protein identification in a human cell lysate digest compared with variable-window Zeno SWATH DIA.
Ultra-selective DIA for precision proteomics
ZT Scan DIA 3.0 extends DIA experiments’ usable design space by enabling Q1 isolation widths as low as 1 Da. This capability unlocks a new selectivity regime and improves quantitative confidence beyond that of conventional flexible DIA.
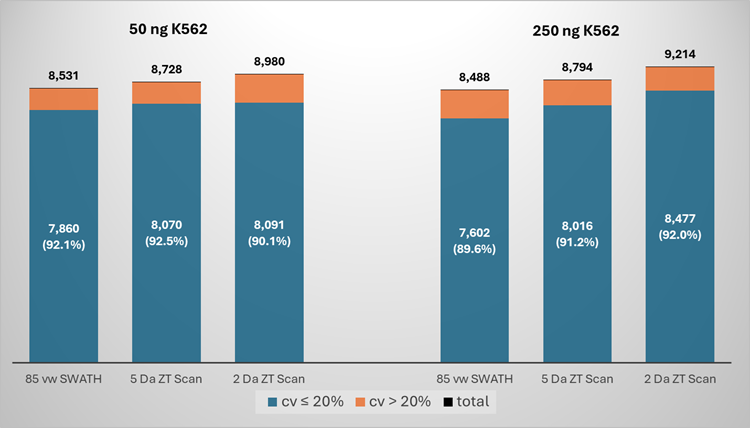
Figure 1. Protein groups identified and quantified from the indicated loadings of K562 digest. Data-independent acquisition was performed on a ZenoTOF 8600 system using either 85 variable-window Zeno SWATH DIA or ZT Scan DIA 3.0, with Q1 isolation window widths of 5 Da or 2 Da. Image Credit: SCIEX
The ZenoTOF 8600 system boasts advanced duty-cycle efficiency and ion transmission, significantly increasing the potential for protein identification, quantitation, and proteome coverage.1
ZT Scan DIA was originally launched by SCIEX in 2024,3 leveraging a continuously scanning quadrupole for precursor isolation. This enabled excellent qualitative and quantitative performance versus Zeno SWATH DIA and other traditional discrete-window DIA methods.
This acquisition method was expanded to ZT Scan DIA 2.0 in 2025, accommodating a broader mass range and enabling greater method optimization flexibility.2
ZT Scan DIA 2.0 allowed users to customize Q1 window widths, but ZT Scan DIA 3.0 has fundamentally extended these customization capabilities to open up previously inaccessible experimental possibilities.
This article introduces ZT Scan DIA 3.0, a new development that enables Q1 window widths as low as 1 Da and further limits the chimeric nature of DIA MS/MS spectra.
Spectra acquired via this approach are easier to interpret, offering more reliable, accurate quantitation by minimizing fragment interference originating from neighboring precursors.
Interferences can influence peptide identification and quantitation in instances where samples are complex or have a high dynamic range. Using the ZT Scan DIA 3.0, researchers can now dial in selectivity, based on the biological question, by customizing the sliding Q1 window width. This allows trade-offs to be made between specificity, coverage, and quantitative rigor.
Selectivity, not just sensitivity, is another key limiting factor in DIA performance. The increased precursor selection resolution facilitated by ZT Scan DIA 3.0 further enhances protein identification and provides more accurate, reliable quantitation.
Methods
Sample preparation
Human K562 lysate tryptic digest was purchased from Promega before being diluted in water containing 0.1% formic acid.
Chromatography
An ACQUITY M-Class LC system (Waters, USA) with an IonOpticks Aurora Ultimate XS C18 nanoflow column (25 cm x 0.075 mm) was used to perform chromatographic separations. This was performed using the gradient described in Table 2, with mobile phase A comprised of water with 0.1% formic acid and mobile phase B comprised of acetonitrile with 0.1% formic acid.
The column was heated to 50 °C. Flow rate was set to 250 nL per minute, with an injection volume of 1 µL for the 50 ng injections and 2 µL for the 250 ng injections. Four replicate injections were completed for each loading and MS acquisition method.
Mass spectrometry
A ZenoTOF 8600 system analyzed samples using the horizontal nanoflow probe, with ion source parameters set as follows:
- Gas 1 set to 10 psi
- Curtain gas set to 35 psi
- Ion spray voltage set to 2100 V
- Interface temperature set to 250 °C
A comparison was performed between a SWATH DIA method with a precursor isolation range of 400–900 Da and 85 variable-width SWATH windows and ZT Scan DIA 3.0 methods with Q1 isolation windows of 5 Da and 2 Da.
Table 1 describes the DIA method parameters. It should also be noted that zeno trapping was utilized for all MS/MS experiments.
Table 1. Parameter settings used for the Zeno SWATH DIA and ZT Scan DIA 3.0 experiments. Source: SCIEX
| Parameter |
Zeno SWATH
DIA: 85 VW |
ZT Scan
DIA 3.0: 5 Da |
ZT Scan
DIA 3.0: 2 Da |
| Cycle time |
1.84 s |
1.80 s |
1.80 s |
| TOF-MS range |
|
400–1500 Da |
|
| TOF MS accumulation time |
|
50 ms |
|
| DIA precursor range |
|
400–900 Da |
|
| Q1 isolation window |
Variable |
5.0 Da |
2.0 Da |
| Q1 scan speed |
N/A |
298 Da/s |
296 Da/s |
| MS/MS range |
|
140–1750 Da |
|
| MS/MS accumulation time |
18 ms |
16.8 ms |
6.8 ms |
Data processing
Data was processed through one of three methods: DIA-NN software version 1.9.1,4 using a K562/HeLa spectral library and the previously described DIA search settings;5 library-free using the PEAKS Studio software version 13.1 (Bioinformatics Solutions Inc., Canada); or using a FASTA database comprised of canonical human protein sequences that had been downloaded from Uniprot.org.
Only replicate data files for a specific loading/experiment were searched together.
Calculations were performed to determine the number of quantifiable proteins and peptides with a CV ≤20% among those identified across all four replicate injections. Results listed are from the DIA-NN searches unless stated.
Table 2. Nanoflow gradient used. Flow rate was 250 nL/min. Source: SCIEX
| Time (min) |
%B |
| 0 |
3 |
| 20 |
3 |
| 22 |
8 |
| 54 |
28 |
| 58 |
45 |
| 60 |
85 |
| 65 |
85 |
| 68 |
3 |
| 85 |
3 |
ZT Scan DIA 3.0 increases peptide/protein identifications and quantitation
Figures 1 and 2 summarize the numbers of identified and quantified protein groups and precursors. These were assessed for 50 ng and 250 ng K562 digest loads using DIA-NN v1.9.1, contrasting variable-window Zeno SWATH DIA, and ZT Scan DIA 3.0 utilizing 2 or 5 Da Q1 window widths.
Overall cycle times for the acquisition methods were around two seconds. MS/MS accumulation time for the variable-window Zeno SWATH DIA method was 18 ms, and ZT Scan DIA 3.0 methods utilized accumulation times of 16.8 ms and 6.8 ms for the 5 Da and 2 Da Q1 windows, respectively (Table 1).
The presented results demonstrate that ZT Scan DIA 3.0 with a 2 Da Q1 window achieved the highest number of protein groups and peptide identifications, despite using a shorter MS/MS accumulation time than the other two acquisition methods. It was also noted that this approach saw the greatest number of proteins and peptides quantified with CVs ≤20%.
The number of protein group identifications increased by 8.5% at the 250 ng load compared with Zeno SWATH DIA, while quantifiable protein groups and precursors increased by 11.5% and 21.4%, respectively.
Figure 3 displays the %CV distribution for protein groups and precursors for the 250 ng injections of K562 acquired using the 2 Da ZT Scan DIA 3.0 method.
The very low median %CVs highlight the quantitative capabilities achievable when employing the ZenoTOF 8600 system with ZT Scan DIA 3.0 acquisition.
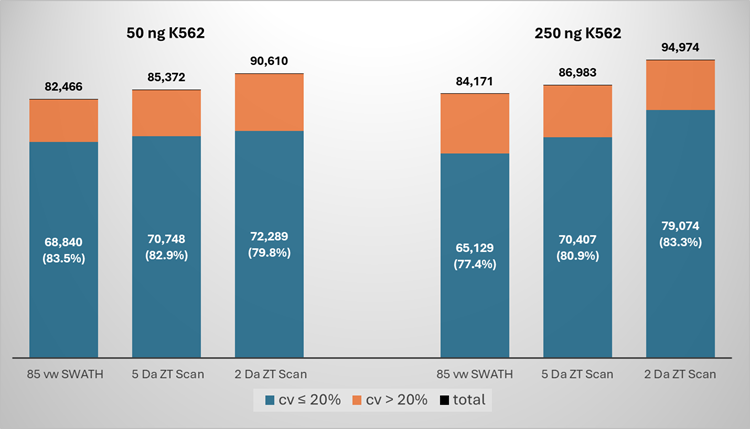
Figure 2. Peptides identified and quantified from indicated loadings of K562 digest. Data-independent acquisition was performed on a ZenoTOF 8600 using either 85 variable-window Zeno SWATH DIA or ZT Scan DIA 3.0, with Q1 isolation window widths of 5 Da or 2 Da. Image Credit: SCIEX
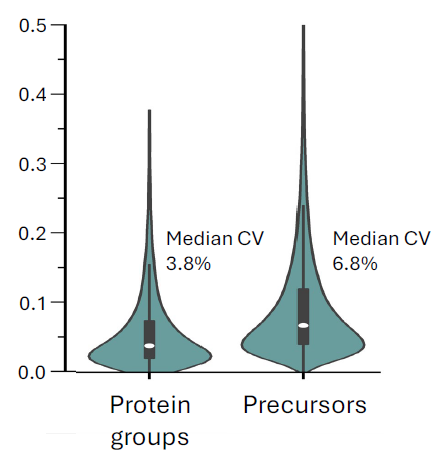
Figure 3. Violin plots showing the distribution of % CVs for both protein groups and precursors for the 250 ng injections of K562 using the 2 Da ZT Scan DIA 3.0 acquisition method. The very low median % CVs illustrate the quantitative capabilities of the ZenoTOF 8600 with ZT Scan DIA 3.0 acquisition. Image Credit: SCIEX
PEAKS Studio database search results
The acquired data was also searched using a library-free approach in PEAKS Studio version 13.1.
Relative increases in identified and quantified protein groups between the variable-window Zeno SWATH DIA and ZT Scan DIA 3.0 methods were identical to those observed in the DIA-NN software processing results.
Table 3 features a comparison between the library-based search using DIA-NN software and the library-free search completed using PEAKS Studio software for the 250 ng K562 data that had been acquired using the 2 Da ZT Scan DIA method.
The number of identified protein groups was determined to be 9% lower with PEAKS Studio software, while the number of quantified protein groups was found to be almost identical.
The number of identified and quantified precursors using PEAKS Studio software was almost two times higher than the results acquired using the DIA-NN software.
The results show that, despite employing a shorter MS/MS accumulation time than the other two acquisition methods, ZT Scan DIA 3.0 with a 2 Da Q1 window was able to achieve the highest number of protein groups and peptide identifications, alongside the greatest number of proteins and peptides able to be quantified with CVs ≤20%.
The number of protein group identifications was found to increase by 8.5% at the 250 ng load when compared to that of Zeno SWATH DIA. Quantifiable protein groups and precursors were also found to increase by 11.5% and 21.4%, respectively.
Figure 3 shows the %CV distribution for both protein groups and precursors for the 250 ng injections of K562 acquired using the 2 Da ZT Scan DIA 3.0 acquisition method.
The very low median %CVs serve to highlight the ZenoTOF 8600 system with ZT Scan DIA 3.0 acquisition’s quantitative capabilities.
Table 3. Comparison of DIA-NN software v1.9.1 (library-based) and PEAKS Studio software v13.1 search results of the 250 ng K562 2 Da ZT Scan data. Source: SCIEX
| |
Protein groups |
Precursors |
| |
Total Identified |
Quantified
(CV <20%) |
% Quantified |
Total Identified |
Quantified
(CV <20%) |
% Quantified |
DIA-NN
v1.9.1 |
9214 |
8477 |
92.0 |
94,974 |
79,074 |
83.3 |
PEAKS Studio
v13.1 |
8394 |
8320 |
99.1 |
189,353 |
154,202 |
81.4 |
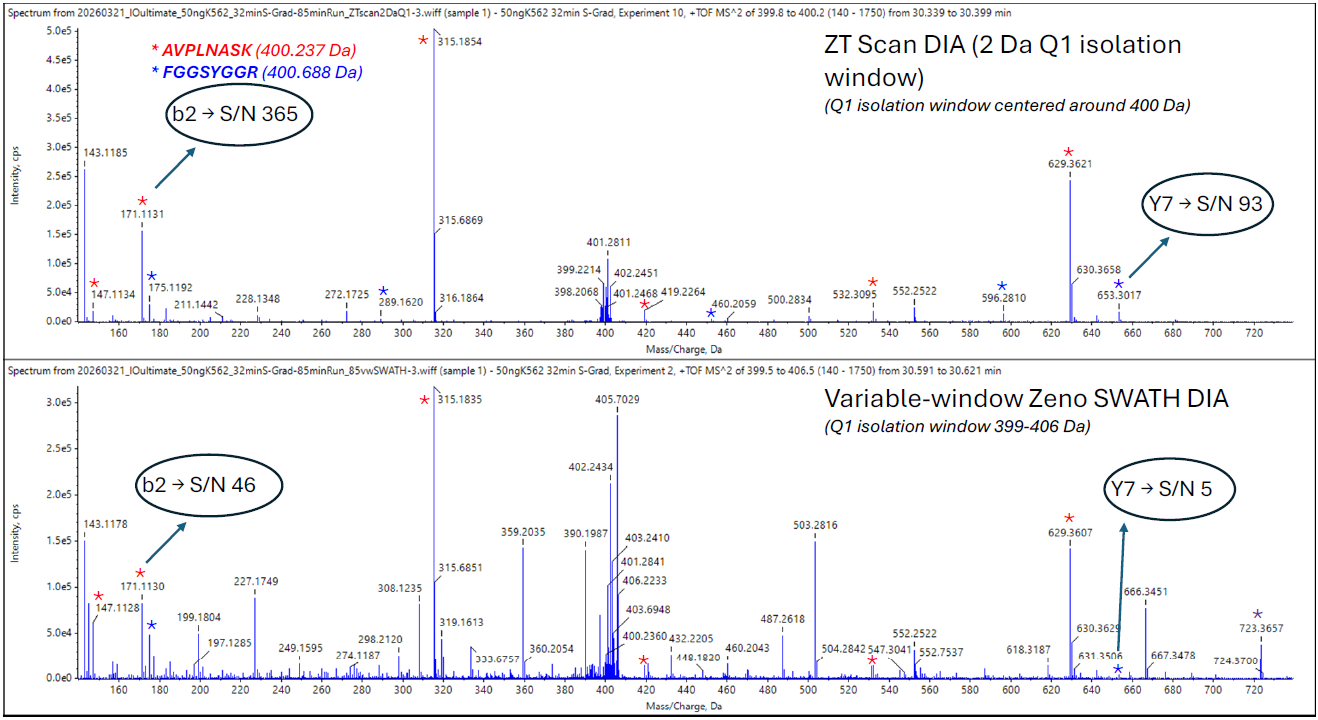
Figure 4. Comparison of MS/MS spectra from the 2 Da ZT Scan DIA 3.0 and variable-window Zeno SWATH DIA experiments for the 50 ng K562 loading. The ZT Scan DIA 3.0 spectrum centered at 400 Da is compared with the spectrum from the 399–406 Da precursor window from the Zeno SWATH DIA experiment. Identified fragments for two peptides are labeled (red for AVPLNASK, blue for FGGSYGGR). For each peptide, the S/N was calculated for the indicated fragments. Clearly, the ZT Scan DIA spectrum is less chimeric, resulting in improved S/N ratios for peptide fragments, enabling more confident identification and improved quantitation at low levels. Image Credit: SCIEX
Conclusions
The study presented here shows that employing ZT Scan DIA 3.0 on the ZenoTOF 8600 system enables robust, high-performance operation under challenging high-load nano-LC conditions.
The system addresses the challenges linked to increased sample complexity and throughput requirements by maintaining consistent ion transmission, fast scan speeds, and stable quantitative performance.
The results shown here highlight the ZenoTOF 8600 system's capacity to support deep proteome coverage without compromising sensitivity or reproducibility, even under increased analytical load.
These findings demonstrate the ZenoTOF 8600 system’s suitability for high-throughput nanoscale workflows where data quality and reliability are critical. ZT Scan DIA 3.0’s added capabilities position the system as a practical, scalable solution for pioneering proteomics applications, underpinning confident decision-making, whether working with discovery or large-scale studies.
Using ZT Scan DIA 3.0 on the ZenoTOF 8600 system as opposed to variable-window Zeno SWATH DIA offers a wide range of benefits, including:
- Quantifiable protein groups and precursors are increased by 11.5% and 21.4%, respectively.
- Enabling highly selective Q1 isolation improves protein identification by 8.5%, providing deeper, more confident proteome coverage.
- Spectral quality is significantly improved due to the ability to select precursors with higher resolution. This improved spectral quality increases both the precision of quantitation and the number of protein identifications.
It was also noted that library-free searches using PEAKS Studio software v13.1 resulted in an almost identical number of quantified proteins as those found when searching with DIA-NN software v1.9.1 and a spectral library.
The number of identified and quantified precursors nearly doubled when using PEAKS Studio software, enabling more confident identifications and quantitation.
References and further reading
- SCIEX (2020). Achieving deep quantitative proteome coverage from sub-nanogram sample loadings using Whisper Zoom and Zeno SWATH DIA on the ZenoTOF 8600 system. Available at: https://sciex.com/tech-notes/life-science-research/proteomics/achieving-deep-quantitative-proteome-coverage-from-sub-nanogram-sample-using-whisperzoom-zeno-swath-dia-on-the-zenotof-8600.
- SCIEX (2020). Advances in high-throughput quantitative proteomics powered by high-sensitivity data-independent acquisition on the ZenoTOF 8600 system. Available at: https://sciex.com/tech-notes/life-science-research/proteomics/high-throughput-quantitative-proteomics-powered-by-high-sensitivity-dia-on-the-zenotof-8600-system.
- SCIEX (2017). Continuing the data independent acquisition (r)evolution: Introducing ZT Scan DIA for quantitative proteomics. Available at: https://sciex.com/technology/zt-scan-dia/continuing-the-data-independent-acquisition-revolution-introducing-zt-scan-dia-for-quantitative-proteomics.
- Demichev, V., et al. (2020). DIA-NN: neural networks and interference correction enable deep proteome coverage in high throughput. Nature Methods, 17(1), pp.41–44. DOI:10.1038/s41592-019-0638-x. https://www.nature.com/articles/s41592-019-0638-x.
- SCIEX. Large scale protein identification using microflow chromatography on the ZenoTOF 7600 system. Available at: https://sciex.com/tech-notes/life-science-research/proteomics/large-scale-protein-identification-using-microflow-chromatograph.
Acknowledgments
Produced from materials originally authored by Patrick Pribil and Remco van Soest from SCIEX.
About SCIEX
SCIEX's mission is to deliver solutions for the precision detection and quantitation of molecules, empowering their customers to protect and advance the wellness and safety of all.
SCIEX has led the field of mass spectrometry for 50 years. From the moment it launched the first ever commercially successful triple quad in 1981, it has developed groundbreaking technologies and solutions that influence life-changing research and outcomes.
Today, as part of the Danaher family of global life science and technology innovators, the company continues to pioneer robust solutions in mass spectrometry and capillary electrophoresis. The company does not just develop products. It is what it does together with its customers that sets it apart. That’s why thousands of life science experts around the world choose SCIEX to get the answers they can trust to better inform critical decisions. Decisions that positively impact lives.
The company proudly stands behind its tagline: The Power of Precision.
Sponsored Content Policy: News-Medical.net publishes articles and related content that may be derived from sources where we have existing commercial relationships, provided such content adds value to the core editorial ethos of News-Medical.net, which is to educate and inform site visitors interested in medical research, science, medical devices and treatments.