Sponsored Content by SCIEXReviewed by Olivia FrostOct 7 2026
This article explores the use of a narrow-window ZT Scan DIA 3.0 workflow on the ZenoTOF 8600 system in the label-free quantitation (LFQ) proteomics analysis of complex lysate digest mixtures.
A scanning Q1 precursor isolation window, 2 Da wide, was employed in the identification of more than 13,600 total protein groups and more than 290,000 precursors from 200 ng injections of a mix of human/yeast/E. coli lysate digests.
The process was performed using a 38-minute active nanoflow gradient, resulting in 16% and 39% increases in identifications, respectively, compared with discrete-window DIA methods on an identical system.
ZT Scan DIA 3.0 demonstrates enhanced LFQ accuracy and excellent quantitative reproducibility, underscoring the ZenoTOF 8600 system’s suitability for quantitative analysis of complex proteomics samples in the field of biomarker research.
Key LFQ proteomics features using ZT Scan DIA 3.0 on the ZenoTOF 8600 system
The ZenoTOF 8600 system offers a range of benefits when using ZT Scan DIA 3.0.
Deeper proteome coverage
More than 13,600 protein groups and 290,000 precursors were identified from 200 ng of hybrid proteome lysate mixtures when using ZT Scan DIA 3.0. This represents increases of 16% and 39%, respectively, versus discrete-window DIA methods.
Superior quantitative accuracy and precision
ZT Scan DIA 3.0 was found to enhance quantitative accuracy with extremely high precision in terms of anticipated LFQ ratios, enabling confident identification and quantitation of both protein and peptide biomarkers.
Exceptional versatility
ZT Scan DIA 3.0 was also found to improve the established flexibility of ZT Scan DIA methods available on the ZenoTOF 8600 system, enabling precursor isolation windows to be set as narrow as 1 Da wide.
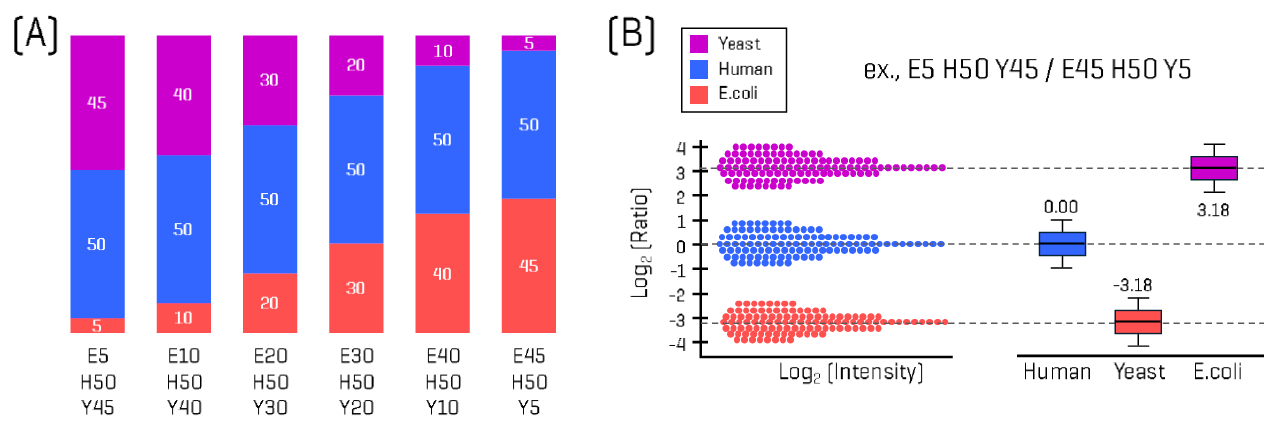
Figure 1. Overview of label-free quantitation (LFQ) proteomics experiment. (A) Six defined mixtures of human, yeast, and E. coli lysate tryptic digests were prepared, each with the same total amount of protein but varying in the proportions (w/w) of human, yeast, and E. coli digests present. Samples were analyzed using Zeno SWATH DIA and ZT Scan DIA 3.0 on the ZenoTOF 8600 system. LFQ accuracy was determined by generating Log2(Ratio) vs Log2(Intensity) plots for various pairwise mixture comparisons: E5 H50 Y45 vs E45 H50 Y5, E10 H50 Y40 vs E40 H50 Y10, E20 H50 Y30 vs E30 H50 Y20, and E5 H50 Y45 vs E20 H50 Y30. (B) Example theoretical LFQ ratio plot for the comparison of samples E5 H50 Y45 vs E45 H50 Y5. Image Credit: SCIEX
Disease biomarker research requires investigation into complex biological pathways. Proteins are key functional components in these pathways, so accurate, precise methods for identifying and quantifying peptides and proteins are crucial.
Data-independent acquisition (DIA) using mass spectrometry (specifically LC-MS) is a widely used proteomics technique, ideally suited to label-free quantitation (LFQ) of proteins and peptides.
The sensitivity and dynamic range of LC-MS instruments impact the quantitative identification limits of proteins and peptides in complex samples. Researchers continue to look for ways to optimize their acquisition strategies and workflows to enhance quantitative performance and identification depth.
The ZT Scan DIA method combines the Zeno trap and a continuously scanning quadrupole for precursor isolation, enhancing both qualitative and quantitative performance compared to that of discrete-window DIA methods, for example, Zeno SWATH DIA.1
Recent innovations increasing flexibility in mass range and scan speed have expanded the utility of ZT Scan DIA, evolving into ZT Scan DIA 2.0.2,3,4
ZT Scan DIA 3.0 expands these methods’ scope and flexibility further, enabling precursor isolation windows as narrow as 1 Da.
Reducing the number of chimeric MS/MS spectra and narrowing the scanning Ql precursor isolation window also increases selectivity, resulting in peptide sequence assignments with higher confidence.5,6
This study showcases the application of the narrow-window ZT Scan DIA 3.0 methods for label-free quantitation of complex lysates. Considerable improvements in protein group and precursor identifications, as well as quantitative accuracy, are achieved with 2 Da isolation windows, particularly compared with discrete-window DIA methods.
Methods
Sample preparation
Commercially available human K562 and yeast lysate tryptic digests were bought from Promega, while E. coli lysate tryptic digest was bought from Waters.
Lysates were diluted in water in a buffer containing 0.1% formic acid before being mixed at defined ratios to create six sample mixtures (Figure 1). Each mixture featured a total protein concentration of 200 ng/µL.
Chromatography
A Waters M-Class UHPLC system with an IonOpticks Aurora Ultimate XS C18 nanoflow column (25 cm x 0.075 mm) was used to perform chromatographic separations. These were performed in direct-injection mode.
Mobile phase A was comprised of 0.1% formic acid in water, and mobile phase B was comprised of 0.1% formic acid in acetonitrile. The flow rate was 250 nL per minute.
The chromatographic gradient used was as follows:
- Initial sample loading for 20 minutes at 3% B
- 3–8% B over two minutes
- 8–28% B over 32 minutes
- 28–45% B over four minutes
- 45–85% B over two minutes
The gradient was then held at 85% B for five minutes and then at 85-3% B for three minutes, followed by re-equilibration at 3% B for 17 minutes. This equaled a total runtime of 85 minutes.
The LC column was heated to 50 °C for each analysis, with an injection volume of 1 µL to achieve an injection load of 200 ng.
For each DIA method, each sample mixture was analyzed in triplicate.
Mass spectrometry
The ZenoTOF 8600 system was used for sample analysis. This was performed using the horizontal nanoflow probe, with ion source parameters including gas 1 set to 10, curtain gas set to 35, ion spray voltage set to 2100 V, and interface temperature set to 250 °C.
Either Zeno SWATH DIA (85 variable-width windows) or ZT Scan DIA 3.0 was used to analyze samples. Both methods used a TOF-MS scan from 400–1500 Da (50 milliseconds), MS/MS with precursor isolation ranging from 400–900 Da, and TOF-MS/MS mass ranges of 140–1750 Da.
The Zeno SWATH DIA method used MS/MS accumulation times of 18 milliseconds. Conversely, the ZT Scan DIA 3.0 method utilized a Ql window width of 2 Da with a scan rate of 296 Da per second and MS/MS accumulation times of 6.8 milliseconds.
The total scan cycle time for both methods was 1.8 seconds. Zeno trapping and dynamic collision energy were employed in all MS/MS experiments.
Data processing
Data files in .wiff2 format were processed using PEAKS Online software 13. This was performed by performing library-free searches against a FASTA database including canonical human, yeast, and E. coli protein sequences. This data was downloaded from Uniprot.org.
Combined data files for a specific DIA method (for example, 18 files each for Zeno SWATH DIA and ZT Scan DIA 3.0, respectively) were searched together. MBR was enabled while normalization was turned off.
Improved quantifiable protein group and precursor identifications using ZT Scan DIA 3.0
Six different mixtures of human, yeast, and E. coli digests were prepared to demonstrate the LFQ workflow on the ZenoTOF 8600 system (Figure 1).
Each mixture includes an identical proportion of human lysate digest, while varying in the proportions of yeast and E. coli digest present. Each mixture maintains the same total amount of protein, however (200 ng/µL).
The experiment aimed to analyze each mixture to:
- Determine the number of identifiable and quantifiable protein groups, in aggregate and by species
- Confirm the number of identifiable and quantifiable precursors
- Calculate protein group abundance ratios for each species from defined mixture pairs
Protein group abundance ratios have been plotted as Log2(Ratio) against Log2(lntensity).
Log2(Ratio) distribution should ideally be as narrow as possible, with the median value as close as possible to the theoretical ratio value to demonstrate high LFQ accuracy.
In this instance, LFQ accuracy is reported as the deviation of this median value from the expected ratio for each species in each pairwise comparison.
Figure 1 shows an idealized example of the Log2(Ratio)/Log2(lntensity) plot for the pairwise comparison of sample E5 H50 Y45 versus E45 H50 Y5. The expected Log2(Ratio) for yeast, human, and E. coli should be +3.18, 0.00, and -3.18, respectively, in this instance.
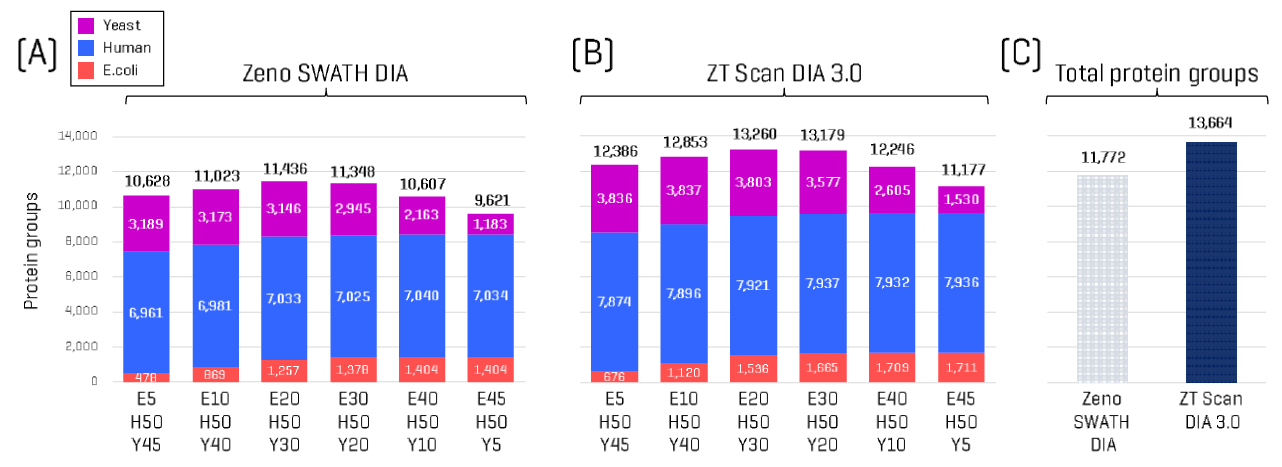
Figure 2. Protein groups identified in HYE mixtures. Protein group identifications for each mixture, total and by species, using either Zeno SWATH DIA (A) or ZT Scan DIA 3.0 (B). Numbers represent identifications in all three replicates for each sample (i.e., no missing values). (C) Aggregate protein groups identified across all samples with either Zeno SWATH DIA or ZT Scan DIA 3.0. Image Credit: SCIEX
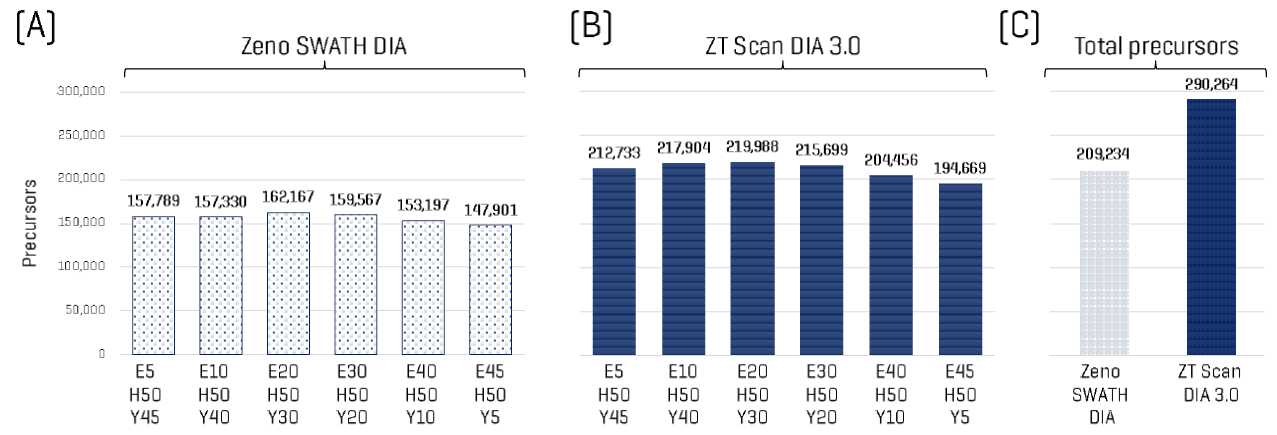
Figure 3. Precursors identified in HYE mixtures. Precursor identifications for each mixture, total and by species, using either Zeno SWATH DIA (A) or ZT Scan DIA 3.0 (B). Numbers represent identifications in all three replicates for each sample (i.e., no missing values). (C) Aggregate precursors identified across all samples with either Zeno SWATH DIA or ZT Scan DIA 3.0. Image Credit: SCIEX
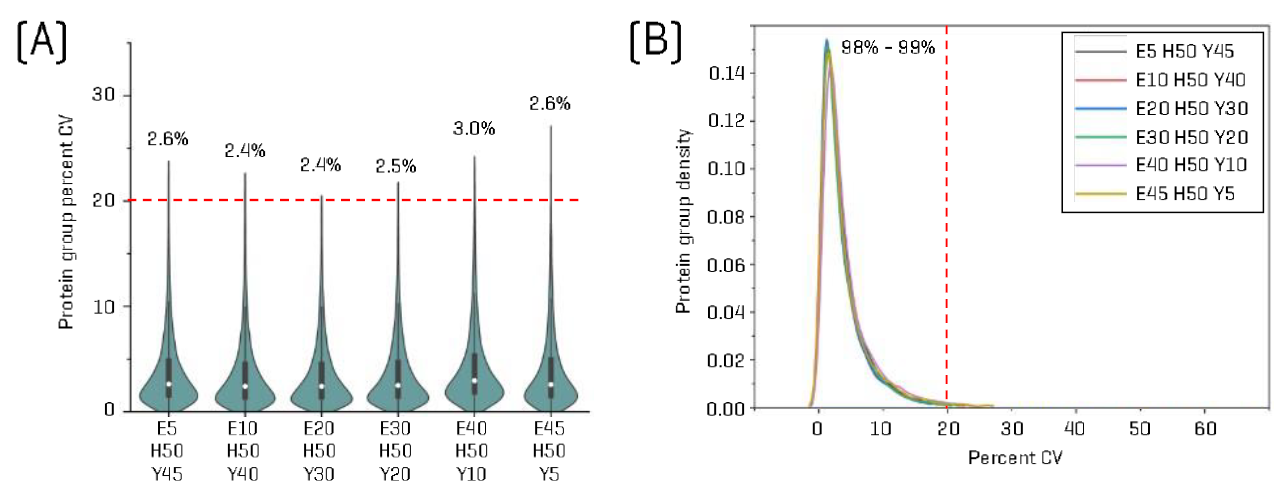
Figure 4. ZT Scan DIA 3.0 achieves exceptionally high quantitative reproducibility for protein group identifications. (A) Violin plots show protein group CV distributions for each HYE mixture. The median CV values for each sample are indicated, ranging from 2.4–3%. (B) Protein group CV densities for each HYE mixture. The proportion of quantifiable protein groups–defined as those quantified in all three replicates per mixture with no missing values–ranged from 98–99%. Image Credit: SCIEX
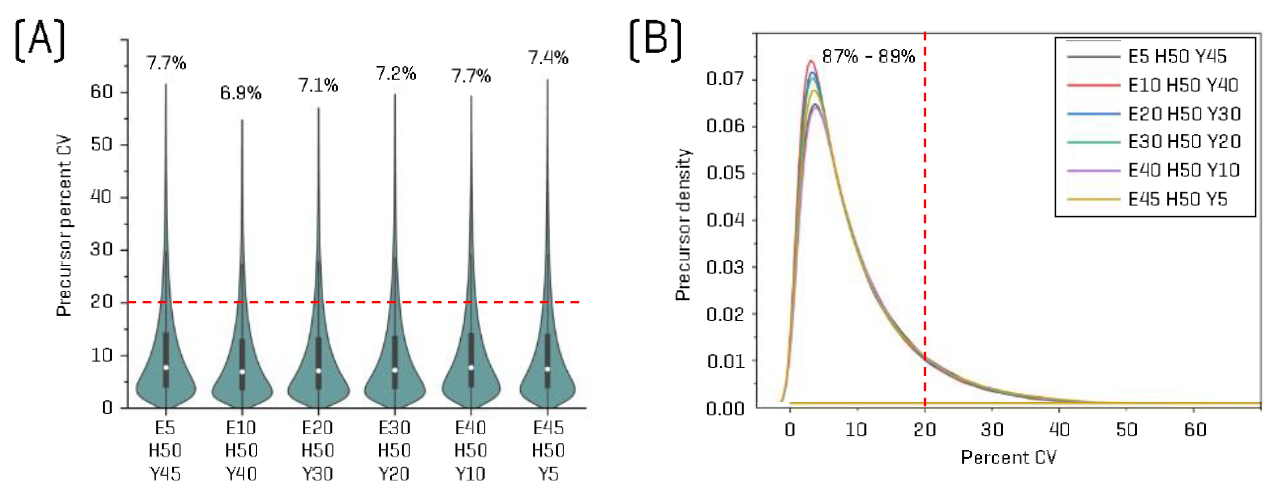
Figure 5. ZT Scan DIA 3.0 achieves exceptionally high quantitative reproducibility for precursor identifications. (A) Violin plots show precursor CV distributions for each HYE mixture. The median CV values for each sample are indicated, ranging from 6.9–7.7%. (B) Precursor CV densities for each HYE mixture. The proportion of quantifiable precursors–defined as those quantified in all three replicates per mixture with no missing values–ranged from 87–89%. Image Credit: SCIEX
The other pairwise sample comparisons were:
- E10 H50 Y40 versus E40 H50 Y10 with the expected Log2(Ratio) for yeast, human, and E. coli determined to be +2.00, 0.00, and -2.00, respectively
- E20 H50 Y30 versus E30 H50 Y20 with the expected Log2(Ratio) for yeast, human, and E. coli determined to be +0.58, 0.00, and -0.58, respectively
- E5 H50 Y45 versus E20 H50 Y30 with the expected Log2(Ratio) for yeast, human, and E. coli determined to be +0.58, 0.00, and -2.00, respectively
LFQ accuracies can be determined across different dynamic ranges by having multiple pairwise comparisons.
Figure 2 summarizes the number of protein groups identified in each mixture using either Zeno SWATH DIA or ZT Scan DIA 3.0. This was performed by species or in aggregate.
The numbers in the bar graphs represent protein groups identified in all three replicates for each sample, with no missing values.
Using ZT Scan DIA 3.0, identifications were found to increase significantly across all mixtures and species within each mixture. It was noted that gains ranged from 13–17% for human, 16–49% for yeast, and 21–49% for E. coli.
Using ZT Scan DIA 3.0, aggregate protein groups, for example, those identified across all replicates and samples, were also found to increase from 11,772 to 13,664. This represented an increase of 16%.
Figure 3 highlights the greater gains in precursor identification using ZT Scan DIA 3.0 compared with Zeno SWATH DIA. Gains ranged from 31–66% for the different mixtures.
Using ZT Scan DIA 3.0, aggregate precursors, for example, those identified across all replicates and samples, were found to increase from 209,234 to 290,264. This represented an increase of 39%.
It was possible to identify high numbers of protein groups and precursors per mixture while maintaining extremely high quantitative reproducibility. Figures 4 and 5 feature CV distributions for identified protein groups and precursors, respectively.
The violin plots featured in Figures 4A and 5A and the CV density plots featured in Figures 4B and 5B confirm that the majority of CVs are well below the accepted quantitation standard of 20%.
The median CV values ranged from 2.1% to 3% for identified protein groups, while the median CVs ranged from 6.9% to 7.7% for identified precursors.
Quantifiable protein groups and precursors were defined as those quantified in all three replicates per mixture with no missing values. The proportion of these was determined to be 98–99% and 87–89%, respectively, for protein groups and precursors.
These results highlight the extremely high depth and quantitative precision that can be achieved using ZT Scan DIA 3.0.
ZT Scan DIA 3.0 offers excellent quantitative accuracy for LFQ proteomics workflows
Figure 6 features protein group LFQ ratio plots for the four pairwise mixture comparisons:
- E5 H50 Y45 versus E45 H50 Y5
- E10 H50 Y40 versus E40 H50 Y10
- E20 H50 Y30 versus E30 H50 Y20
- E5 H50 Y45 versus E20 H50 Y30
Theoretical ratios are shown for each species in each of the four plots. The number of protein groups quantified in that pairwise comparison is shown for each plot. These are defined as those groups quantified in all six replicates with no missing values.
Box-and-whisker plots are used to summarize LFQ ratio distributions and median values. The deviation of the median value from the theoretical ratio value is also displayed for all species, representing the LFQ accuracies observed.
Results from this study show that it was possible to achieve a high number of quantifiable protein groups across all replicates.
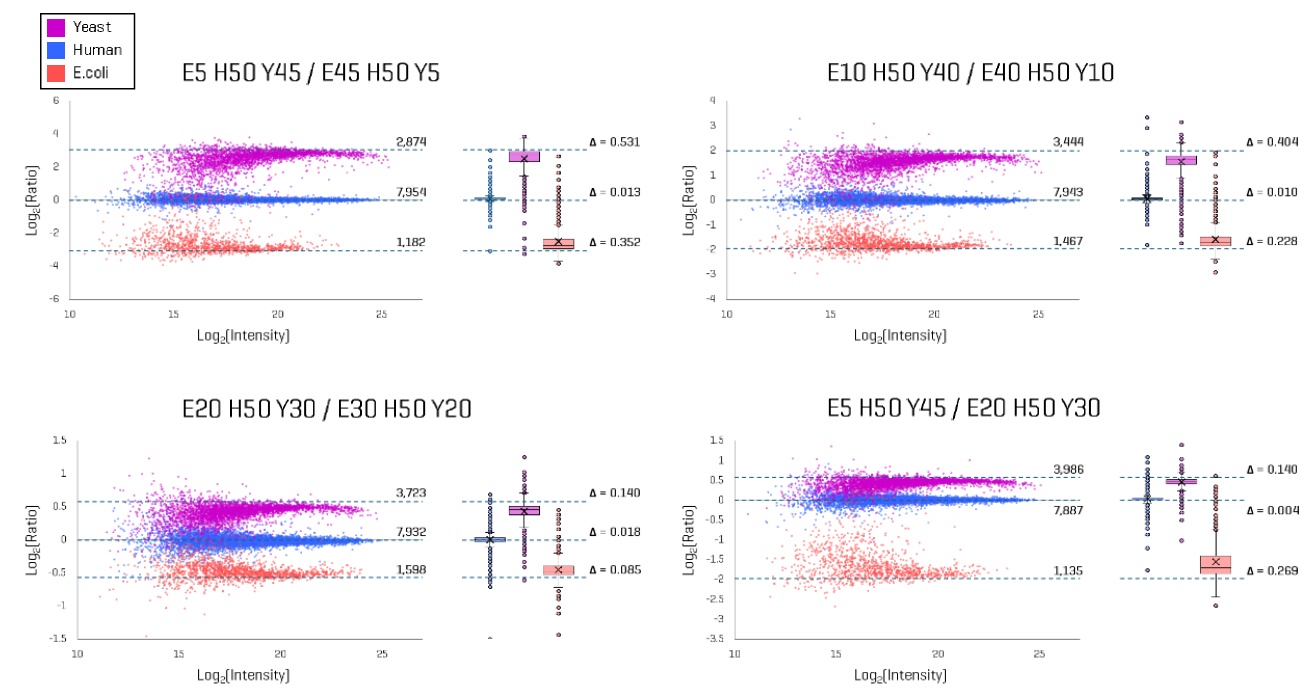
Figure 6. Protein group LFQ ratio plots from the various pairwise HYE mixture comparisons. The theoretical ratios for each species are indicated by dashed lines in each of the four plots. For each plot, the number of protein groups quantified in that pairwise comparison (quantified in all six replicates with no missing values) is shown. The box-and-whisker plots summarize the LFQ ratio quartile distributions, with median values marked by an X. The deviation of the median value from the theoretical ratio value is shown for all species, representing the observed LFQ accuracies. Image Credit: SCIEX
Figure 7 summarizes LFQ accuracies for all species in each pairwise mixture comparison, comparing Zeno SWATH DIA and ZT Scan DIA 3.0.
These results show that LFQ accuracy was enhanced when utilizing ZT Scan DIA 3.0, especially for yeast and E. coli. The most significant improvements in LFQ accuracy were noted in the E5 H50 Y45 versus E45 H50 Y5 pairwise comparison.
This also featured the most significant differences in protein abundance between the two mixtures for yeast and E. coli.
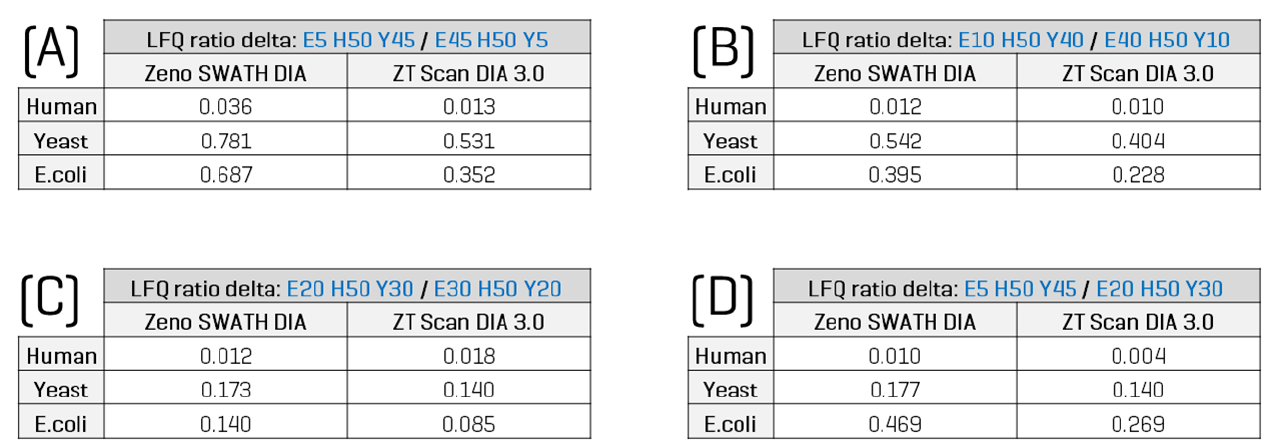
Figure 7. LFQ ratio accuracy is improved using ZT Scan DIA 3.0. The delta (absolute difference) between the median observed and theoretical protein group LFQ ratios, by species, is summarized for each pairwise mixture comparison: (A) E5 H50 Y45 vs E45 H50 Y5, (B) E10 H50 Y40 vs E40 H50 Y10, (C) E20 H50 Y30 vs E30 H50 Y20, and (D) E5 H50 Y45 vs E20 H50 Y30. ZT Scan DIA 3.0. The results show that ZT Scan DIA 3.0 produces lower median delta values than Zeno SWATH DIA, particularly for yeast and E. coli, demonstrating improved overall accuracy. Image Credit: SCIEX
Conclusions
The study presented here confirms that when analyzing 200 ng loadings of complex proteome mixtures, ZT Scan DIA 3.0 provides 16% and 39% gains in identifiable protein groups and precursors, respectively, versus discrete-window DIA methods.
It was possible to achieve greater depth of proteomic identifications with ZT Scan DIA 3.0 while maintaining excellent quantitative reproducibility. Median CV values in this study were found to be less than 3% for protein groups and less than 8% for precursors.
The high selectivity gained when combining narrow Q1 isolation windows (2 Da wide) with ZT Scan DIA 3.0 enhanced quantitative LFQ workflow accuracy relative to discrete-window DIA methods when employing the ZenoTOF 8600 system.
ZT Scan DIA 3.0 allows users to develop optimized methods for a wide range of applications by defining the desired Q1 scan speeds, window widths, and mass ranges.
References and further reading
- SCIEX (2017). Continuing the data independent acquisition (r)evolution: Introducing ZT Scan DIA for quantitative proteomics. Available at: https://sciex.com/technology/zt-scan-dia/continuing-the-data-independent-acquisition-revolution-introducing-zt-scan-dia-for-quantitative-proteomics.
- SCIEX (2020). Achieving deep quantitative proteome coverage from sub-nanogram sample loadings using Whisper Zoom and Zeno SWATH DIA on the ZenoTOF 8600 system. Available at: https://sciex.com/tech-notes/life-science-research/proteomics/achieving-deep-quantitative-proteome-coverage-from-sub-nanogram-sample-using-whisperzoom-zeno-swath-dia-on-the-zenotof-8600.
- SCIEX (2020). Advances in high-throughput quantitative proteomics powered by high-sensitivity data-independent acquisition on the ZenoTOF 8600 system. Available at: https://sciex.com/tech-notes/life-science-research/proteomics/high-throughput-quantitative-proteomics-powered-by-high-sensitivity-dia-on-the-zenotof-8600-system.
- Van Puyvelde, B., et al. (2026). LFQ Benchmark Dataset - Generation Beta: Assessing Modern Proteomics Instruments and Acquisition Workflows with High-Throughput LC Gradients. DOI:10.64898/2026.01.29.702266. https://www.biorxiv.org/content/10.64898/2026.01.29.702266v2.abstract.
- ZT Scan DIA 3.0: A data-independent acquisition [DIA] method with high resolution precursor selection improves protein identification and quantitation for proteomics research. SCIEX technical note, MKT-38093-A.
- Heymann, T., et al. (2026). Scanning DIA on the ZenoTOF 8600 system enables ultra-sensitive and quantitative proteomics from single cells to post-translational modifications in a compact platform. DOI:10.64898/2026.03.12.711261. https://www.biorxiv.org/content/10.64898/2026.03.12.711261v1.abstract.
Acknowledgments
Produced from materials originally authored by Kristina Jurcic from Bioinformatics Solutions Inc., and Patrick Pribil from SCIEX.
About SCIEX
SCIEX's mission is to deliver solutions for the precision detection and quantitation of molecules, empowering their customers to protect and advance the wellness and safety of all.
SCIEX has led the field of mass spectrometry for 50 years. From the moment it launched the first ever commercially successful triple quad in 1981, it has developed groundbreaking technologies and solutions that influence life-changing research and outcomes.
Today, as part of the Danaher family of global life science and technology innovators, the company continues to pioneer robust solutions in mass spectrometry and capillary electrophoresis. The company does not just develop products. It is what it does together with its customers that sets it apart. That’s why thousands of life science experts around the world choose SCIEX to get the answers they can trust to better inform critical decisions. Decisions that positively impact lives.
The company proudly stands behind its tagline: The Power of Precision.
Sponsored Content Policy: News-Medical.net publishes articles and related content that may be derived from sources where we have existing commercial relationships, provided such content adds value to the core editorial ethos of News-Medical.net, which is to educate and inform site visitors interested in medical research, science, medical devices and treatments.