 The degree to which city people walk or ride bicycles for their daily transportation needs depends largely on how much green space there is, says a new study that examines the role of urban design in physical fitness.
“Because engaging in moderate physical activity such as walking or bicycling can improve health outcomes, understanding strategies that increase these behaviors has become a public health priority,” says Amy Zlot, an epidemiologist with the Oregon Department of Human Services, writing in the current American Journal of Health Promotion.
Using government databases with results from surveys of more than half a million respondents, the researchers compared levels of fitness with parkland acreage in 34 metropolitan areas.
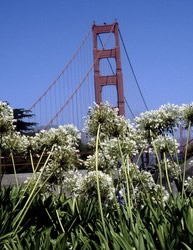
They found that San Francisco had the highest percentage of people who walked or bicycled for recreation and the highest percentage of parkland. New York City had the highest percentage that walked or bicycled for basic transportation, such as commuting to work or running errands, and the third highest amount of parkland.
Atlanta had the lowest percentage for recreational walking or bicycling and the second lowest percentage of parkland, and Memphis had the lowest proportion of people who walked or rode for transportation purposes and the sixth lowest percentage of open space. San Jose had the lowest percentage of parkland.
The parkland acreage was measured as a percentage of total city size, and the figures for walking or bicycling were derived from those who listed those as their two most frequent forms of physical activity.
“In this set of observations, walking and bicycling for transportation was positively associated with parkland acreage,” say Zlot and co-author Tom Schmid, who did the research while employed at the Centers for Disease Control and Prevention. The data did not show a significant relationship between the level of walking or cycling for pleasure and the percentage of urban parks.
The significance of the study, say the authors, is that “the number of route choices a community provides – and mix – the relative percentage of housing, retail, work and recreational opportunities in a community – appear to be important, independent predictors of walking and bicycling.”
Zlot and Schmid suggest that studies like theirs might help in the planning of “livable communities” by multidisciplinary teams of urban planners, architects, transportation experts, developers, policy makers, park administrators and environmentalists.
A study of Atlanta area residents published in early February found that city dwellers were more physically active than suburbanites because they walk more often for shopping, dining or doing errands.
Government data suggest that only 45 percent of Americans meet recommendations for physical activity and of the remaining 55 percent, about half are sedentary.
The top 10 cities for recreational walking and bicycling:
- San Francisco
- Milwaukee
- Oakland
- San Diego
- San Jose
- Pittsburgh
- Sacramento
- Los Angeles and Tampa (tied)
- Denver
The bottom 10 cities for recreational walking and bicycling:
- Atlanta,
- Cincinnati
- New York
- Chicago
- Houston
- Phoenix-Mesa
- Cleveland
- Miami
- Las Vega
- Virginia Beach
The top 10 cities for “utilitarian” walking and bicycling:
- New York
- Philadelphia
- Baltimore
- Minneapolis-St. Paul
- Boston
- San Francisco
- Chicago
- Portland
- Cincinnati
- Oakland.
The bottom 10 cities for “utilitarian” walking and bicycling:
- Memphis
- Columbus
- Cleveland
- Virginia Beach
- Milwaukee
- St. Louis/Atlanta (tied)
- San Jose
- San Diego
- Sacramento.
The top 10 cities for parkland as a percentage of city acreage:
- San Francisco
- Washington
- New York
- San Diego
- Boston
- Minneapolis-St. Paul
- Portland
- Cincinnati
- Philadelphia
- Phoenix-Mesa.
The bottom 10 cities for parkland as a percentage of city acreage:
- San Jose
- Atlanta
- New Orleans
- Tampa
- Miami
- Houston
- Cleveland
- Memphis/Sacramento
- Columbus.
 Public health messaging still beats AI chatbots for HPV vaccine promotion