Modeling for the severe acute respiratory syndrome coronavirus 2 (SARS-CoV-2) has been essential for predicting the future path of the current coronavirus disease 2019 (COVID-19) pandemic. In a recent study published on the preprint server medRxiv*, researchers attempt to predict future transmission rates by identifying multiple scenarios that could occur over the next year.
 This news article was a review of a preliminary scientific report that had not undergone peer-review at the time of publication. Since its initial publication, the scientific report has now been peer reviewed and accepted for publication in a Scientific Journal. Links to the preliminary and peer-reviewed reports are available in the Sources section at the bottom of this article. View Sources
About the study
In the current study, a compartmental model was used to fit the transmission dynamics of the spread of SARS-CoV-2 through communities during the first three waves of the pandemic from February 2020 to October 2021. The researchers also reproduced similar data that was recorded by the National Health Service (NHS) England with regard to observed deaths per region, hospitalizations, hospital, and intensive care unit (ICU) bed occupancy, polymerase chain reaction (PCR) prevalence and seropositivity, as well as the emergence and spread of the Alpha and Delta variants of concern. The model fits both the prevalence of spike gene target failure and the proportion of new Delta cases.
The model uses Google Community Mobility indices over time to work out contact rates for each region modeled by measuring the relationship between the mobility indices and age-specific contact rates as determined by a previous study in combination with school attendance data and assumed school schedules. A time-varying transmission adjustment component is fitted for each region to capture any additional variation in transmission not explained by mobility data.
Notable peaks in transmission around Christmas 2020 and the summer of 2021 can be seen, as well as troughs during the lockdown. The scientists combined various assumptions on future mobility changes with simulated trajectories for transmission adjustments based on historic data. The researchers identified future levels of mobility as one of the greatest variables that could reduce the accuracy of their predictions.
 and hospital admissions, hospital and ICU bed occupancy data was provided by NHS England. These data sources are unpublished and not publicly available, but are closely aligned with the UK Government’s COVID-19 dashboard. PCR prevalence data was obtained from the Office for National Statistics’ COVID-19 Infection Survey (ONS-CIS)13. ICU = intensive care unit. NHS = National Health Service.") Comparison between aggregated model fits and epidemiological data from England between March 2020 and October 2021. Black lines show reported data, with vertical black lines showing 95% confidence intervals for PCR prevalence. Colored lines and shaded areas show medians and 90% interquantile ranges from the fitted model. The original model fitting is done independently for each NHS England region, with the aggregated model output for the whole of England shown here. COVID-19 deaths data was provided by the UK Health Security Agency (UKHSA) and hospital admissions, hospital and ICU bed occupancy data were provided by NHS England. These data sources are unpublished and not publicly available, but are closely aligned with the UK Government’s COVID-19 dashboard. PCR prevalence data were obtained from the Office for National Statistics’ COVID-19 Infection Survey (ONS-CIS)13. ICU = intensive care unit. NHS = National Health Service.
Comparison between aggregated model fits and epidemiological data from England between March 2020 and October 2021. Black lines show reported data, with vertical black lines showing 95% confidence intervals for PCR prevalence. Colored lines and shaded areas show medians and 90% interquantile ranges from the fitted model. The original model fitting is done independently for each NHS England region, with the aggregated model output for the whole of England shown here. COVID-19 deaths data was provided by the UK Health Security Agency (UKHSA) and hospital admissions, hospital and ICU bed occupancy data were provided by NHS England. These data sources are unpublished and not publicly available, but are closely aligned with the UK Government’s COVID-19 dashboard. PCR prevalence data were obtained from the Office for National Statistics’ COVID-19 Infection Survey (ONS-CIS)13. ICU = intensive care unit. NHS = National Health Service.
Study findings
Early in the pandemic, many projections proved to be incorrect due to chaotic changes in government advice and lockdown rules, which led to a decrease in trust for scientific predictions. The researchers account for this by considering three scenarios for changes in future mobility – no change, a three-month return to pre-pandemic levels, and a six-month return to pre-pandemic levels.
The two scenarios that predict a change in mobility behaviors show a peak in transmission in late 2021, followed by a decline to low levels in early 2022 due to the depletion of susceptible individuals in England. The scenario assuming no changes in mobility results in low levels of transmission throughout 2022, with some increases in September 2022.
, and seasonality of 20% is introduced from 1st April 2021. The ‘boosters for all’ scenario is modelled as 90% of all individuals who receive initial COVID-19 vaccination being offered a booster vaccine at least 6 months following their second dose. Tables: the total number of infections, admissions, and deaths, over the shorter term (October to December 2021) and the longer term (October 2021 to September 2022), shown to 3 significant figures.") Impact of booster vaccination strategies on projected dynamics of SARS-CoV-2 transmission in England from October 2021 to September 2022. Top: Possible trajectories for SARS-CoV-2 infections, hospital admissions and deaths are simulated until September 2022, with different assumptions used for age groups receiving COVID-19 booster vaccinations. The shaded areas and solid lines show the 90% interquartile range, the 50% interquartile range, and the median for each time point, while the dashed line shows a single sample trajectory. All scenarios assume that mobility returns to pre-pandemic baseline levels over a 6-month period, a medium rate of waning protection conferred by vaccines (Table S3), and seasonality of 20% is introduced from 1st April 2021. The ‘boosters for all’ scenario is modeled as 90% of all individuals who receive initial COVID-19 vaccination being offered a booster vaccine at least 6 months following their second dose. Tables: the total number of infections, admissions, and deaths, over the shorter term (October to December 2021) and the longer-term (October 2021 to September 2022), shown to 3 significant figures.
Impact of booster vaccination strategies on projected dynamics of SARS-CoV-2 transmission in England from October 2021 to September 2022. Top: Possible trajectories for SARS-CoV-2 infections, hospital admissions and deaths are simulated until September 2022, with different assumptions used for age groups receiving COVID-19 booster vaccinations. The shaded areas and solid lines show the 90% interquartile range, the 50% interquartile range, and the median for each time point, while the dashed line shows a single sample trajectory. All scenarios assume that mobility returns to pre-pandemic baseline levels over a 6-month period, a medium rate of waning protection conferred by vaccines (Table S3), and seasonality of 20% is introduced from 1st April 2021. The ‘boosters for all’ scenario is modeled as 90% of all individuals who receive initial COVID-19 vaccination being offered a booster vaccine at least 6 months following their second dose. Tables: the total number of infections, admissions, and deaths, over the shorter term (October to December 2021) and the longer-term (October 2021 to September 2022), shown to 3 significant figures.
There is a slight difference between the three and six-month return to baseline scenarios, with a three-month scenario leading to a more rapid rise in transmission but a lower peak of the epidemic in the end. This is because a more gradual return to baseline mobility decreases the damage caused by the disease over smaller timescales. However, over longer timescales, there is much less of a difference, and seasonal changes in transmission play more of an effect.
Factors such as future policies on COVID-19 booster vaccination and the rate at which vaccine protection wanes over time were also considered by the scientists. As long as vaccine protection does not completely fade with time, booster vaccinations have the largest overall effect in suppressing the transmission of SARS-CoV-2.
The researchers estimate that targeting individuals over the age of 50 with vaccine booster shots could save about 50,000 lives by September 2022. Targeting younger age groups provide additional benefits in reducing transmission; however, this approach does not show as much of an impact on hospital admissions or deaths. Further, administering booster shots to 90% of fully vaccinated individuals could suppress transmission of SARS-CoV-2 enough to prevent 2.5 million fewer infections by September 2022.
The waning of vaccine protection is another key factor in the rate of transmission. Once again, the researchers considered three scenarios for the waning of vaccine protection, all assuming individuals with a vaccine booster did not wane, and 90% of all individuals over the age of 50 were boosted.
The most severe scenario still resulted in over 30,000 deaths in the summer of 2022. If this scenario turns out to be correct, the researchers recommend the re-introduction of social distancing measures during the spring/summer of 2022 to prevent the worst-case scenario.
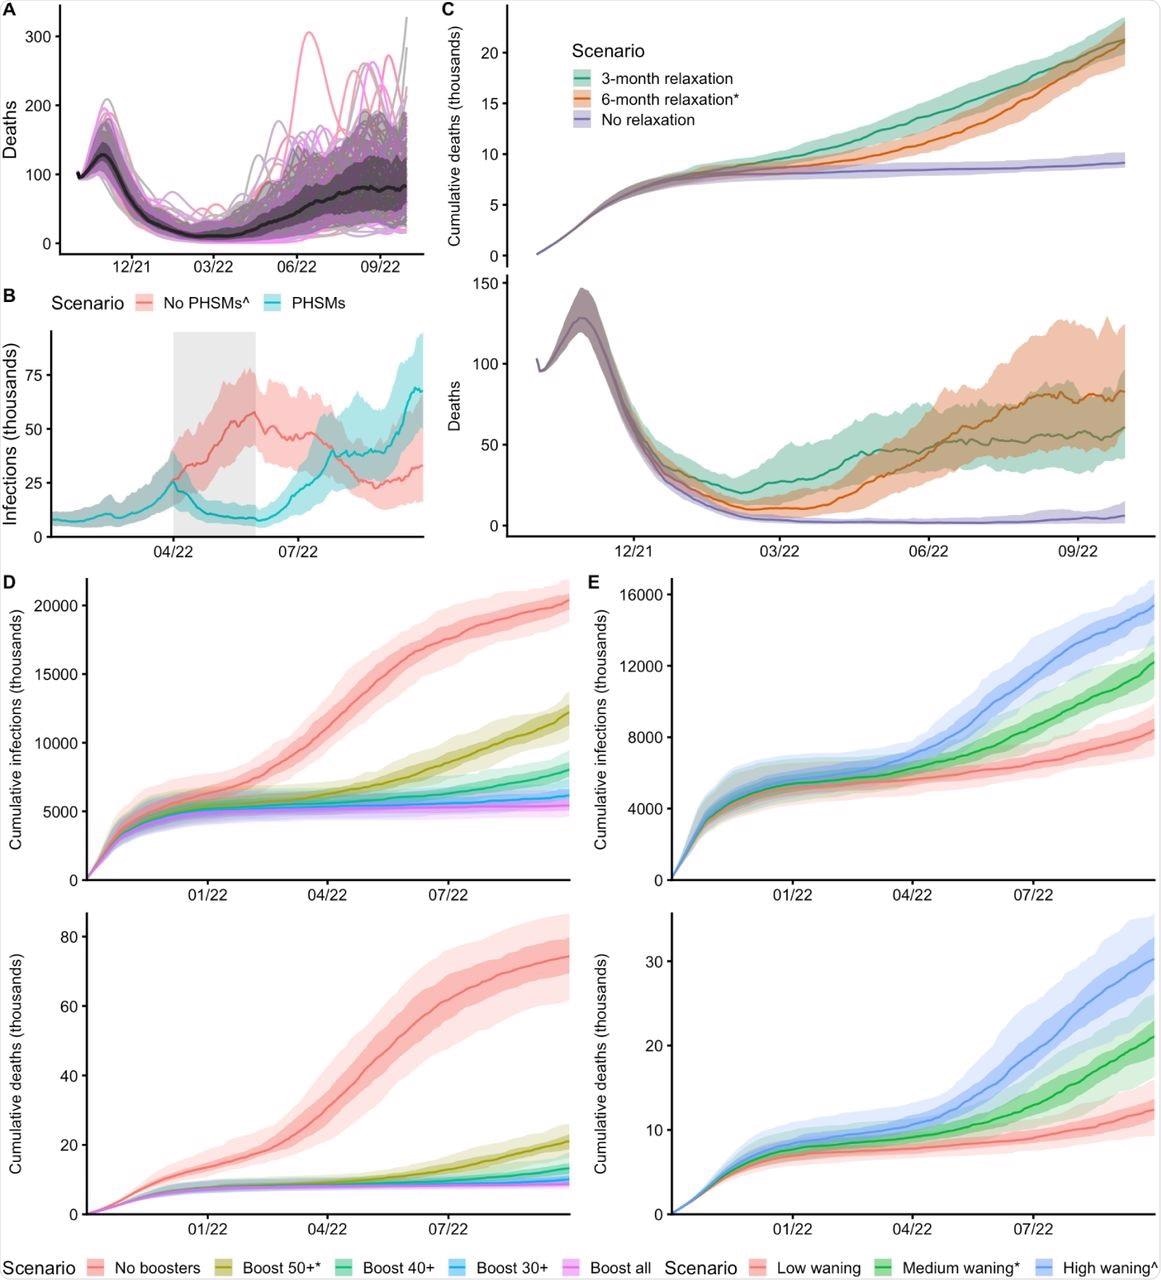 The central scenario is shown here which assumes a 6-month return to baseline mobility levels, medium waning of vaccine protection, 90% of vaccinated individuals aged 50 and above receiving booster vaccinations and 20% seasonality from 1st April 2021. The black line shows the median trajectory of COVID-19 deaths over time, with the shaded areas showing the 50% and 90% interquantile ranges. Individual model trajectories are plotted in colored lines. B: The effect of PHSMs on projected SARS-CoV-2 infections over time are shown with two scenarios. Both scenarios assume a 6-month return to baseline mobility levels, high waning of vaccine protection, 90% of vaccinated individuals aged 50 and above receiving booster vaccinations and 20% seasonality from 1st April 2021. The PHSMs scenario implements a combination of three PHSMs between 1st April and 31st May 2022. C: The effect of behavior on COVID-19 deaths and cumulative deaths over time is shown with three scenarios for future mobility: a 3-month and a 6-month return to baseline levels, and a no-change scenario. All three scenarios assume medium waning, 90% of vaccinated individuals aged 50 and above receiving booster vaccinations and 20% seasonality from 1st April 2021. D: The effect of booster vaccination policy on cumulative infections and deaths over time is shown with five scenarios for booster policies. All five scenarios assume a 6-month return to baseline mobility, medium waning and 20% seasonality from 1st April 2021. E: The effect of waning vaccine protection on cumulative infections and deaths over time is shown with three scenarios for waning. All three scenarios assume a 6-month return to baseline mobility, 90% of vaccinated individuals aged 50 and above receiving booster vaccinations and 20% seasonality from 1st April 2021. Scenarios marked with an asterisk (*) are equivalent, and scenarios marked with a caret (^) are equivalent.
Conclusion
The authors highlight that while SARS-CoV-2 transmission may fall in the early autumn of 2021, it will rapidly rise again and some of the worst-case scenarios could result in the same levels of death and hospitalization as 2020 and 2021. Therefore, the researchers of the current study recommend that governments are prepared to reintroduce lockdowns and other measures if necessary, as some European countries have already been forced to do.
This news article was a review of a preliminary scientific report that had not undergone peer-review at the time of publication. Since its initial publication, the scientific report has now been peer reviewed and accepted for publication in a Scientific Journal. Links to the preliminary and peer-reviewed reports are available in the Sources section at the bottom of this article. View Sources
 Genetic mapping in wastewater sets a new standard for pathogen surveillance