Antibody therapeutics are a dominating feature of the current drug development landscape, but increasing costs and time-consuming workflows represent major barriers to their discovery and development.
The Cyto-Mine® system from Fluidic Sciences and Sphere Bio leverages a powerful combination of picodroplet technology, microfluidics, and optics to accelerate therapeutic development by overcoming these challenges in Antibody Discovery (AbD) and Cell Line Development (CLD).
This article provides an overview of the next-generation Cyto-Mine® platform, Cyto-Mine® Chroma.
This advanced microfluidic platform features robust multi-laser, single-cell analysis capabilities designed to enable the high-throughput, multiplex functional screening of millions of cells per day.
The study presented here showcases Cyto-Mine® Chroma’s ability to precisely sort and dispense cells based on fluorescence signals and sequential gating, achieving over 90 % accuracy in terms of cell isolation based on cellular markers and productivity from mixed populations.
The study also simulates an AbD workflow, using Cyto-Mine® Chroma to precisely isolate rare cells secreting antigen-specific antibodies. Utilizing a viability dye alongside IgG-specific probes also allows the instrument to isolate CHO cells producing human IgG4 based on both productivity and viability, with no reduction in cell performance.
These results serve to highlight Cyto-Mine® Chroma’s powerful multiplexing capabilities, making it an essential tool for the isolation of specific cell populations in both AbD and CLD workflows.
Materials and methods
Instrument
Like its predecessor, Cyto-Mine® Chroma is a fully automated single-cell analysis platform able to encapsulate, analyze, sort, and dispense viable single cells (Figure 1a).
This most recent iteration of Cyto-Mine® Chroma features four lasers and four detectors (Figure 1b), expanding its capabilities to enable multiplexing within picodroplets (Figure 1c).
The Cyto-Mine® Chroma process features a number of integrated stages (Figure 1d). Cells and assay reagents are encapsulated into picodroplets prior to being transferred into the incubation chamber. Incubation takes place at the optimum temperature for target protein secretion.
Secreted target protein is captured as it accumulates inside the picodroplet. Cyto-Mine® Chroma is used to detect any cells secreting the desired protein as cells are sorted and dispensed into tissue culture plates.
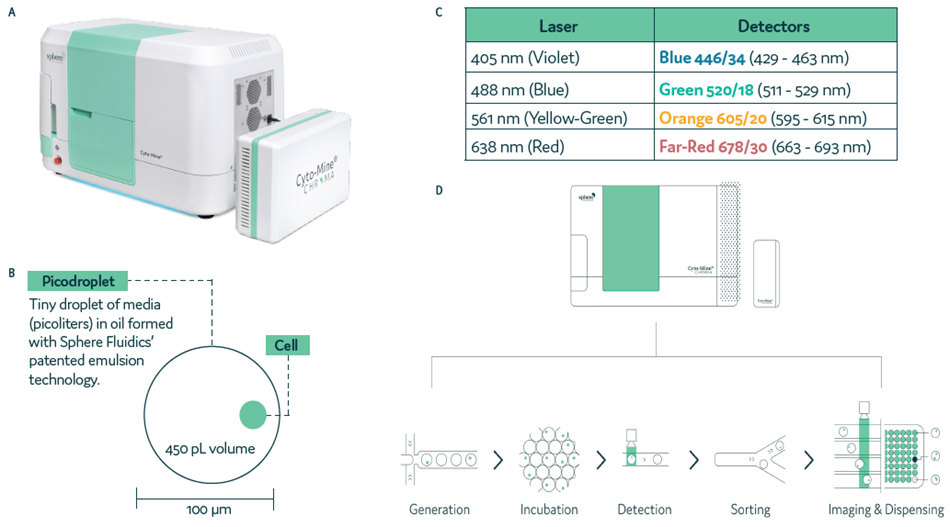
Figure 1. Cyto-Mine® Chroma, the next-generation single-cell analysis platform. Image Credit: Fluidic Sciences and Sphere Bio
Study 1: Accuracy of sequential gating during sorting
Sorting and gating accuracy was determined by labeling four cell samples with different cell membrane dyes:
- CellTracker™ Green CMFDA (Green, CT-Green)
- CellTracker™ Orange CMTMR (Orange, CT-Orange)
- eBioscience™ Cell Proliferation Dye eFluor™ 450 (Blue, eFL450) eBioscience™ Cell Proliferation Dye eFluor™ 670 (Red, eFL670)
Stained cells were mixed prior to loading onto Cyto-Mine® Chroma. Before being dispensed, cells were gated for a single dye, excluding all others.
Gating and sorting accuracy was determined via fluorescence microscope. This process was repeated for all four colors of cell membrane dye (Figure 2a and Figure 2b).
Study 2: Detecting antibody secretion
Two different hybridoma cell lines were labeled with different dyes in order to detect antibody-secreting cells. These dyes were:
- eFL450 (Blue)
- eFL670 (Far Red)
Cell lines were also mixed with anti-mouse IgG FRET probes:
- Donor- Dylight488 (DL488, Green)
- Acceptor- Dylight594 (DL594, Orange)
Cells were loaded onto Cyto-Mine® Chroma and sequentially gated at sorting. This was initially done by FRET+ response and then by the presence of Blue cells.
The same sequential gating used in sorting the cells was used to dispense them. A fluorescence microscope was then used to determine gating, sorting, and dispensing accuracy (Figure 3a and Figure 3b).
Study 3: Detecting antibody binding to its antigen
Antibody-secreting hybridoma cells labeled with eFL450 (Blue) were mixed with target cells expressing a specific antigen that had been labeled with eFL670 (Far Red). This enabled the detection of antigen-specific antibody binding.
The detection antibody-AF488 (Green) was used to detect antibody binding to target cells. To accomplish this, cells were loaded onto Cyto-Mine® Chroma before being sorted for droplets containing localized antibody-secreting cells (ASC), target cells, and detection antibody.
In this example study, cells were dispensed using sequential gating, with gating, sorting, and dispensing accuracy determined via a fluorescence microscope (Figure 4a and Figure 4b).
Study 4: Detecting apoptosis and dead cells in droplets
This study involved a CHO cell line secreting human IgG4κ antibody being mixed with a combination of:
- Cyto-Cellect® (Fluidic Sciences and Sphere Bio, Donor conjugated with AF488 (Green), and Acceptor conjugated to AF594 (Orange))
- A viability dye conjugated to AF670 (Far Red)
Cells were loaded onto Cyto-Mine® Chroma with droplets gated for the presence of FRET+ viable cells before being dispensed. Gating and sorting accuracy was determined using v10.10.0 of the Flowjo software (Figure 5a and Figure 5b).
Results
Study 1: Accurate sorting and gating of encapsulated live cells
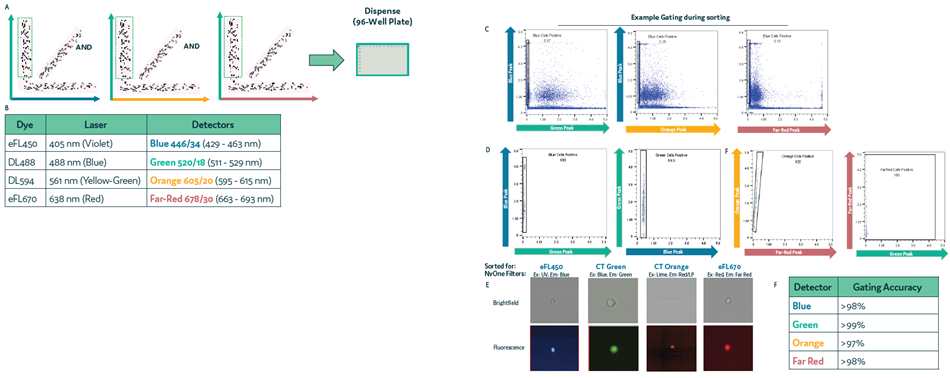
Figure 2. Accuracy in sorting and gating in Cyto-Mine® Chroma. Four cell samples, each labeled with a different membrane dye, were mixed and loaded onto Cyto-Mine® Chroma. Cells were gated during sorting for a single dye, excluding all others, followed by dispensing. (a) Schematic diagram for gating during sorting. (b) List of fluorochromes used in the assay. (c) An example of gating strategy, used for sorting of Blue cells and the corresponding cell population following dispensing. (d) Dot plot of dispensed population for Blue, Green, Orange and Far Red labeled cells, using the example gating strategy shown in (c). (e) Example images of dispensed cells following sorting and dispensing of specific cell population. (f) Microscopy data of dispensed cells was used to determine the accuracy of gating during sorting. Image Credit: Fluidic Sciences and Sphere Bio
Study 2: Single cell detection and isolation of antibody-secreting cells
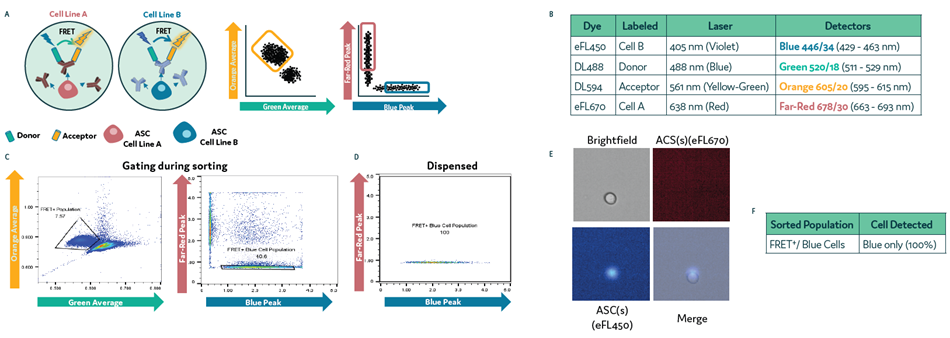
Figure 3. Isolation of Subpopulations of Secreting Cells on Cyto-Mine® Chroma. Two differentially labeled cell populations were pre-mixed with anti-mouse IgG FRET probes and loaded onto Cyto-Mine® Chroma. (a) Schematic diagram for assay reaction and gating strategy during sorting. (b) List of fluorochromes used in the assay. c) Cells were gated in sorting on FRET+ followed by Blue cell- only gating. d) Profile of cells dispensed. (e) Example images of dispensed cells following sorting and dispensing of specific cell population. (f) Microscopy data of dispensed cells was used to determine the accuracy of gating during sorting. Image Credit: Fluidic Sciences and Sphere Bio
Study 3: Isolation of antibody-secreting cells through antigen-specific binding
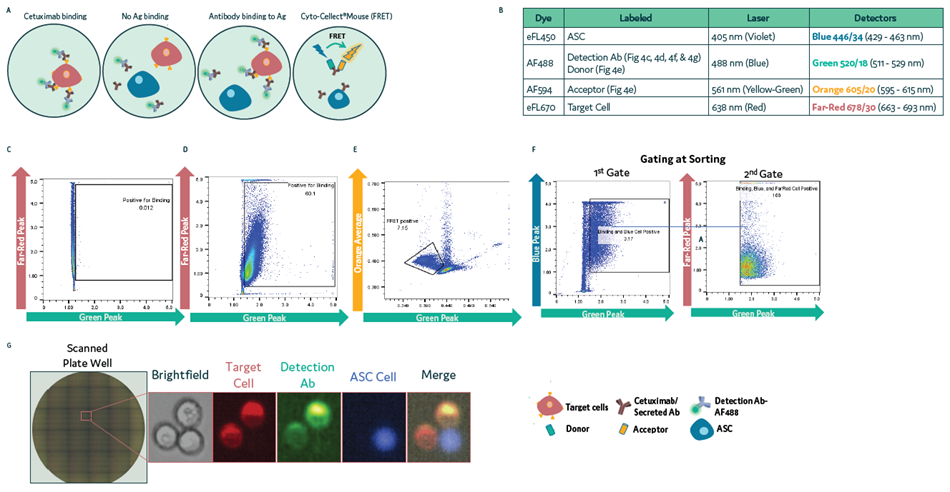
Figure 4. Isolation of ASC using surface binding assay in Cyto-Mine® Chroma. (a) Schematic diagram for assay reaction and gating strategies used during sorting. (b) List of fluorochromes used in the assay. (c-d) A431 target cells labeled with eFL670 were mixed with anti-hIgG-AF488 Ab in the absence (c) or presence (d) of Cetuximab. Cells were loaded on Cyto-Mine® Chroma and gated for Far Red & Green signals during sorting. (e) IgG secretion of ASC using Cyto-Cellect® Mouse FRET probes. (f-g) ASC labeled with eFL450 were mixed with eFL670- labeled target cells in the presence of AF488-detection antibody. Droplets were gated during sorting (f) and dispensed into 96 well plates. (g) Dispensed cells were imaged using a fluorescence microscope. Image Credit: Fluidic Sciences and Sphere Bio
Study 4: Differentiating FRET+ viable cells from apoptotic or dead cells
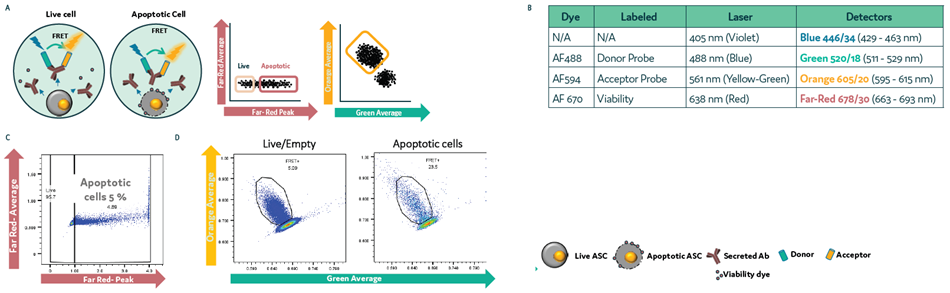
Figure 5. Differentiating FRET+ dead/dying cells from live cells in picodroplets. CHO cells secreting hIgG4 antibody were mixed with Cyto-Cellect® probes and viability dye. Cells were loaded onto Cyto-Mine® Chroma and incubated for 1 hour. Cells were gated for apoptosis and FRET signal. (a) Schematic diagram for assay reaction and gating strategy during sorting. (b) List of fluorochromes used in the assay. (c) Gating of cells during sorting. (d) Analysis of FRET response in live versus apoptotic cell population. Image Credit: Fluidic Sciences and Sphere Bio
Conclusions
The study presented here confirmed that the Cyto-Mine® Chroma platform is able to reliably detect both localized (antibody-antigen binding) and dispersed (IgG secretion, FRET signal) fluorescence.
It is also able to accurately distinguish between different cell types based on their specific staining when combined with fluorescently stained cells, as well as demonstrating excellent sorting accuracy and enrichment of target populations when used after sequential gating.
These example studies showcase the Cyto-Mine® Chroma’s reliability when used in multiplexing assays for both AbD (productivity and antigen specificity) and CLD (productivity and viability).
Acknowledgments
Produced from materials originally authored by Maryam Ahmadi, Elena Shvets, Frank Gesellchen, Jitender Bisht, Joshua Stewart, Manju Namdeo, Marco Stefano Torrisi, Sophie Davies, John Lesnick, and Richard Hammond from Fluidic Sciences and Sphere Bio.
About Fluidic Sciences and Sphere Bio
Fluidic Sciences develops transformative in‑solution technologies for protein interaction analysis. Its flagship Fluidity One‑M instrument leverages Microfluidic Diffusional Sizing (MDS) to measure binding affinity, stoichiometry, size, and concentration without immobilization - directly in complex backgrounds such as serum, plasma, and lysate.
Sphere Bio is a brand of Fluidic Sciences. Its technology develops and manufactures single‑cell analysis and monoclonality assurance systems that enable researchers to find, analyze, and isolate the most valuable cells with speed and precision. Its proprietary picodroplet microfluidics and Cyto‑Mine® Chroma multiplexing platform power applications across antibody discovery, cell line development, cell engineering, and cell therapy.
Sponsored Content Policy: News-Medical.net publishes articles and related content that may be derived from sources where we have existing commercial relationships, provided such content adds value to the core editorial ethos of News-Medical.Net which is to educate and inform site visitors interested in medical research, science, medical devices and treatments.