Following extraction from source material, nucleic acids are commonly quantified either by UV-Vis absorbance at 260 nm or through fluorescent dye-binding assays.
Fluorescence-based approaches are typically favored when high sensitivity is required. Nevertheless, co-extracted contaminants–including salts, phenol, and proteins–are common, and absorbance purity ratios, particularly A260/A280 and A260/A230, can indicate whether such contaminants are present.1–3
Contaminants are known to inhibit polymerase chain reactions (PCR), highlighting the importance of assessing purity before downstream workflows.1–5 In fluorescent dye-binding assays, detergents, salts, organic solvents, and pH shifts have all been reported to interfere with dye binding at particular concentrations.1–9
This article examines how contaminants affect the Thermo Scientific™ NanoDrop™ Ultra dsDNA Broad Range (BR) Fluorescence Assay Kit and evaluates the contribution of UV-Vis absorbance to sample-quality assessment.
Methods
Lambda dsDNA (Thermo Scientific™, SD0011) was diluted in Tris-EDTA (TE) buffer, and contaminants were added at the levels listed in Table 1. Final dsDNA concentrations were 100, 50, 10, and 0 ng/μL, with each concentration combined separately with low, medium, and high contaminant levels.
Absorbance measurements were obtained using the microvolume pedestal of a Thermo Scientific™ NanoDrop™ UltraC FL Microvolume Spectrophotometer and Fluorometer with the dsDNA application.
The instrument was blanked using TE buffer, and five replicate readings were collected for each sample. Fluorescence measurements were carried out with the NanoDrop Ultra dsDNA BR assay kit according to the manufacturer’s protocol. Five replicate measurements were performed on the NanoDrop UltraC FL instrument using the microvolume pedestal and blue LED.
Table 1. Final concentrations of contaminants spiked in dsDNA preparations. Source: Thermo Fisher Scientific - UV-Vis Spectroscopy
| Contaminant level |
BSA |
Phenol |
Ethanol |
Sodium acetate |
| Low |
0.6 mg/mL |
0.5% |
1% |
10 mM |
| Medium |
1.0 mg/mL |
1% |
15% |
50 mM |
| High |
2.0 mg/mL |
2% |
30% |
100 mM |
Results
Nucleic acid controls were compared to verify that any differences between absorbance and fluorescence readings resulted from contamination rather than methodological variation (Figure 1). R² specifically demonstrates linear correlation, not agreement. If the underlying values themselves agree closely, agreement can be established separately. I'd change this to “showed a strong linear correlation.
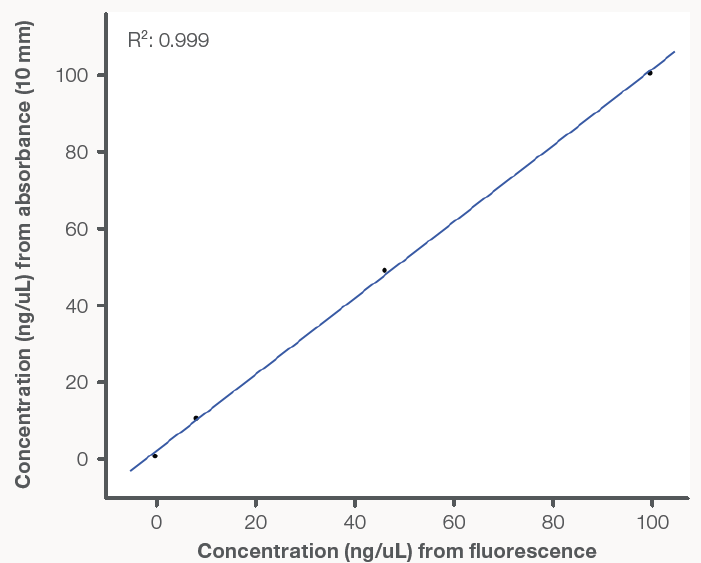
Figure 1. Linearity comparison of lambda dsDNA control concentrations determined by absorbance and fluorescence using the NanoDrop UltraC FL Spectrophotometer and Fluorometer. Points represent the mean (n=5); R2=0.999. Image Credit: Thermo Fisher Scientific - UV-Vis Spectroscopy
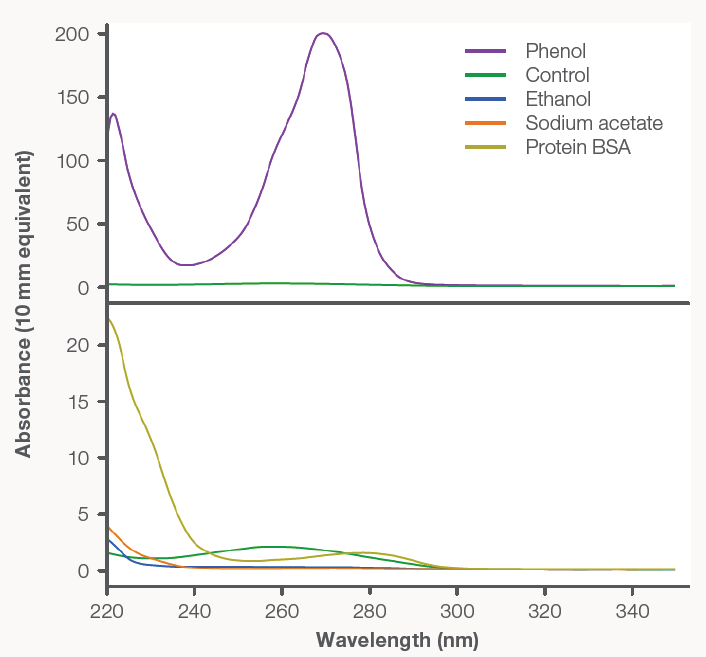
Figure 2. Spectra overlay of pure stock contaminants blanked with dH2O, and dsDNA blanked with TE buffer. Top: 100 ng/μL control dsDNA (green) and phenol (purple). Bottom: 100 ng/μL control dsDNA (green), protein BSA (yellow), ethanol (blue), and sodium acetate (orange). Image Credit: Thermo Fisher Scientific - UV-Vis Spectroscopy
Figure 2 presents the absorbance spectra of each contaminant alongside a 100 ng/μL dsDNA control. Phenol, protein (BSA), ethanol, and sodium acetate all absorbed at 230 nm and below; in addition, ethanol, phenol, and protein (BSA) showed absorbance at both 260 nm and 280 nm.
Because nucleic acid quantification by UV-Vis spectrophotometry depends on absorbance at 260 nm, contaminants with overlapping spectral features can cause nucleic acid concentrations to be overestimated.
Examining a nucleic acid sample’s absorbance spectrum and purity ratios (A260/A230 and A260/A280) can reveal the presence of contaminants. Table 2 shows how purity ratios change as contaminant levels increase. For “pure” dsDNA, acceptable A260/A280 and A260/A230 ratios are 1.8 and 2–2.2, respectively.
Changes in these ratios reflect the absorbance characteristics of the contaminants: protein contamination primarily alters A260/A280, whereas organic solvents and salts mainly influence A260/A230.
Table 2. Absorbance purity ratios (A260/A280 and A260/A230) and fluorescence percent error for the 100 ng/μL dsDNA sample per contaminant type and spike level. Red values indicate outside of acceptable range; green values are within acceptable range. The percent error cutoff is 20% per the acceptance criteria for the NanoDrop Ultra dsDNA BR assay kit. Source: Thermo Fisher Scientific - UV-Vis Spectroscopy
| Contaminant level |
Low |
Medium |
High |
| Purity ratios & FL percent error |
A260/A280 |
A260/A230 |
%Error |
A260/A280 |
A260/A230 |
%Error |
A260/A280 |
A260/A230 |
%Error |
| Control (no contaminant) |
1.86 |
2.08 |
1.53 |
- |
- |
- |
- |
- |
- |
| BSA |
1.58 |
0.6 |
7.48 |
1.41 |
0.38 |
24.04 |
1.17 |
0.24 |
31.08 |
| Phenol |
2.17 |
31.8 |
11.05 |
2.45 |
2.59 |
12.01 |
2.34 |
2.53 |
17.32 |
| Ethanol |
1.89 |
2.12 |
17.19 |
1.87 |
2.28 |
17.07 |
1.85 |
2.58 |
31.33 |
| Sodium acetate |
1.92 |
4.21 |
44.9 |
1.92 |
4.26 |
43.79 |
1.9 |
2.75 |
58.15 |
To assist with purity assessment, the Thermo Scientific™ Acclaro™ Contaminant Identification (ID) Technology identifies protein and phenol in dsDNA samples. Available on all NanoDrop Ultra models, this integrated feature examines each sample spectrum and applies chemometric algorithms to predict the contaminant present.
Contaminant detection is important because contaminants can directly affect the accuracy of fluorescence quantification, as shown in Table 2. The table doesn't consistently show that relationship. For ethanol, error goes 17.19 → 17.07 → 31.33%; sodium acetate goes 44.9 → 43.79 → 58.15%. Purity ratios also don't consistently move farther from the stated acceptable ranges as contamination increases.
This pattern was observed across the dsDNA concentration range and is illustrated for 50 ng/μL dsDNA in Figure 3. These findings show that fluorescent dye-binding assays are not inherently resistant to contamination and that an absorbance-based purity measurement is essential for accurate quantification.
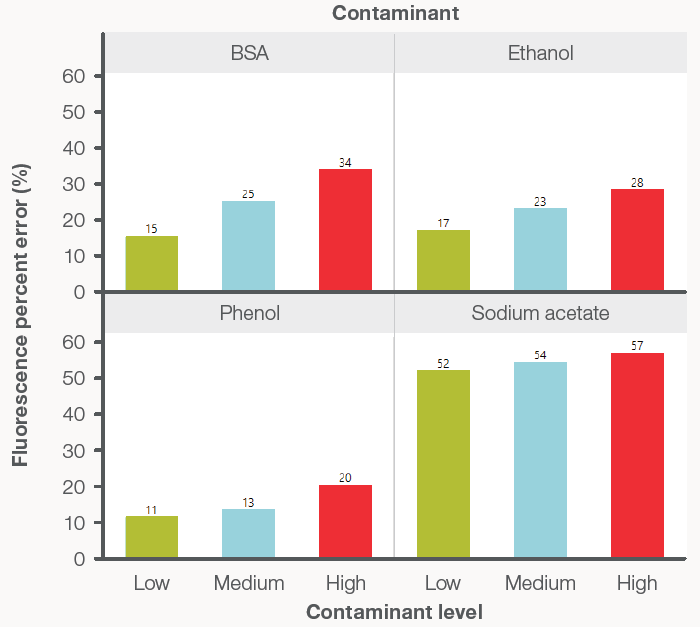
Figure 3. Relationship between fluorescence concentration percent error (%) and contaminant level for the 50 ng/μL dsDNA concentration dataset. Bars represent the mean percent error (n=5) for contaminant levels high (red), medium (blue), and low (green). Image Credit: Thermo Fisher Scientific - UV-Vis Spectroscopy
Figure 4 compares the concentrations reported by absorbance and fluorescence. UV-Vis absorbance is a direct and additive measurement: any substance that absorbs light at the analytical wavelength contributes to the measured absorbance and, therefore, the calculated concentration.
For nucleic acids, the analytical wavelength is 260 nm; consequently, increasing amounts of protein (BSA), phenol, and ethanol inflated absorbance-derived concentration results in a manner consistent with their absorbance spectra.
Using phenol as an example, its spectrum in Figure 2 absorbed at 260 nm approximately 50 times more strongly than the dsDNA control. This reflects phenol’s high extinction coefficient, meaning only a small quantity is sufficient to artificially raise the apparent nucleic acid concentration measured by UV-Vis spectrophotometry.
In contrast, fluorescence-based nucleic acid measurement depends on dye binding. The results in Figure 4 indicate that fluorescent readings were affected by protein (BSA), phenol, ethanol, and sodium acetate.
As contaminant concentration increased, the fluorescent signal declined, suggesting that interactions between dye and nucleic acid are sensitive to contaminants in a dose-dependent fashion.
Although the precise mechanism underlying this effect was not investigated here, the observed trend indicates that co-extracted contaminants can introduce error into both absorbance- and fluorescence-based nucleic acid quantification.
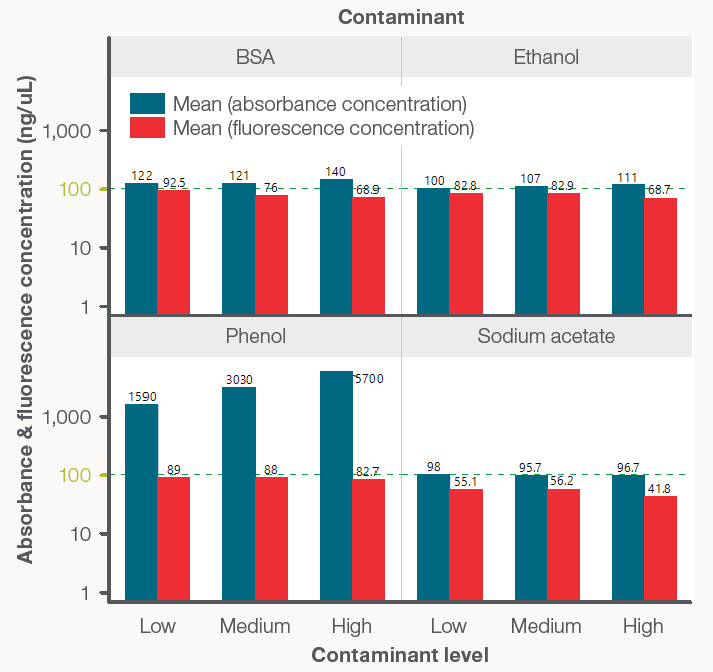
Figure 4. Comparison of absorbance (blue bars) and fluorescence-based (red bars) quantification for the 100 ng/μL dsDNA sample in the presence of increasing contaminant levels. Bars and labels represent the mean concentration (n=5). The green dashed lines indicate the control concentration at 100 ng/μL. The y-axis is displayed on a logarithmic scale. Image Credit: Thermo Fisher Scientific - UV-Vis Spectroscopy
Conclusions
Contaminants frequently co-extracted with nucleic acids were found to introduce error into both absorbance- and fluorescence-based quantification. Absorbance readings were artificially elevated by contaminants absorbing at 260 nm, whereas fluorescence signals decreased in their presence.
Nucleic acid absorbance purity ratios (A260/A280 and A260/A230) offered insight into contaminant presence and helped predict fluorescence performance. Evaluating spectral data and purity ratios together with Acclaro contaminant ID technology provides information on nucleic acid quality and indicates whether further purification is needed before quantification.
Because the NanoDrop Ultra FL instrument functions as both a UV-Vis spectrophotometer and fluorometer, a rapid absorbance-based quality check before a sensitive fluorescence measurement can strengthen confidence in nucleic acid quantification.
References and further reading
- Bustin, S.A., et al. (2009). The MIQE Guidelines: Minimum Information for Publication of Quantitative Real-Time PCR Experiments. Clinical Chemistry, 55(4), pp.611–622. DOI:10.1373/clinchem.2008.112797. https://academic.oup.com/clinchem/article-abstract/55/4/611/5631762.
- Shin, J.H. (2012). Nucleic Acid Extraction Techniques. Advanced Techniques in Diagnostic Microbiology, pp.209–225. DOI:10.1007/978-1-4614-3970-7_11. https://link.springer.com/chapter/10.1007/978-1-4614-3970-7_11.
- Schrader, C., et al. (2012). PCR inhibitors - occurrence, properties and removal. Journal of Applied Microbiology, 113(5), pp.1014–1026. DOI:10.1111/j.1365-2672.2012.05384.x. https://academic.oup.com/jambio/article-abstract/113/5/1014/6715439?redirectedFrom=fulltext.
- Unger, C., et al. (2019). Detection of phenol contamination in RNA samples and its impact on qRT-PCR results. Analytical Biochemistry, 571, pp.49–52. DOI:10.1016/j.ab.2019.02.002. https://www.sciencedirect.com/science/article/abs/pii/S0003269718312545?via%3Dihub.
- Sidstedt, M., Rådström, P. and Hedman, J. (2020). PCR inhibition in qPCR, dPCR and MPS–mechanisms and solutions. Analytical and Bioanalytical Chemistry, 412(9), pp.2009–2023. DOI:10.1007/s00216-020-02490-2. https://link.springer.com/article/10.1007/s00216-020-02490-2.
- Singer, V.L., et al. (1997). Characterization of PicoGreen Reagent and Development of a Fluorescence-Based Solution Assay for Double-Stranded DNA Quantitation. Analytical Biochemistry, 249(2), pp.228–238. DOI:10.1006/abio.1997.2177. https://www.sciencedirect.com/science/article/abs/pii/S0003269797921771?via%3Dihub.
- Ban, E. and Kim, A. (2024). PicoGreen Assay for Nucleic Acid Quantification - Applications, Challenges, and Solutions. Analytical biochemistry, 692, pp.115577–115577. DOI:10.1016/j.ab.2024.115577. https://www.sciencedirect.com/science/article/abs/pii/S0003269724001210?via%3Dihub.
- Holden, M.J., et al. (2009). Factors Affecting Quantification of Total DNA by UV Spectroscopy and PicoGreen Fluorescence. Journal of Agricultural and Food Chemistry, 57(16), pp.7221–7226. DOI:10.1021/jf901165h. https://pubs.acs.org/jafcau/article-abstract/57/16/7221/813041/Factors-Affecting-Quantification-of-Total-DNA-by?redirectedFrom=fulltext.
- Lakowicz, J. R. Principles of Fluorescence Spectroscopy. 2nd ed. New York: Kluwer Academic/Plenum, 1999. Print.
About Thermo Fisher Scientific - UV-Vis Spectroscopy

UV-Vis Spectrometers overview
Scientists can count on our broad range of ultraviolet (UV) and visible (Vis) spectrophotometers to deliver reliable, accurate data. The Thermo Scientific SPECTRONIC 200, GENESYS, and Evolution product lines are designed to streamline measurements providing consistent, high-quality results, time after time. Additionally, the innovative Thermo Scientific NanoDrop microvolume family of instruments, have been helping scientists accelerate the pace of discovery for over 20 years. From classroom teaching–to routine measurements–to discovery of the next scientific breakthrough, our line of spectrophotometers is designed to fit into any modern laboratory.
Sponsored Content Policy: News-Medical.net publishes articles and related content that may be derived from sources where we have existing commercial relationships, provided such content adds value to the core editorial ethos of News-Medical.net, which is to educate and inform site visitors interested in medical research, science, medical devices and treatments.