The COVID-19 pandemic has caused severe morbidity and mortality throughout the world. The development of COVID-19 vaccines and their implementation has played a critical role in curbing the transmission and severity of the disease. However, there is limited data underlining the overall impact of the COVID-19 vaccines on public health.
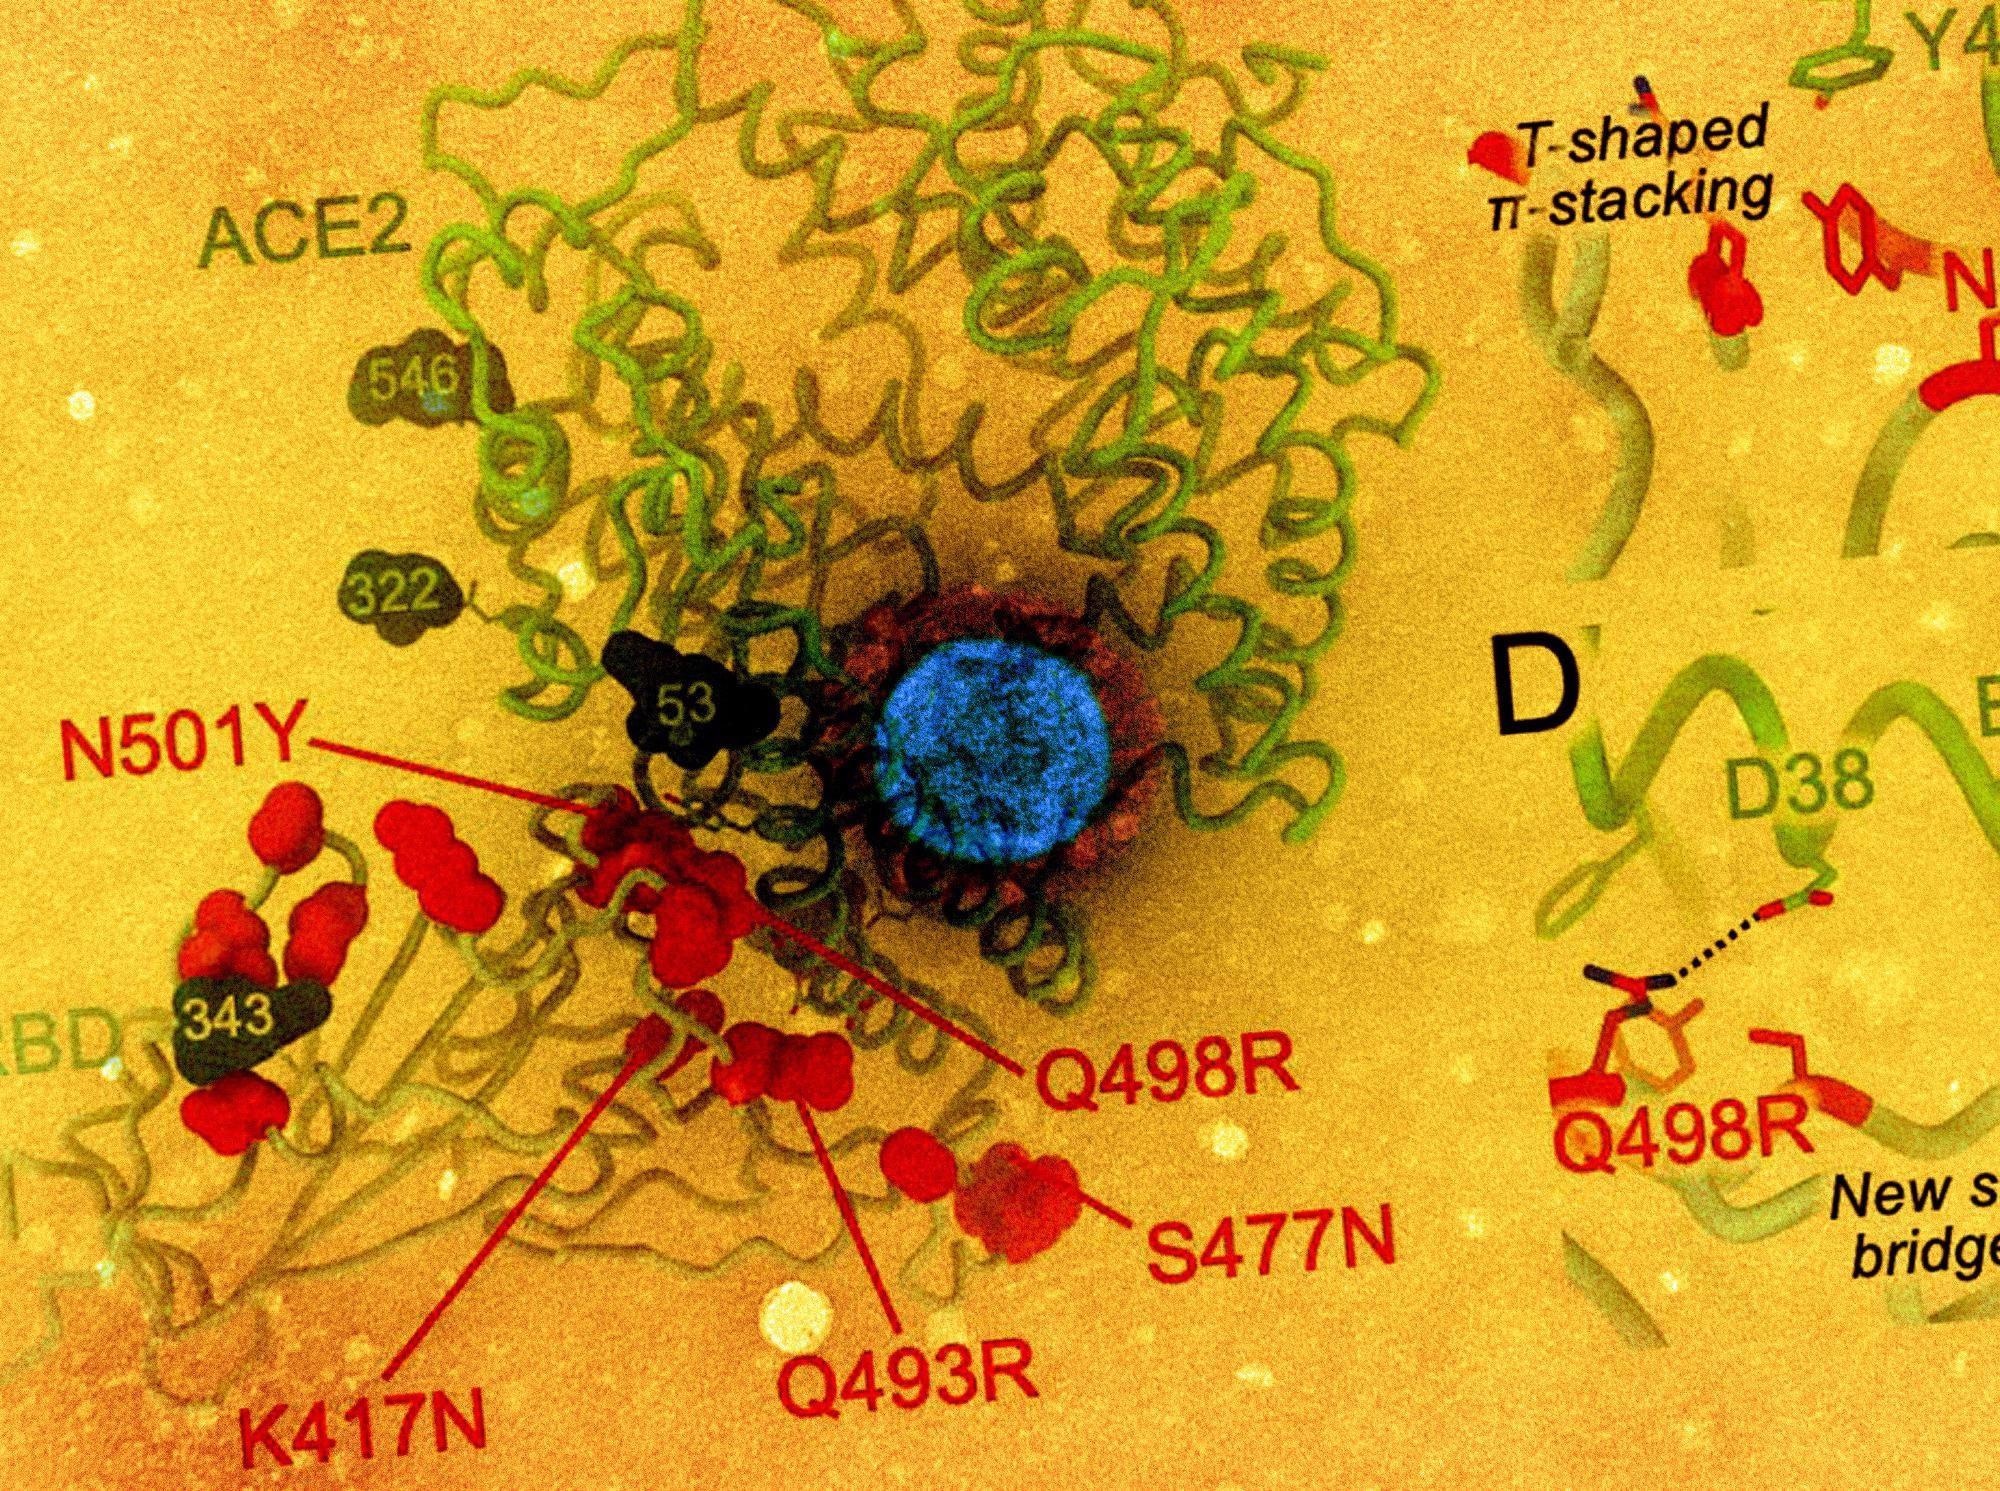 Study: Estimation of COVID-19 cases prevented by vaccination in California. Image Credit: NIAID
 This news article was a review of a preliminary scientific report that had not undergone peer-review at the time of publication. Since its initial publication, the scientific report has now been peer reviewed and accepted for publication in a Scientific Journal. Links to the preliminary and peer-reviewed reports are available in the Sources section at the bottom of this article. View Sources
About the study
The present study reported the number of COVID-19 cases prevented in the first 10 months following the administration of COVID-19 vaccines in a California-based population.
Person-level data related to COVID-19 infection were collected from the California Department of Public Health (CDPH) between 1 January 2020 and 16 October 2021. The data was divided into age groups of 12 to 17 years, 18 to 49 years, 50 to 64 years, and 65 years and above.
The number of COVID-19 cases impeded due to vaccination was estimated using two independent statistical modeling approaches. The primary model showed the number of COVID-19 cases that would have occurred in the absence of vaccines. The correlation between the number of weekly COVID-19 infections among the unvaccinated population and the four age groups eligible for vaccination before the availability of vaccines was estimated with quasi-Poisson regression models. This data was then compared to the observed infections in the two cohorts when vaccination was available. The total differences in the cases across all age groups before and after vaccine availability estimated the total number of cases averted due to vaccination.
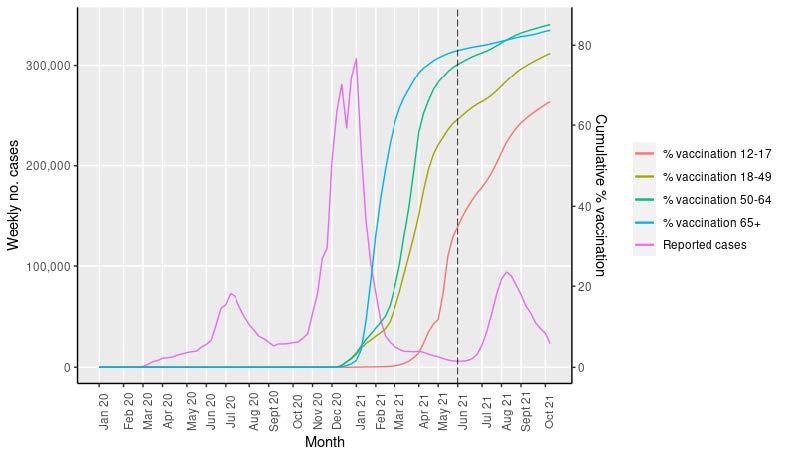
COVID-19 cases and vaccination over time in California. Data on COVID-19 cases were obtained from CPDH for the period of January 1, 2020 to October 16, 2021. Weekly absolute COVID-19 cases were plotted (purple). We plotted cumulative coverage of COVID-19 vaccination by age-group using publicly available data from January 1, 2020 to October 16, 2021. We defined date of vaccination as the date of first vaccine dose receipt in persons who received at least 1 dose of a COVID-19 vaccine (Pfizer/BioNTech, Moderna, Janssen). The dashed line (black) represents introduction of the delta variant in California.
The second model predicted the number of COVID-19 cases prevented as a direct result of vaccination. The state-level weekly number of cases was estimated in the four populations eligible to receive COVID-19 vaccines.
The team evaluated the number of people vulnerable to COVID-19 infection in each age group over time, according to vaccination or natural immunity. Estimated risk of SARS-CoV-2 infection according to age was applied to the overall risk of infection for that age group, assumed in the absence of vaccination.
The number of SARS-CoV-2 infections prevented as a result of vaccination was the study's primary outcome. The relative reduction in the number of cases due to vaccination was also estimated. The secondary outcomes included the reduced number of COVID-19 cases and relative reduction of the cases per age group.
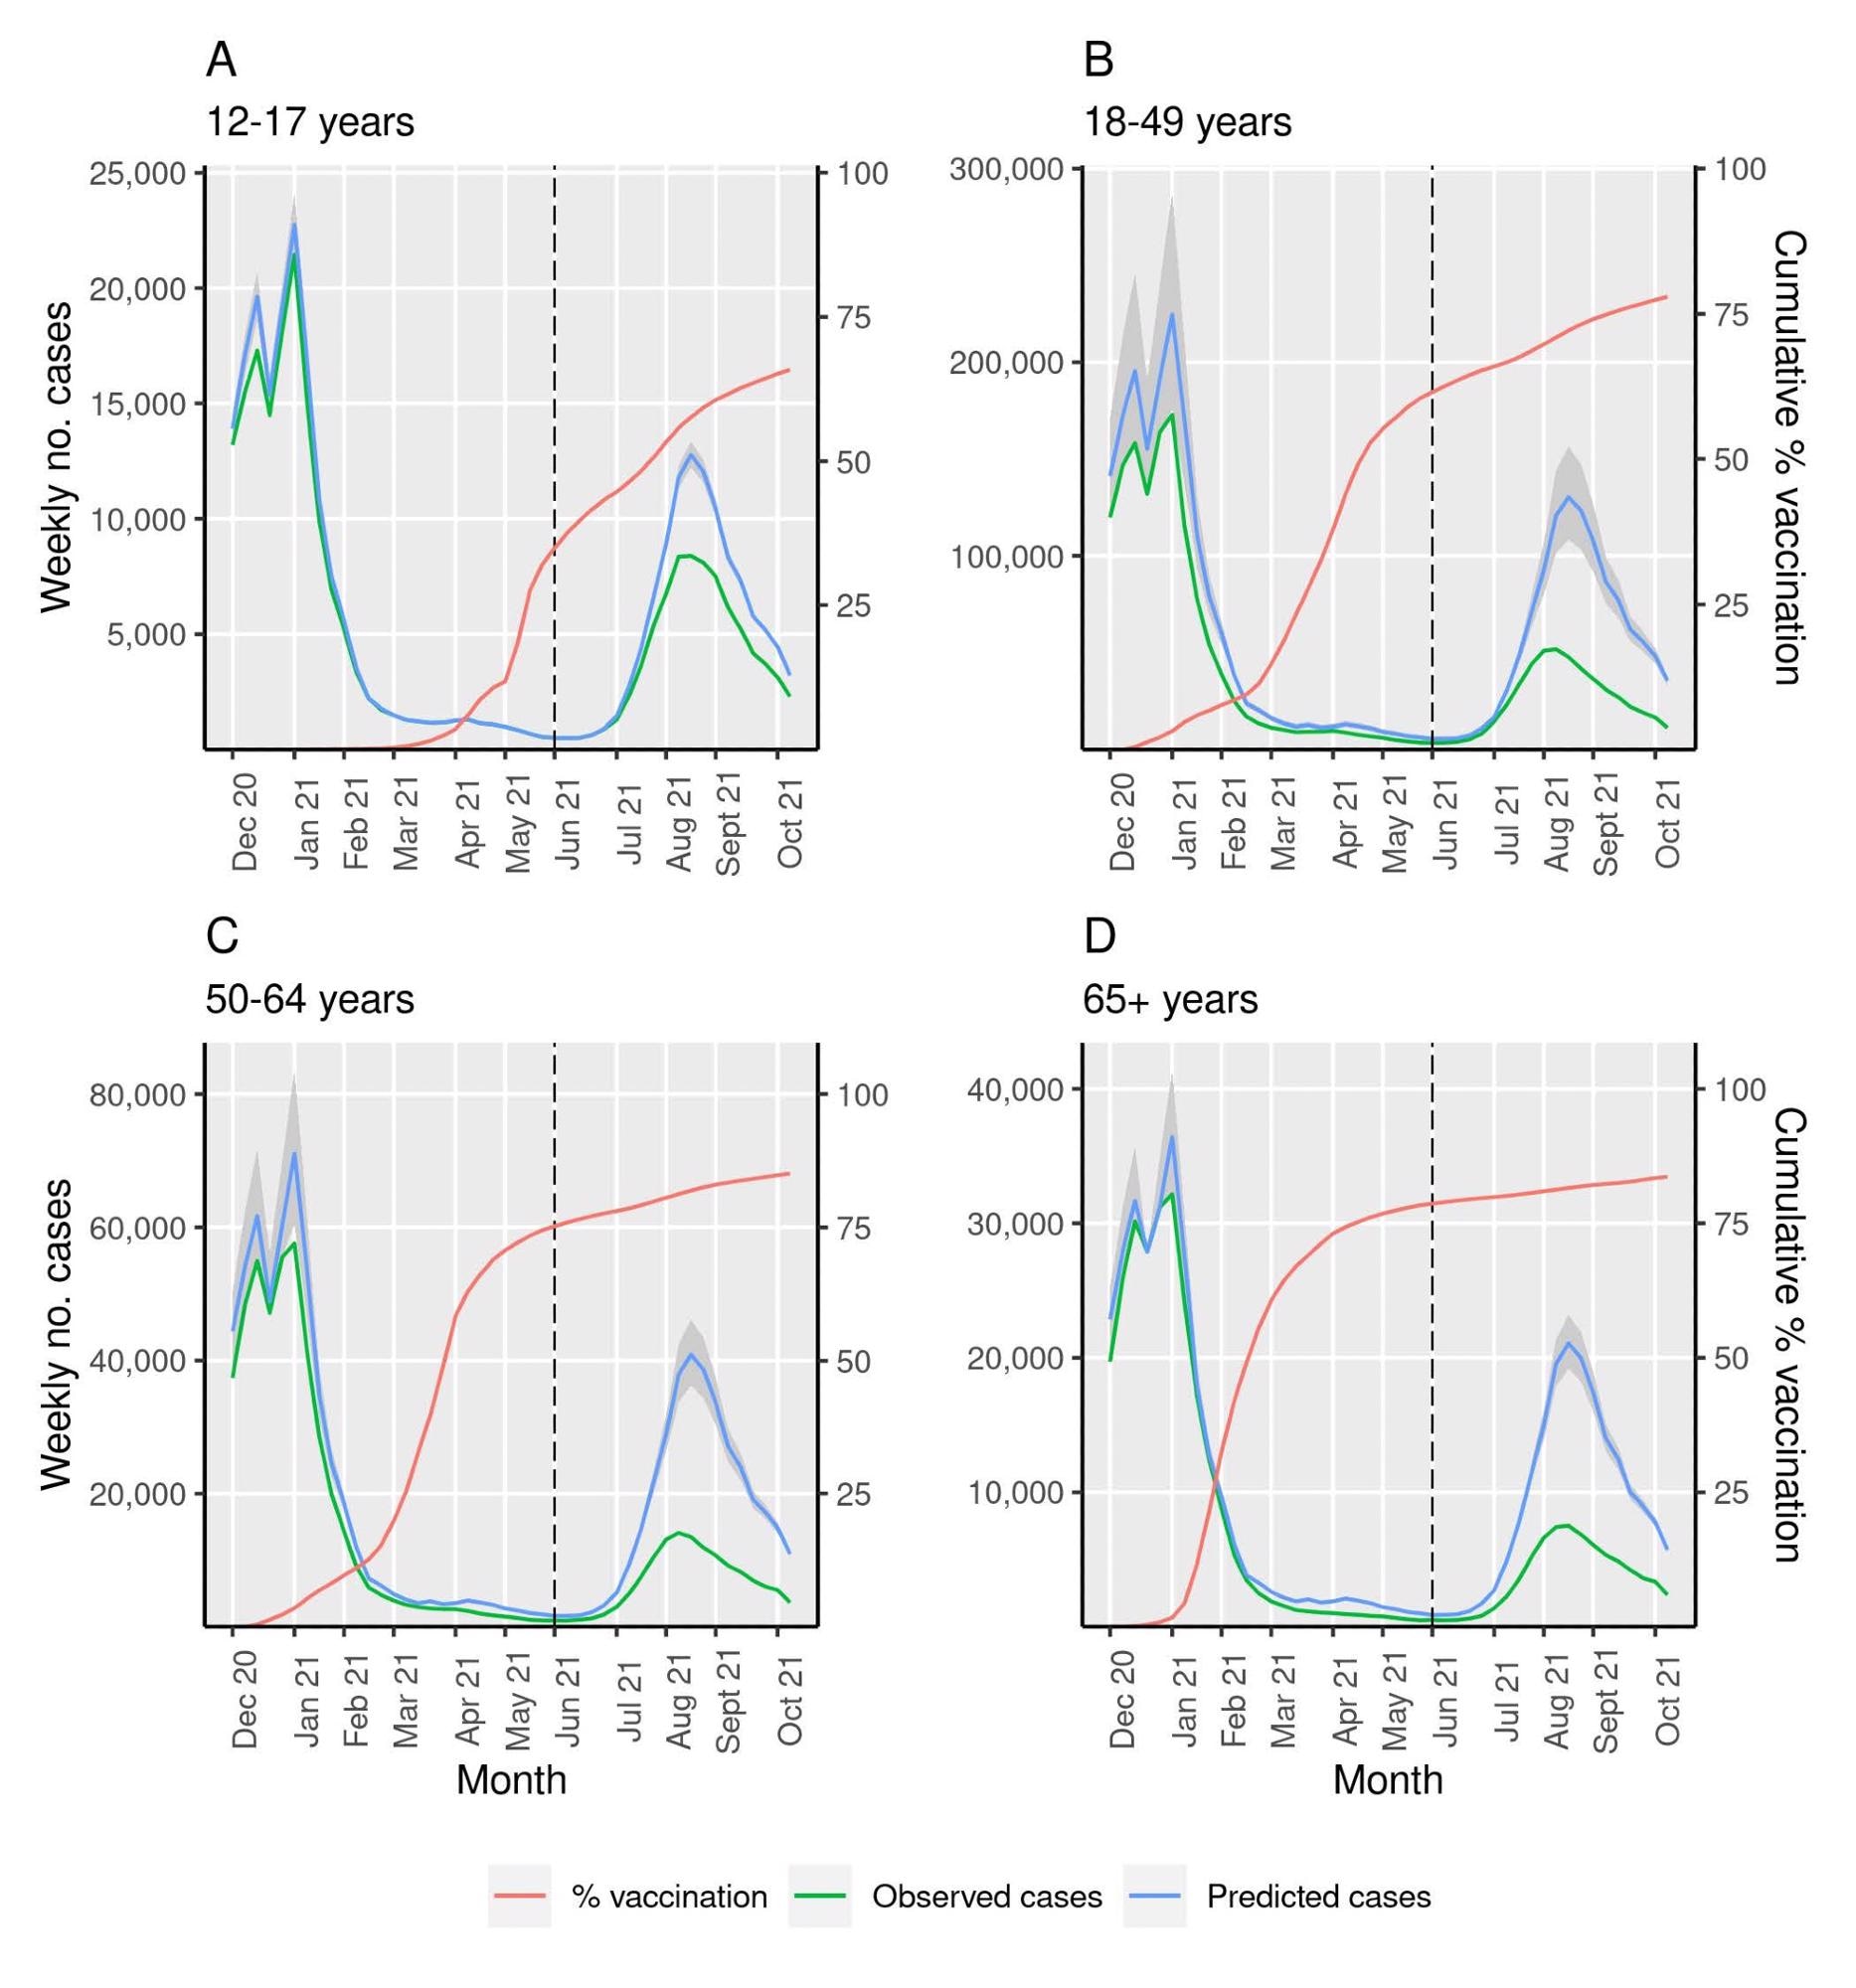 Primary model estimating averted COVID-19 cases due to COVID-19 vaccination in California by age group. We plotted observed COVID-19 cases (green) and vaccine coverage of at least one dose of a COVID-19 vaccine (red) over time in four age groups that represent the vaccine-eligible population: 12-17 years (A), 18-49 years (B), 50-64 years (C) and ≥65 years (D). In the primary analysis, we estimated the association between cases in the unvaccinated group (<12 years) and each vaccineeligible age-group before Phase 1a of vaccination to predict COVID-19 cases in each vaccine-eligible age-group in absence of vaccination (blue) with prediction intervals in grey. The dashed line (black) represents introduction of the delta variant in California. The difference between predicted COVID-19 cases without vaccination (blue) and observed COVID-19 cases with vaccine (green) represents the averted COVID-19 cases due to vaccination.
Results
The study results showed that 4,588,146 COVID-19 cases were reported between 1 January 2020 and 16 October 2021, in California, of which 4,585,248 cases were eligible for the study. Out of these, 71% occurred during the first phase of vaccination after 28 November 2020. After the SARS-CoV-2 Delta variant of concern (VOC) gained prominence in June 2021, a total of 899,510 COVID-19 cases were observed.
Between 29 November 2020 and 16 October 2021, 79.5% of the total population aged 12 years and above in California had received at least one dose of the COVID-19 vaccine. Out of the vaccinated individuals, 57% were administered the Pfizer/BioNTech vaccine, 36% the Moderna vaccine, and 7% the Janssen vaccine.
According to the primary model, 95% of the COVID-19 cases were observed to be prevented due to vaccination. A decrease of 34% was found in the cases occurring after vaccines were made available to the vaccine-eligible population, while a 46% reduction in infections was estimated when age-specific vaccine eligibility was taken into account. In the beginning phase of vaccine availability, the age groups of 12 to 17 years, 18 to 49 years, 50 to 64 years, and 65 years and older had a reduction of 15%, 36%, 34%, and 30% in infection-incidence, respectively. During the dominance of the Delta VOC, a total of 66% of COVID1-9 cases were prevented due to vaccination.
Based on the second statistical approach, 95% of the COVID-19 cases were averted due to vaccination between 29 November 2020 and 16 October 2021.
In the populations aged 12 years and above, a 32% reduction in infections was observed since the start of vaccine availability, while a 50% reduction was found, taking into account the age-specific differences across the cohorts.
The age groups of 12 to 17 years, 18 to 49 years, 50 to 64 years, and 65 years and older indicated a reduction of 25%, 31%, 35%, and 37% in COVID-19 incidence, while 90% of Delta VOC infections were reported to be averted.
Conclusion
Overall, the study findings showed that over 1.5 million COVID-19 cases were prevented as a result of vaccine-induced protection against SARS-CoV-2, along with a total reduction of 30% of cases. Thus the researchers concluded that the COVID-19 vaccines have a significant impact on reducing the number of cases and the duration of the pandemic.
This news article was a review of a preliminary scientific report that had not undergone peer-review at the time of publication. Since its initial publication, the scientific report has now been peer reviewed and accepted for publication in a Scientific Journal. Links to the preliminary and peer-reviewed reports are available in the Sources section at the bottom of this article. View Sources
Journal references:
- Preliminary scientific report.
Estimation of COVID-19 cases prevented by vaccination in California, Sophia Tan, Hailey Park, Isabel Rodríguez-Barraquer, George W. Rutherford, Kirsten Bibbins-Domingo, Robert Schechter, Nathan C. Lo, medRxiv 2022.02.08.22269319, doi: https://doi.org/10.1101/2022.02.08.22269319, https://www.medrxiv.org/content/10.1101/2022.02.08.22269319v2
- Peer reviewed and published scientific report.
Tan, Sophia T., Hailey J. Park, Isabel Rodríguez-Barraquer, George W. Rutherford, Kirsten Bibbins-Domingo, Robert Schechter, and Nathan C. Lo. 2022. “COVID-19 Vaccination and Estimated Public Health Impact in California.” JAMA Network Open 5 (4): e228526–26. https://doi.org/10.1001/jamanetworkopen.2022.8526. https://jamanetwork.com/journals/jamanetworkopen/fullarticle/2791453.
 New HIV vaccine shows unprecedented success in primate studies