A new study updates the state of knowledge about antigen rapid diagnostic tests (Ag-RDT) in the diagnosis of coronavirus disease 2019 (COVID-19), caused by the severe acute respiratory syndrome coronavirus 2 (SARS-CoV-2).
The researchers looked at almost 200 studies, examining not only the accuracy of the test results but also the factors that influenced the sensitivity of the tests. Ag-RDT has been widely adopted in the universal fight against this virus, being both rapid, easy to use, and based on the presence of the specific viral antigen. However, they also show vast differences in performance from manufacturer, technique, and patient characteristics.
Earlier, the same researchers showed these tests to be 72% sensitive in virus detection, almost 100% specific, and identified the LumiraDx SARS-CoV-2 antigen test as the most sensitive. The current study, posted to the medRxiv* preprint server, aims to include the new studies that have been carried out since then, including symptomatic patients.
These studies include people within a few days of symptom onset when the viral load is highest. Conversely, asymptomatic patients typically have a lower viral load because they are tested later on in the course of the infection. The effect of the viral load on Ag-RDT sensitivity is therefore important.
The current study evaluated 76 different Ag-RDTs, over 194 studies including almost 222,000 tests. Most tested samples were nasopharyngeal (NP) or mixed naso- and oro-pharyngeal (NP/OP) swabs.
Only about a fifth of the study populations were chosen correctly, but the risk of bias was considered low. Only about half the data sets described correctly performed tests as recommended by the manufacturer.
Considering all tests and sample types, the pooled sensitivity and specificity estimates were 72% and 99%, respectively. With compliance to test instructions, the sensitivity was 76% vs. <67% otherwise, though the specificity did not change significantly.
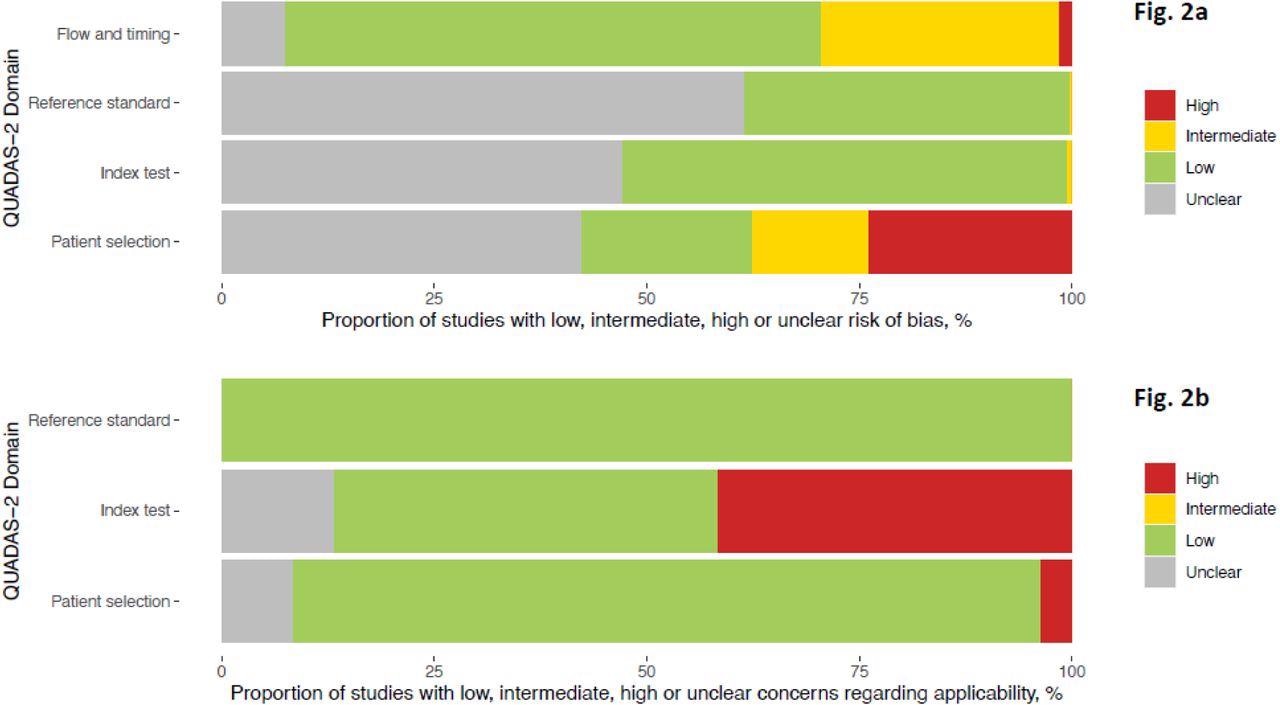
(a)Methodological quality of the clinical accuracy studies (risk of bias) (b) Methodological quality of the clinical accuracy studies (applicability)
By Ct Value
Samples in which the cycle threshold (Ct) value was below 20, indicating a high viral load, sensitivity was almost 98%, while for a Ct <25 it was 91%. It fell steeply to 54% with a Ct of 25 or more. In fact, up to a Ct of 30, the pooled sensitivity was 77%, but only 19% above this value.
For true-positives, the Ct value was 22, on average, vs 30 for false-negatives, even with a mean Ct value of 26 in either set. This shows that the false negatives missed by Ag-RDT have a much lower viral load compared to those detected by the tests.
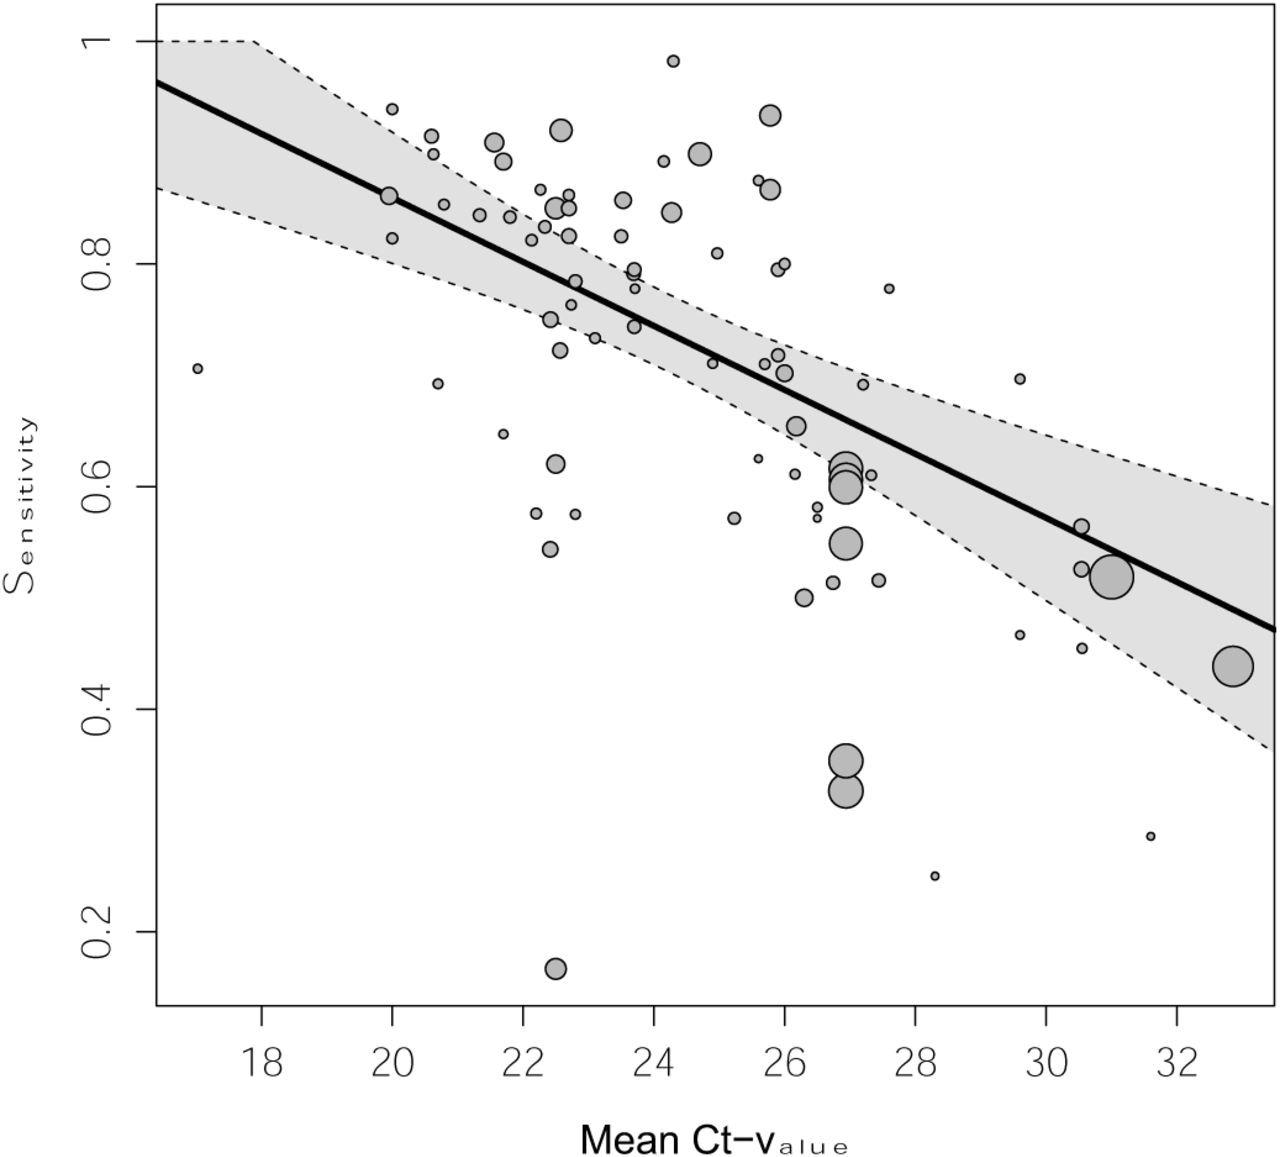
Pooled estimate of sensitivity across mean Ct-values holding symptom status and IFU-status constant at their respective means Dotted lines are the corresponding 95% confidence intervals. The size of each point is a function of the weight of the data set in the model, where larger data sets have larger points. Abbreviations: Ct = cycle threshold
With either NP/OP swabs or a combination, the pooled sensitivity was 71%, with 99% specificity. Saliva swabs had the lowest detection rate at 50% sensitivity. AN/MT swabs showed comparable performance to NP swabs, at 77% sensitivity and the same specificity. However, symptomatic persons had much higher detection rates, at 76%, vs 57% for asymptomatic individuals, though both had a specificity above 98%.
Again, when the individuals were tested within 7 days of symptom onset, the sensitivity was 82% compared to 52% when tested after that. However, both children and adults showed similar sensitivity values.
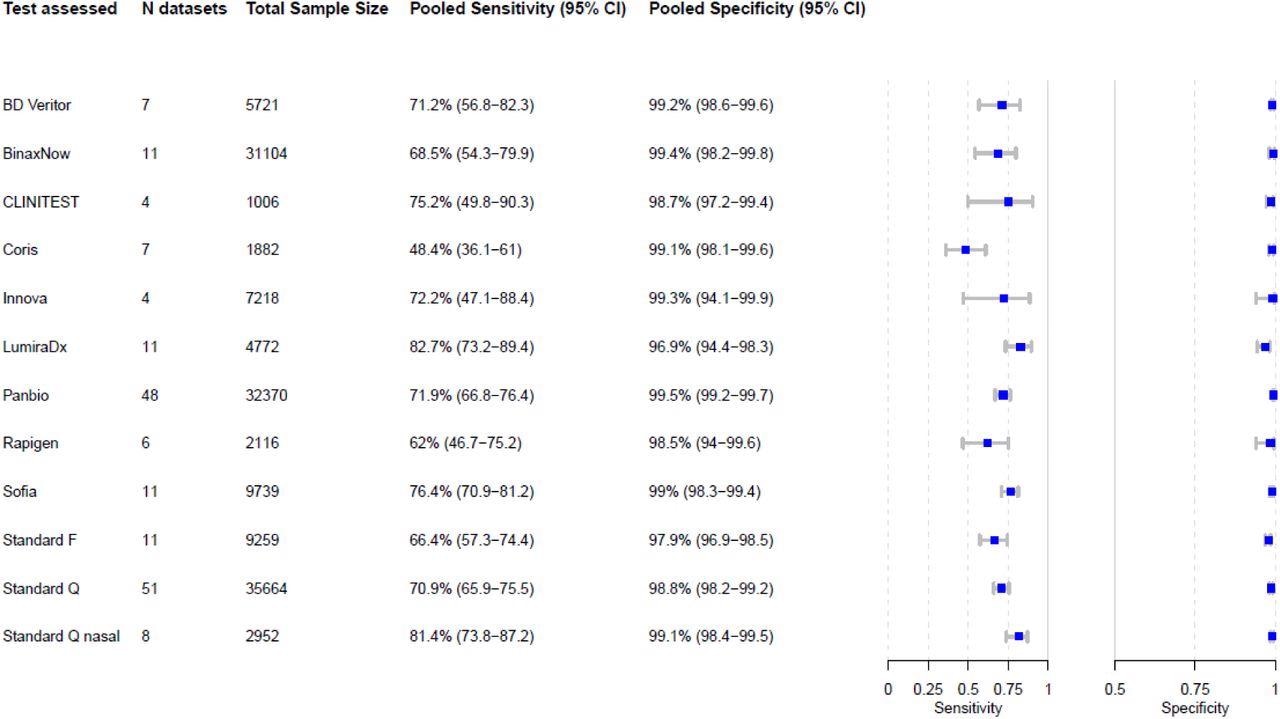
Pooled sensitivity and specificity were calculated based on reported sample size, true positives, true negatives, false positives, and false negatives. Abbreviations: N = number of, CI = confidence interval
Factors Affecting Sensitivity
The results showed that the viral load, as indicated by the Ct value, had the greatest effect on the test sensitivity, at an increase of 3 percentage points per unit decrease in mean Ct value, even when compensating for symptoms and test procedure.
Secondly, detection of the virus in samples from symptomatic individuals was more sensitive, at 20 percentage points higher, vs. asymptomatic subjects, but this was only 11 percentage points higher once the test procedure and the average Ct value was adjusted for. Finally, with each additional day after one week from the onset of symptoms, sensitivity declined by 22 percentage points. This was, however, mainly due to the rise in Ct values and testing procedure differences.
No specific test stood out for its performance, with pooled specificity being >98% for all tests except two, with 98% and 97% specificities, respectively. Similarly, sensitivity estimates had overlapping confidence intervals, except for one, with the highest sensitivity being 83%.
What Are the Implications?
“Ag-RDTs detect most of the individuals infected with SARS-CoV-2, and almost all when high viral loads are present (>90%). With viral load, as estimated by Ct-value, being the most influential factor on their sensitivity, they are especially useful to detect persons with high viral load who are most likely to transmit the virus.” This is independent of patient symptoms and symptom duration.
With 76% sensitivity and 99% specificity, Ag-RDTs appear helpful compared to the PCR test, provided both are used as per the manufacturer’s instructions. As shown by the Ct value, the viral load was the driver of sensitivity, with an increase of 3 percentage points per unit fall in Ct value after adjusting for symptom status and testing procedure.
True positives had a mean Ct value about 8 points lower than false negatives, while symptomatic patients also had higher sensitivity than asymptomatic participants. However, once Ct value is adjusted for, there is a fall of about 11 percentage points in the sensitivity for symptomatic vs asymptomatic subjects. A further detailed study might uncover the reasons for this difference since earlier studies have shown no difference in viral load between symptomatic and asymptomatic individuals.
Earlier testing after symptom onset also showed higher sensitivity, at 82% within 7 days of onset, compared to 52% when testing occurred after that time. This means a drop in sensitivity by 3 percentage points per day increase in symptom duration, driven by viral load. Other drivers included compliance with manufacturers’ instructions and sample type.
Interestingly, while LumiraDx showed the highest sensitivity above the 80% cut-off determined by the World Health Organization, its specificity fell just short of the 97% target.
“The main results of our latest extractions are publicly available on our website. This has not only equipped public health professionals with an up-to-date overview on the current but also led other researchers and the test manufacturers to check our data, improving the quality of our report through continuous peer-review.”
Standardized studies on test accuracy, with improved data on patient Ct values and symptom duration, will help further evaluate this parameter.
 This news article was a review of a preliminary scientific report that had not undergone peer-review at the time of publication. Since its initial publication, the scientific report has now been peer reviewed and accepted for publication in a Scientific Journal. Links to the preliminary and peer-reviewed reports are available in the Sources section at the bottom of this article. View Sources
 A century of safety: Aluminium vaccine adjuvants do not raise serious long-term health risks