The Thermo Scientific™ NanoDrop™ Ultra Microvolume UV-Vis Spectrophotometer and Fluorometer is a core analytical tool for life sciences laboratories working with nucleic acids.
Once DNA or RNA has been isolated from sources such as tissue, saliva, plants, or other biological material, the NanoDrop Ultra spectrophotometer provides an important means of assessing nucleic acid purity and concentration before subsequent experiments.
Its microvolume pedestal incorporates auto-ranging pathlength technology, allowing measurements across a wide concentration range and avoiding the need for dilutions that can introduce error and consume time.
Table 1 summarizes the concentration ranges and typical reproducibility associated with dsDNA, ssDNA, and RNA measurements performed on the microvolume pedestal.
Table 1. Pedestal concentration detection ranges for the dsDNA, ssDNA, and RNA applications. Typical reproducibility is defined for the specific range provided for each application. Source: Thermo Fisher Scientific - UV-Vis Spectroscopy
| Application |
Lower detection limit (ng/μL) |
Upper detection limit (ng/μL) |
Typical reproducibility* |
| dsDNA |
1.0 |
27,500 |
±1.0 ng/μL for sample concentrations 1–100 ng/μL
±2% for samples >100 ng/μL |
| ssDNA |
0.66 |
18,150 |
±0.66 ng/μL for sample concentrations 0.66–100 ng/μL
±2% for samples >100 ng/μL |
| RNA |
0.8 |
22,000 |
±0.8 ng/μL for sample concentrations 0.8–100 ng/μL
±2% for samples >100 ng/μL |
*Unit ng/μL indicates standard deviation; percentage indicates coefficient of variation (%CV).
Method
A dilution series of calf thymus DNA solution (Invitrogen, 15633019) was prepared in a Tris-EDTA buffer (TE pH 7.5). Eight samples were generated, with concentrations spanning 5 ng/μL to 10,000 ng/μL.
A ninth sample containing green food coloring, which resembles the spectral profile of dsDNA, was prepared as a high-absorbance surrogate to mimic a dsDNA concentration of approximately 25,000 ng/μL.
The dsDNA application was performed on both a NanoDrop Ultra instrument and a Thermo Scientific™ NanoDrop™ OneC Spectrophotometer, the latter serving as a reference. Using 2 μL aliquots on the pedestals of both instruments, each sample was measured 10 times.
To assess reproducibility at lower concentrations, five samples ranging from 1 ng/μL to 50 ng/μL were additionally analyzed on the NanoDrop Ultra instrument. Each was measured five times using a 2 μL sample volume.
The Thermo Scientific™ Evolution™ One Plus Spectrophotometer, a cuvette-based reference instrument, was also used. For this instrument, 2 mL of each sample was measured in a 1 cm quartz cuvette, with three replicate readings collected.
Concentrations for both dilution series were derived from absorbance readings at 260 nm, applying the dsDNA factor of 50 ng-cm/μL within Beer’s Law. Mean concentrations, standard deviations, and coefficients of variation (%CV) were calculated. Results from the NanoDrop Ultra instrument were then compared with those obtained using the NanoDrop One and Evolution One Plus spectrophotometers.
Table 2. Average concentrations of nine serial dilutions of dsDNA measured on a NanoDrop One spectrophotometer and a NanoDrop Ultra spectrophotometer. Each sample was averaged from replicates of 10, and the standard deviation (ng/μL) and %CV are both reported. Source: Thermo Fisher Scientific - UV-Vis Spectroscopy
| |
NanoDrop One
Spectrophotometer |
NanoDrop Ultra
Spectrophotometer |
Sample
Name |
Concentration
(ng/μL) |
Standard deviation
(ng/μL) |
%CV |
Concentration
(ng/μL) |
Standard deviation
(ng/μL) |
%CV |
| Sample 1 |
4.4 |
0.5 |
11.62 |
4.2 |
0.4 |
8.60 |
| Sample 2 |
9.9 |
0.3 |
3.05 |
9.6 |
0.3 |
2.73 |
| Sample 3 |
50.7 |
0.7 |
1.46 |
51.7 |
0.8 |
1.48 |
| Sample 4 |
102.5 |
0.3 |
0.25 |
103.0 |
0.9 |
0.91 |
| Sample 5 |
500 |
1 |
0.28 |
503 |
1 |
0.20 |
| Sample 6 |
1008 |
4 |
0.39 |
991 |
5 |
0.51 |
| Sample 7 |
4830 |
40 |
0.80 |
4760 |
20 |
0.36 |
| Sample 8 |
10030 |
20 |
0.20 |
9780 |
40 |
0.36 |
| Sample 9 |
25370 |
60 |
0.24 |
24500 |
200 |
0.75 |
Table 3. Concentration results for each replicate measurement displayed in ng/μL for the nine samples measured on the NanoDrop Ultra spectrophotometer. At the bottom of the table, the average concentration, standard deviation, and %CV are listed for each sample. Source: Thermo Fisher Scientific - UV-Vis Spectroscopy
| Sample |
1 |
2 |
3 |
4 |
5 |
6 |
7 |
8 |
9 |
| Replicate 1 |
4.23 |
9.44 |
50.5 |
103.26 |
503.35 |
992.96 |
4736.13 |
9759.56 |
24587.9 |
| Replicate 2 |
4.08 |
9.65 |
52.12 |
100.92 |
502.98 |
994.69 |
4749.87 |
9783.59 |
24567.79 |
| Replicate 3 |
4.37 |
10.02 |
51.27 |
102.46 |
503.1 |
988.46 |
4746.05 |
9822.47 |
24678.29 |
| Replicate 4 |
4.2 |
9.5 |
51.62 |
102.8 |
500.33 |
991.65 |
4729.65 |
9811.16 |
24654.37 |
| Replicate 5 |
3.81 |
9.35 |
52.23 |
102.99 |
502.65 |
979.28 |
4785.64 |
9794.18 |
24392.66 |
| Replicate 6 |
3.82 |
9.11 |
51.83 |
104.21 |
503.81 |
989.11 |
4769.5 |
9806.24 |
24721.79 |
| Replicate 7 |
3.81 |
9.79 |
51.46 |
102.92 |
502.9 |
998.07 |
4767.01 |
9786.22 |
24659.08 |
| Replicate 8 |
4.94 |
9.49 |
52.38 |
102.98 |
501.47 |
988.15 |
4766.19 |
9698.29 |
24277.88 |
| Replicate 9 |
3.88 |
9.82 |
52.81 |
103 |
502.75 |
989.7 |
4756.15 |
9787.07 |
24170.11 |
| Replicate 10 |
4.37 |
9.48 |
50.52 |
101.38 |
502.19 |
993.84 |
4744.43 |
9763.92 |
24520.56 |
Average
(ng/μL) |
4.2 |
9.6 |
51.7 |
102.7 |
503 |
991 |
4760 |
9780 |
24500 |
Standard
Deviation
(ng/μL) |
0.4 |
0.3 |
0.8 |
0.9 |
1 |
5 |
20 |
40 |
200 |
| %CV |
8.60 |
2.73 |
1.48 |
0.91 |
0.20 |
0.51 |
0.36 |
0.36 |
0.75 |
Results
Table 2 presents the mean concentrations, standard deviations, and %CV values for the nine prepared samples. Table 3 provides the concentration recorded for every replicate measurement obtained with the NanoDrop Ultra spectrophotometer.
For samples below 100 ng/μL, the standard deviation specification is ±1 ng/μL; all samples met this criterion, with the greatest deviation observed at 0.76 ng/μL. For samples above 100 ng/μL, the specification is a %CV of 2%, and the highest value recorded on the NanoDrop Ultra spectrophotometer was 0.91%.
Figure 1 shows a linearity curve comparing concentrations calculated using the NanoDrop One spectrophotometer with those calculated using the NanoDrop Ultra spectrophotometer. The regression line produced an R2 of 1.000, indicating very strong agreement between the concentration values reported by the two instruments.
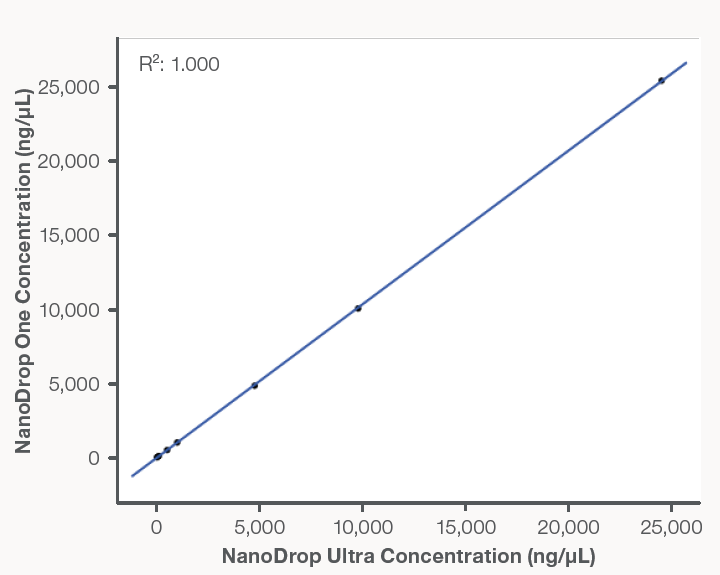
Figure 1. Linearity comparison between the NanoDrop One and NanoDrop Ultra spectrophotometers. The regression line (R2 = 1.000) indicates strong correlation between sample measurements. Image Credit: Thermo Fisher Scientific - UV-Vis Spectroscopy
Table 4. Reproducibility of the lower detection range on the NanoDrop Ultra spectrophotometer. The average concentrations and standard deviations are based on replicates of five for the NanoDrop Ultra instrument and triplicates on the Evolution One Plus instrument. Source: Thermo Fisher Scientific - UV-Vis Spectroscopy
| |
Evolution One Plus
Spectrophotometer |
NanoDrop Ultra
Spectrophotometer |
Sample
Name |
Average concentration
(ng/μL) |
Standard deviation
(ng/μL) |
Average concentration
(ng/μL) |
Standard deviation
(ng/μL) |
| Sample 1 |
0.99 |
0.01 |
1.3 |
0.2 |
| Sample 2 |
5.09 |
0.02 |
5.3 |
0.4 |
| Sample 3 |
9.43 |
0.01 |
9.0 |
0.5 |
| Sample 4 |
24.22 |
0.00 |
24.4 |
0.3 |
| Sample 5 |
48.46 |
0.02 |
48.9 |
0.6 |
The low concentration range of 1 ng/μL to 50 ng/μL measured on the NanoDrop Ultra spectrophotometer was compared with concentrations determined using the cuvette-based Evolution One Plus spectrophotometer.
Table 4 reports the mean concentrations and standard deviations for the five samples examined. Standard deviations remained at 0.6 ng/μL, confirming highly reproducible sample measurements.
Furthermore, the regression line shown in Figure 2 demonstrates strong linearity across the lower portion of the NanoDrop Ultra instrument’s detection range, with an R2 of 1.000.
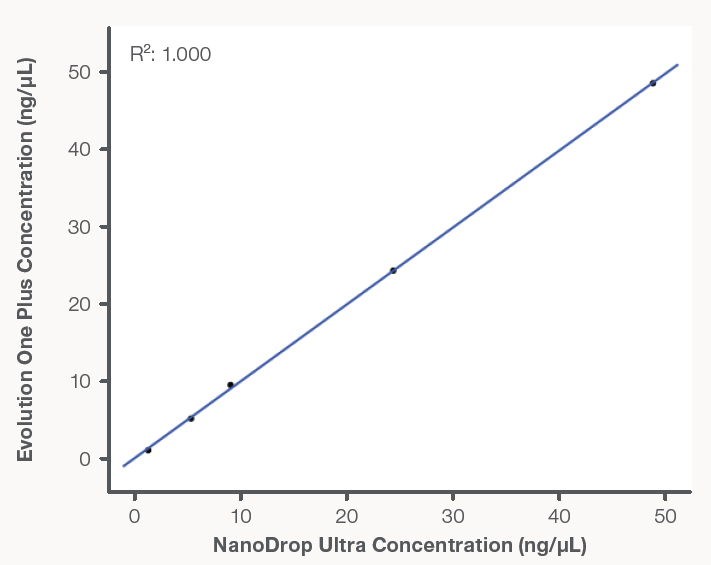
Figure 2. Linearity comparison between the Evolution One Plus and NanoDrop Ultra spectrophotometers in the low-concentration range. The strong correlation in concentration values reported by each instrument is confirmed by the regression line (R2 = 1.000). Image Credit: Thermo Fisher Scientific - UV-Vis Spectroscopy
Conclusions
Across the complete dsDNA dynamic range of 1 ng/μL to 27,500 ng/μL, the NanoDrop Ultra spectrophotometer reported sample concentrations with high accuracy and reproducibility.
When the lower detection range of 1 ng/μL to 50 ng/μL was examined in greater detail, the instrument also demonstrated excellent linearity and reproducibility relative to a reference spectrophotometer.
For both concentration ranges evaluated, reproducibility remained comfortably within the instrument’s specified limits. Mean concentrations obtained with the NanoDrop Ultra spectrophotometer corresponded closely to those from the reference instruments, as shown by an R2 of 1.000 for both ranges.
By combining a microvolume pedestal surface with auto-ranging pathlength technology, nucleic acid samples can be quantified and qualified using only 1–2 μL of material, without requiring dilutions that may introduce error. The instrument’s preconfigured software further makes UV-Vis spectrophotometry a rapid and straightforward approach for life science laboratories.
About Thermo Fisher Scientific - UV-Vis Spectroscopy

UV-Vis Spectrometers overview
Scientists can count on our broad range of ultraviolet (UV) and visible (Vis) spectrophotometers to deliver reliable, accurate data. The Thermo Scientific SPECTRONIC 200, GENESYS, and Evolution product lines are designed to streamline measurements providing consistent, high-quality results, time after time. Additionally, the innovative Thermo Scientific NanoDrop microvolume family of instruments, have been helping scientists accelerate the pace of discovery for over 20 years. From classroom teaching–to routine measurements–to discovery of the next scientific breakthrough, our line of spectrophotometers is designed to fit into any modern laboratory.
Sponsored Content Policy: News-Medical.net publishes articles and related content that may be derived from sources where we have existing commercial relationships, provided such content adds value to the core editorial ethos of News-Medical.net, which is to educate and inform site visitors interested in medical research, science, medical devices and treatments.