Historically, very long chain fatty acids have been quantified via direct transesterification and gas chromatography methods. These methods require time-consuming and labor-intensive sample preparation and analysis.
LC-MS/MS methods have since been reported, enabling more streamlined measurement of long-chain LPCs in DBS (Figure 1). Interferences have also been reported with positive ESI, allowing researchers to develop methodologies that employ negative ESI to circumvent isobaric interferences in cases where chromatographic resolution is lacking.
This article describes a UHPLC-MS/MS method using acetate adducts for the reliable analysis of four long-chain LPCs in DBS in a clinical research setting: C20:0, C22:0, C24:0, and C26:0-LPCs.
The mobile phase composition comprised a mixture of water, acetonitrile, and isopropanol, along with 5 mM ammonium acetate as a modifier.
The DBS sample extraction used a working solution prepared in methanol containing the deuterated LPC internal standards. The method was developed using an ACQUITY UPLC I-Class PLUS System (Fixed Loop) and an ACQUITY Premier CSH C18 Column.
This setup provided baseline resolution of endogenous isobaric interferences for the targeted LPCs’ saturated forms. A Xevo TQ-S micro Mass Spectrometer in negative ESI mode was used as a detector.
Using this methodology, a total analysis time of 7 minutes (injection-to-injection) was achieved.
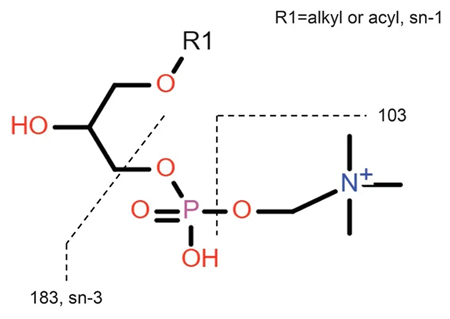
Figure 1. Chemical structure of the backbone of lysophosphatidylcholines. Image Credit: Waters Advanced Diagnostics
Experimental
Calibrators and Quality Control (QC) samples
DBS materials were provided by the Centers for Disease Control and Prevention (CDC), with two independent DBS samples used for this work: Lots 2110 and 2215.
A total of four samples from Lot 2110 were employed as calibrators:
- A (unenriched)
- B (spiked at 0.25 µmol/L)
- C (spiked at 0.5 µmol/L)
- D (spiked at 2 µmol/L)
Samples from Lot 2215 were used as QC samples:
- Low, B (spiked at 0.25 µmol/L)
- Mid, C (spiked at 0.5 µmol/L)
- High, D (spiked at 2 µmol/L)
An additional set of DBS samples (Lot 2021) was provided, covering a range of enrichment concentrations for linearity testing:
- 0.1 µmol/L
- 0.25 µmol/L
- 0.5 µmol/L
- 1.25 µmol/L
- 2.5 µmol/L
- 5 µmol/L
- 7.5 µmol/L
- 10 µmol/L
Internal standards preparation
Three of the four stable, isotopically labeled internal standards were purchased from Cambridge Isotope Laboratories. C26:0-LPC-d4 was supplied by Avanti Polar Lipids.
Stock solutions were prepared in methanol at 341.8 µmol/L, 325.4 µmol/L, 310.5 µmol/L, and 309.4 µmol/L for C20:0-LPC-d4, C22:0-LPC-d4, C24:0-LPC-d4, and C26:0-LPC-d4, respectively.
The stock solutions were then dispensed into glass vials, capped, and stored at -20 °C. An extraction working solution (EWS) at 0.04 µmol/L was prepared for each internal standard by diluting an aliquot of the respective internal standard stock to a final volume of 200 mL in methanol.
The EWS was used as a system-suitability test to verify system performance daily.
Sample extraction
1. DBS material was initially removed from -20 °C storage before being brought to room temperature.
2. A 3.2 mm punch was inserted into a 96-well round-bottom plate.
3. A total of 100 µL of EWS was added to each well, and the plate was sealed with an adhesive foil cover before being mixed on a shaker at 500 rpm for 30 minutes.
4. The plate was then removed from the shaker and the liquid extracts were transferred into a clean 96-well plate, sealed with a silicone mat, and placed into the sample manager before analysis.
LC conditions
Source: Waters Advanced Diagnostics
| |
|
| LC system: |
ACQUITY UPLC I-Class PLUS FL System |
| Detection: |
Xevo TQ-S micro Mass Spectrometer |
| Plate: |
Waters 96-well Sample Collection Plate, 350 µL |
| Column(s): |
ACQUITY Premier CSH C18 Column, 2.1 mm x 50 mm, 1.7 µm (p/n: 186009460) |
| Column temperature: |
55 °C |
| Sample temperature: |
8 °C |
| Injection volume: |
7.5 µL |
| Injection mode: |
Partial Loop with needle-overfill |
| Needle size: |
20 µL |
| Sample syringe: |
100 µL |
| Sample loop: |
20 µL |
| Flow rate: |
Refer to the Gradient Table |
| Mobile phase A: |
5 mM ammonium acetate, 60:40 (v/v) acetonitrile: water |
| Mobile phase B: |
5 mM ammonium acetate, 90:10 (v/v) isopropanol: acetonitrile |
| Weak wash: |
Methanol |
| Strong wash: |
0.1 % formic acid in 25/25/25/25 (v/v/v/v) acetonitrile/methanol/IPA/water |
| Run time: |
6.32 minutes |
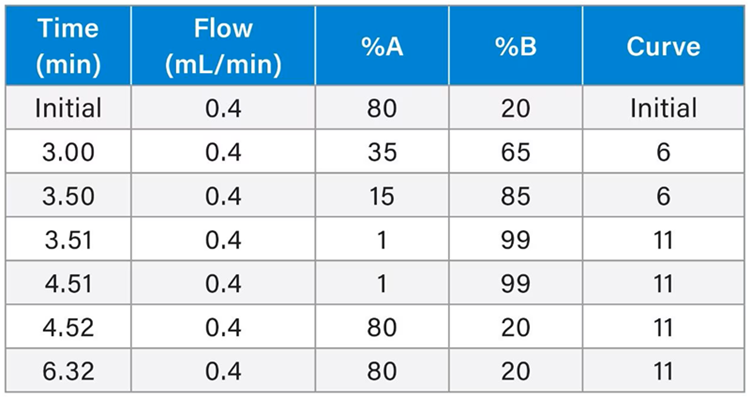
Gradient table
Source: Waters Advanced Diagnostics
MS conditions
Source: Waters Advanced Diagnostics
| |
|
| MS system: |
Xevo TQ-S micro Mass Spectrometer |
| Ionization mode: |
ESI negative |
| Capillary voltage: |
2.5 kV |
| Desolvation temperature: |
450 °C |
| Source temperature: |
150 °C |
| Desolvation gas: |
1000 L/Hr |
| Cone gas: |
50 L/Hr |
| MS1 resolution: |
Unit (0.7 Da) |
| MS2 resolution: |
Unit (0.7 Da) |
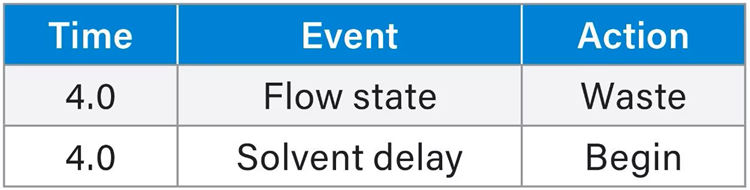
Method events
Source: Waters Advanced Diagnostics
Data management
Source: Waters Advanced Diagnostics
| |
|
| MS software: |
MassLynx™ v4.2 Software SCN 1045 |
| Informatics: |
TargetLynx™ XS v4.2 Software SCN1045 and QUAN Review |
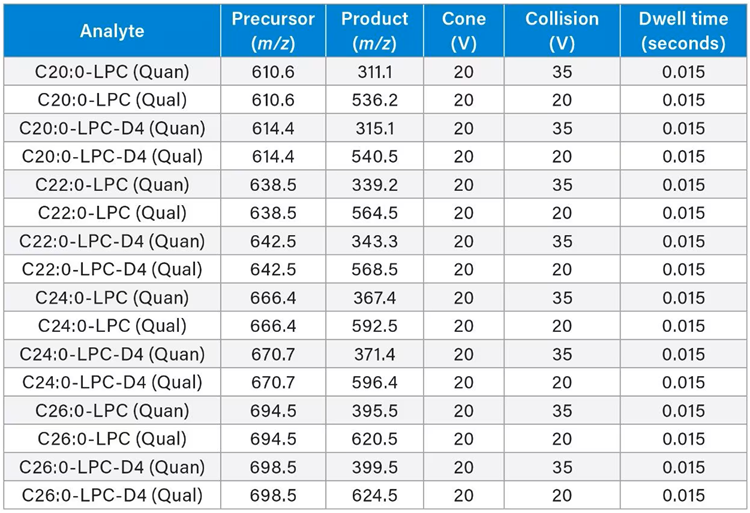
MRM parameters
Source: Waters Advanced Diagnostics
Results and discussion
Different mobile-phase compositions, column chemistries, and ESI polarity modes were tested to minimize interference and optimize chromatographic peak shape and analytical sensitivity.
Ammonium formate favored the formation of m/z 184 and m/z 104 as daughter ions for all the LPCs in positive mode. The m/z 184 ion lacks specificity because most phospholipids share this moiety. As a result, the ion m/z 104 was chosen as the quantifier.
Evaluating conditions in positive mode for the analysis of the four saturated LPCs revealed that some existing interferences were affecting the parent masses of the analytes and their corresponding internal standard parent ion masses. This prompted an assessment of negative ionization using ammonium acetate as a modifier for LPC detection.
Acetate adducts [M+CH3COO]- were seen to be the most abundant parent ion masses, generated for each LPC under these conditions. The acyl-chain product ions generated in negative ionization were found to reduce interference from other phosphocholine headgroups, as detected under the latter conditions employed in method validation.
Comparing chromatographic resolution and retention time against a matched internal standard enabled unambiguous identification (Figure 2). It was noted that the elution order depended on carbon chain length, with C20:0-LPC eluting first and C26:0-LPC last.
It was also observed that the detection of the two-acyl isomer could be postulated for the adjacent peak in each LPC form, because these isomers are able to form readily in a pH-dependent manner. There may also be a contribution to isomer presence attributed to the purity of the synthetic internal standards, reported to be 95 % for each LPC.
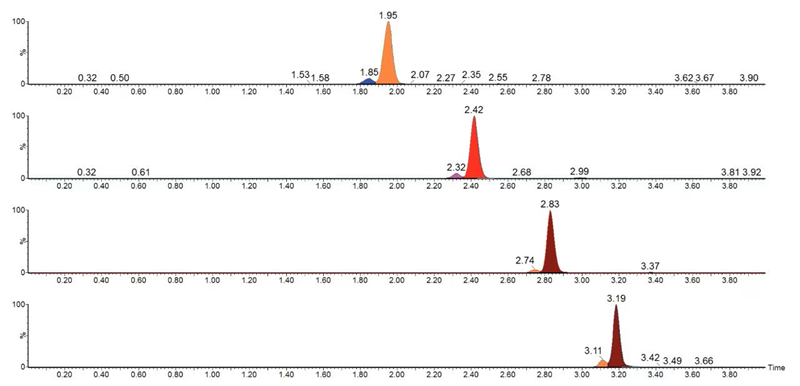
Figure 2. Representative chromatograms for C20:0-LPC eluting at 1.95 min, C22:0-LPC at 2.42 min, C24:0-LPC at 2.83 min, and C26:0-LPC at 3.19 min. Image Credit: Waters Advanced Diagnostics
LPCs are endogenously produced in blood, so their levels can differ across donor pools. This led to the measurement of enrichment concentrations lower than 0.1 µmol/L, demonstrating higher imprecision values (greater than 20 %).
LLMI values were determined by analyzing the lowest concentration of enriched DBS samples (n=2) over five days. LLMI values, including endogenous levels, were found to be:
- 0.24 µmol/L for C20:0-LPC
- 0.16 µmol/L for C22:0-LPC
- 0.2 µmol/L for C24:0-LPC
- 0.27 µmol/L for C26:0-LPC
It was observed that the clinical research method was linear over 0.1-10 µmol/L, with an r2 value ≥ 0.99 across all five analytical runs. There was no observable significant carryover into blank samples after the analysis of alternate QC high-level sample injections.
Matrix effects were qualitatively evaluated through the comparison of six independent unenriched DBS samples to a solvent blank via the post-column infusion of the target analytes at both low (0.25 µmol/L) and high (2 µmol/L) concentrations. No significant matrix effects were seen for any of the LPCs (Figure 3).
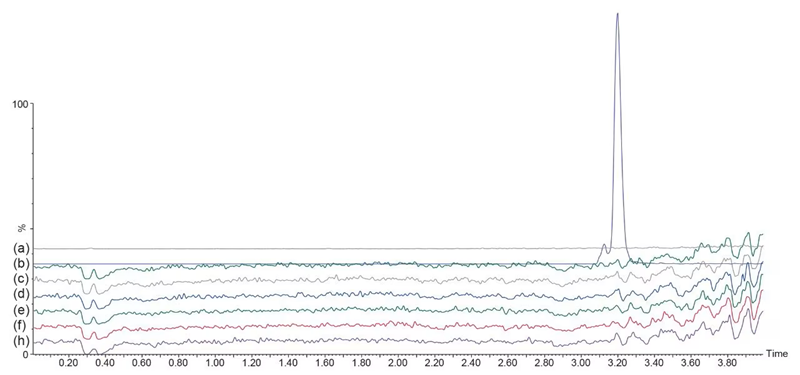
Figure 3. Example chromatogram for C26:0-LPC post-column infusion at 2 µmol/L. The top gray trace corresponds to the solvent blank card, and the analyte standard peak is indicated in the top blue trace. The subsequent (bottom) six traces are independent DBS samples without enrichment. Image Credit: Waters Advanced Diagnostics
A four-point calibration curve (including the unenriched DBS samples) was run daily alongside QC samples for all LPCs (Figure 4).
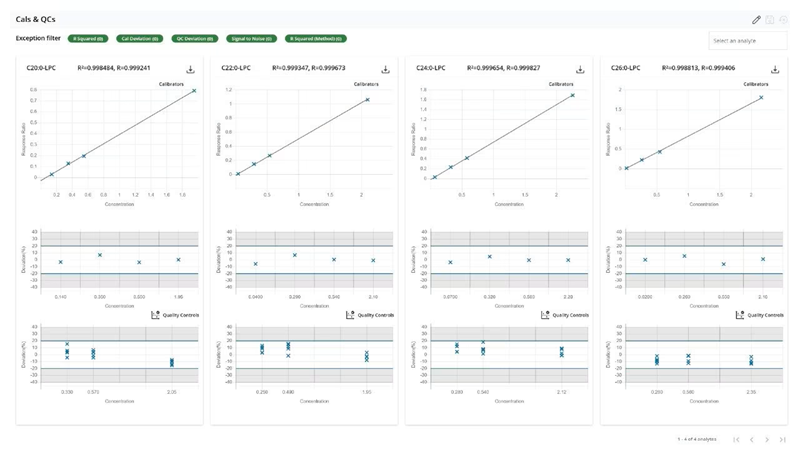
Figure 4. Calibration curve for C20:0-LPC, C22:0-LPC, C24:0-LPC, and C26:0-LPC in Quan Review. Image Credit: Waters Advanced Diagnostics
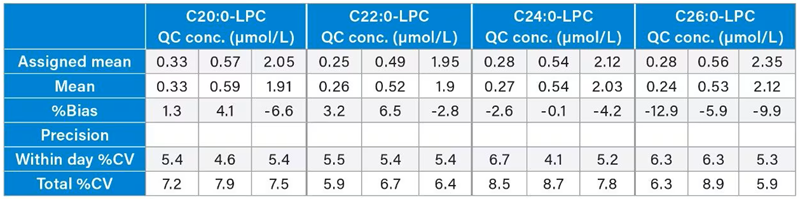
Within-day and total precision were determined across five days at 0.25 µmol/L, 0.5 µmol/L, and 2 µmol/L enrichment concentrations (n=5).
Table 1 shows that both parameters met the acceptance criteria of % CV ≤ 15 for all LPCs. Table 1 also shows the percentage bias for all three QC concentration levels relative to their assigned CDC values. The bias for all LPCs was found to be ≤ 20 % within the acceptance criteria.
Table 1. Within-day and total precision, and QC %Bias summaries. Source: Waters Advanced Diagnostics
It is important to note that the analytical data presented in this article are intended to demonstrate the robustness of a Waters research method and should not be considered a substitute for independent method validation in accordance with applicable legal or laboratory standards.
Conclusion
The LC-MS/MS clinical research method outlined here was used to measure LPCs of C20:0, C22:0, C24:0, and C26:0 using a combination of the ACQUITY UPLC I-Class PLUS FL System and the Xevo TQ-S micro Mass Spectrometer. The method was shown to:
- Be relatively rapid, able to analyze approximately 220 samples in a 24-hour period
- Ensure reliability in the identification of LPCs from interfering isobaric compounds
- Deliver good precision with a total repeatability and reproducibility of ≤ 10 % CV
- Demonstrate good linearity, with no significant matrix effects or carryover
- Deliver good analytical sensitivity and selectivity in negative mode
For research use only. Not for use in diagnostic procedures.
Acknowledgments
Produced from materials originally authored by Anahi Santoyo-Castelazo, Gareth Hammond, and Lisa J. Calton from Waters Corporation.
About Waters Advanced Diagnostics
At Waters, we recognize the critical role hospital laboratories play in delivering timely, accurate diagnostics that drive patient care. Our solutions are built to support your lab’s evolving needs - whether you’re expanding test menus, improving turnaround times, or meeting rigorous regulatory standards.
Rooted in three foundational pillars, our approach is designed specifically for clinical lab environments like yours:
Flexibility – Integrate seamlessly into your existing systems and workflows.
Efficiency – Help your team deliver high-quality results faster and with fewer hands-on steps.
Trust – Proven technologies backed by decades of scientific innovation and global support.
From LC-MS/MS systems to automated sample preparation and data management tools, Waters offers comprehensive solutions that enable your lab to operate with confidence - today and in the future.
Sponsored Content Policy: News-Medical.net publishes articles and related content that may be derived from sources where we have existing commercial relationships, provided such content adds value to the core editorial ethos of News-Medical.net, which is to educate and inform site visitors interested in medical research, science, medical devices, and treatments.