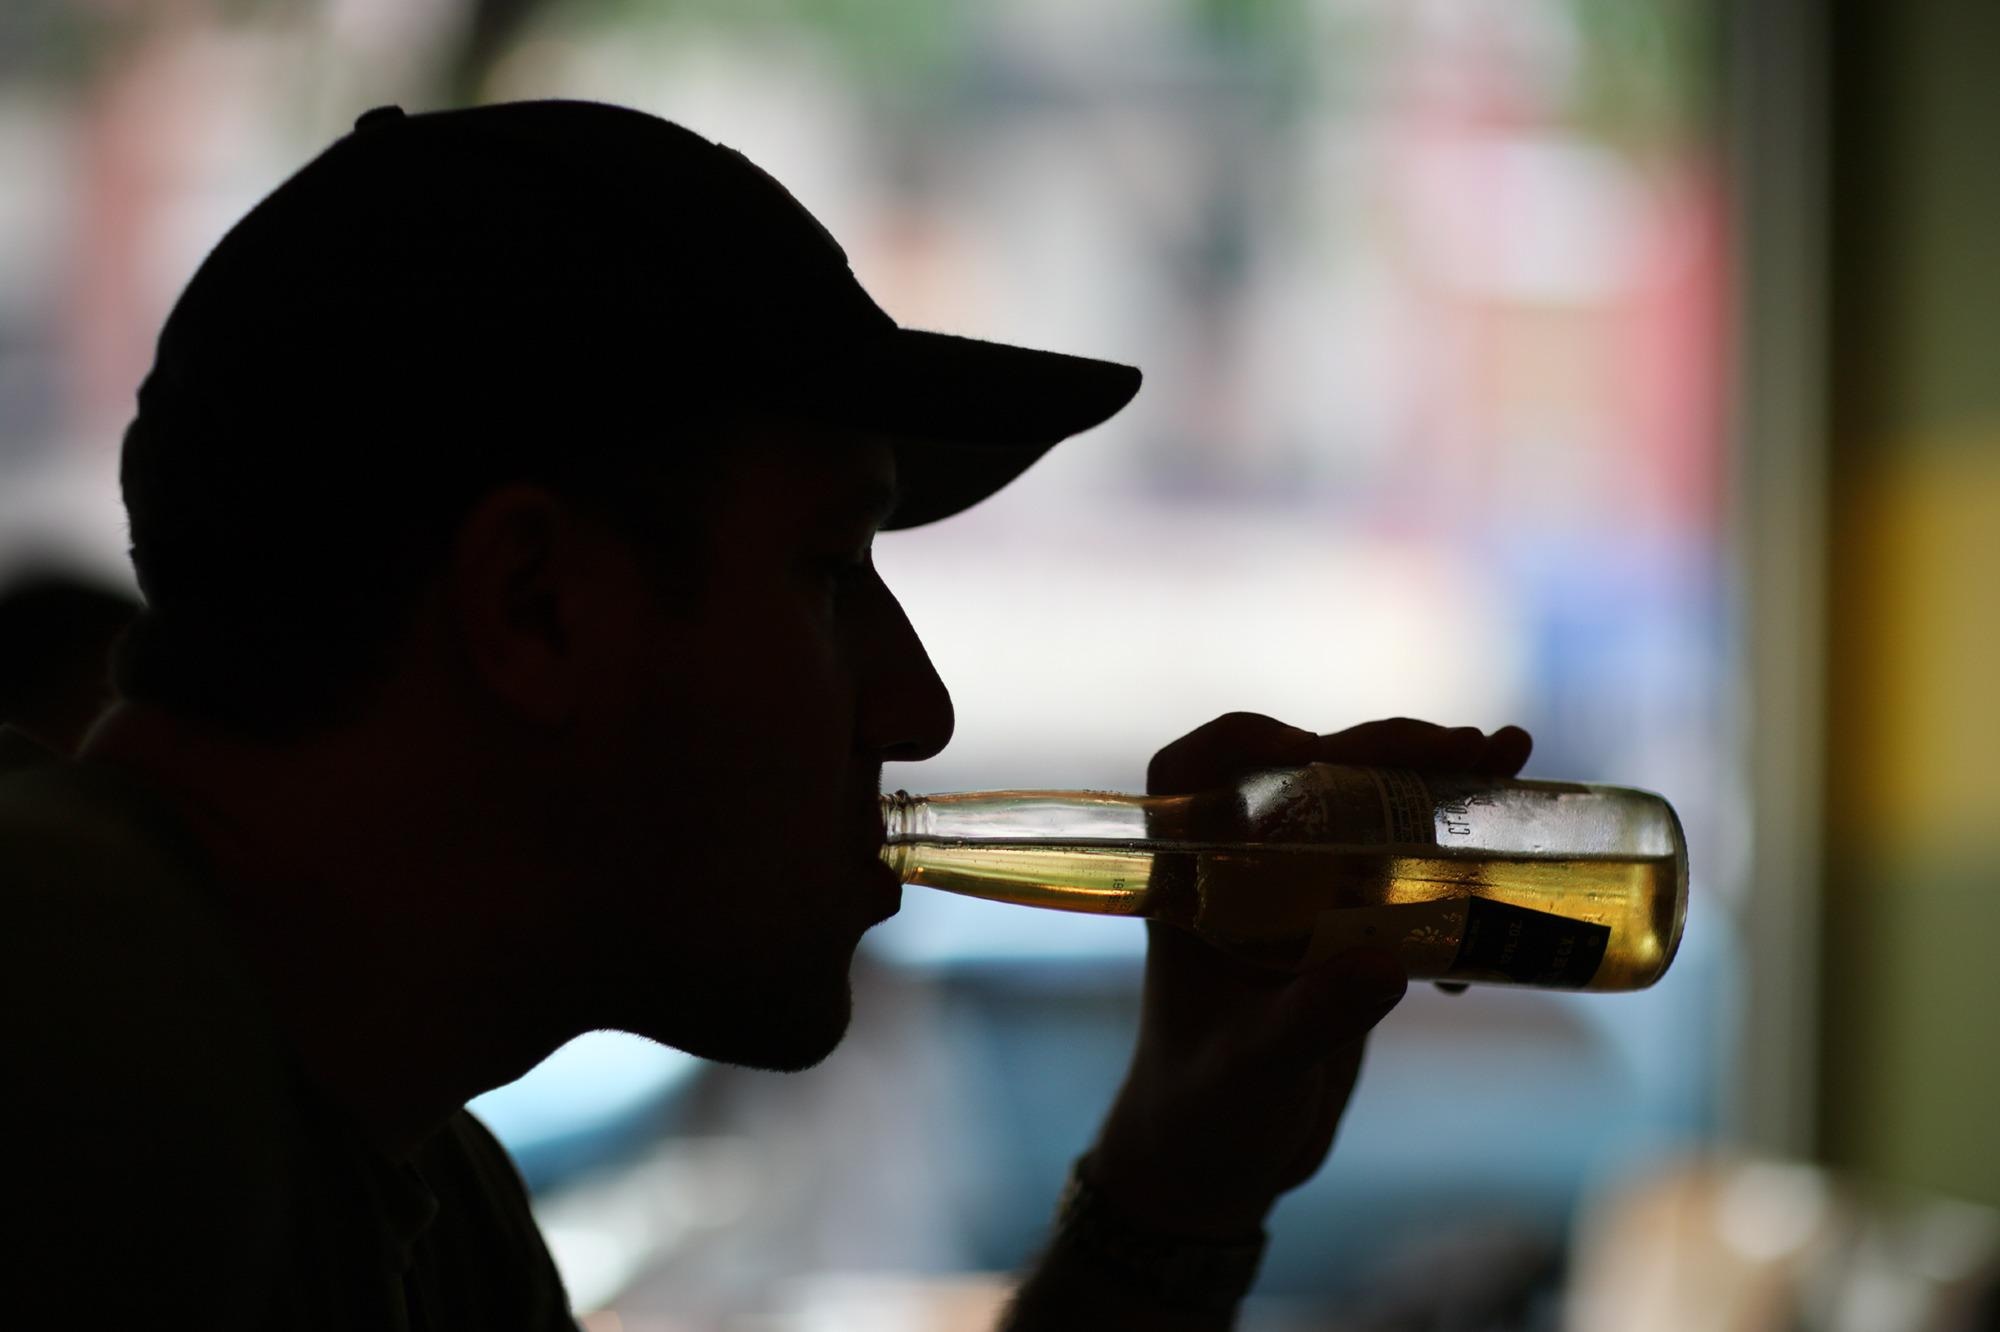
As per estimates, the sale and consumption of alcohol in the USA increased during the first months of the COVID-19 pandemic and whether it persisted in the later phases of the pandemic remains unknown. Stress, reduced health access, economic distress, institutional racism, alcohol delivery services, and lack of alternative enjoyment sources might have increased for some subsets of the population, whereas bar closures and decreased social gatherings might have decreased drinking habits in some others. However, longitudinal studies characterizing drinking trajectories throughout the pandemic are lacking.
 Study: Alcohol use trajectories among U.S. adults during the first 42 weeks of the COVID-19 pandemic. Image Credit: logoboom / Shutterstock
About the study
In the current study, researchers longitudinally examined the drinking trajectories in the first 42 weeks of the COVID-19 pandemic among the US adult population.
The coronavirus in America longitudinal survey comprised biweekly surveys with March 10, 2020, as the baseline. It invited respondents of the ‘Understanding America Study (UAS)’ to participate. The surveys were self-administered online questionaries, and the present study used 21 biweekly survey waves between March 10, 2020, and January 20, 2021. Participants were provided with internet-enabled tablets if they lacked resources. Respondents self-reported ethnicity/race, sex, age, marital status, the highest level of education, and annual household income.
Employment status was ascertained each wave, and the responses were captured as a) consistently working, b) reduced time/job loss, 3) consistently not working, or 4) other. The frequency of drinking over the past week was measured. In the third survey wave, an item that assessed the number of drinks consumed during a typical drinking day was introduced.
Growth mixture models (GMMs) were applied after descriptive analyses of aggregate samples. GMMs identified many homogenous trajectory subgroups using variance, mean, covariance patterns of person-level repetitive measurements of latent intercepts, and linear or quadratic slopes. Separate series of GMMs were estimated for drinking days and binge-type drinking with successively increasing trajectories. Lo-Mendell-Rubin (LMR) likelihood ratio tests, entropy values, and Akaike Information Criterion (AIC) selected models with best-fitting trajectories.
Results
Of the 8,547 UAS respondents invited for the coronavirus survey, 8,151 completed at least one survey. Among these, drinking frequency and intensity (binge-type) data were provided at least once by 8,130 and 7,833 respondents, constituting two analytic samples. There was variation in response rate across surveys and the number of surveys completed per respondent. On average, each respondent completed 15.64 surveys. More than half (52%) of the subjects were females, 61% were White, 18% Hispanic, 12% Black, 5% Asian, and other ethnic/racial groups constituted 4%. About 53% were married, 19% - 20% were below the poverty threshold, and 45% had a college degree.
Overall, 129,102 observations of drinking frequency and 123,619 of intensity (binge-type) were analyzed. In the aggregate sample, the average past-week drinking days increased from 1.17 in March to 1.48-to-1.55 in the next month, which gradually dropped throughout the year and ranged from 1.2 to 1.33 during the last four months of the study period. The mean proportional probability of binge-type drinking in the past week was relatively stable at 0.06 across all time points.
The final GMM for drinking frequencies yielded four trajectories: minimal/stable prevalence in 5,793 persons (72.8%), with < 1 drinking days in the past week across all time points. The moderate/late decreasing trajectory (representing 6.7% of the sample) with 3.13 mean drinking days in March, transient increases in April, and a decline from May to July that leveled off after that.
The moderate/early increasing trajectory (constituting 12.9% of the respondents) showed 2.13 mean drinking days in March, 2.93 in April, and 3.2 by 2020-end. The near-daily/early increasing trajectory (7.6% of participants) revealed 5.58 mean drinking days in March and 6.19 in April without ever returning to baseline.
GMMs for past-week binge-type drinking revealed an optimal four-class model. The minimal/stable prevalence was noted in 85.8% of respondents, with binge drinking probabilities consistently lower than 0.01 across all timepoints. The low-to-moderate/fluctuating trajectory (constituting 7.4% of respondents) exhibited varying drinking probabilities without systemic trends.
The moderate/mild increasing trajectory (of 4.2% participants) showed a probability of 0.39 in April, 0.59 in May, achieving peak levels during August – September at 0.65, and never returned to baseline. The high/early increasing trajectory (representing 2.7% of participants) showed a 0.84 probability of binge drinking in April that increased to 0.96 in June without ever returning to baseline.
Conclusions
The study found that most adults in the US had minimal-to-no-drinking (72.8%) and negligible binge-type drinking (85.8%) habits. Two subpopulations constituting 20.5% of the sample size increased drinking frequency during the pandemic. Similarly, binge drinking was higher in two subpopulations representing 6.9% of the study population, and notably, they never returned to baseline levels until the end of the study (January 2021). The self-reports of alcohol use may be susceptible to measurement error, while survey non-responses may affect the results. Data from pre-COVID-19 periods wasn't available, thus making it difficult to adjust for pre-pandemic trends.
Journal reference:
- Alcohol use trajectories among US adults during the first 42 weeks of the COVID- 19 pandemic, Leventhal, A.M., Cho, J., Ray, L.A., Liccardo Pacula, R., Lee, B.P., Terrault, N., et al (2022), Alcoholism: Clinical and Experimental Research, DOI: https://doi.org/10.1111/acer.14824, https://onlinelibrary.wiley.com/doi/10.1111/acer.14824