An important objective of medical research is to identify the underlying molecular mechanisms of human brain health and diseases.
This objective has been predominantly achieved through observational studies of gene expression in human brain tissues obtained from post-mortem brain donors for their analysis. Importantly, many of these studies are based on the assumption that gene expression in the post-mortem human brain is an exact representation of gene expression in the living human brain.
A recent study published on the medRxiv preprint server challenges this assumption by comparing human prefrontal cortex gene expression between living and post-mortem samples.
 Study: A study of gene expression in the living human brain. Image Credit: Design_Cells / Shutterstock.com
 *Important notice: medRxiv publishes preliminary scientific reports that are not peer-reviewed and, therefore, should not be regarded as conclusive, guide clinical practice/health-related behavior, or treated as established information.
How are human brains studied?
In medical research, the lack of living human brain tissues for analysis has resulted in a limited understanding of the underlying molecular basis of human brain health and illness. To date, most observational studies have used post-mortem brain samples to elucidate human brain molecular biology. In fact, this experimental method has been used to determine gene expression in various illnesses including Alzheimer’s disease (ALZ) and schizophrenia (SCZ).
These studies, many of which include small sample sizes, assume that gene expression in the post-mortem human brain is analogous to that of the living brain. Furthermore, many of these studies involved the use of analytical methods that predated the advent of next-generation sequencing technologies.
About the study
Recently, the Living Brain Project (LBP) has provided a safe protocol to obtain prefrontal cortex (PFC) tissue from living people for medical research purposes. The LBP technique is used for the biopsy of PFC and has been attributed to zero adverse events.
Based on standardized neurosurgical procedures, PFC samples were obtained from living individuals who were subjected to deep brain stimulation (DBS). DBS is a widely used treatment for neurological and mental illnesses such as obsessive-compulsive disorder, Parkinson’s disease (PD), and dystonia.
The current study analyzed samples from LBP to determine whether gene expression in the post-mortem brain is an accurate representation of gene expression in the living brain. Herein, gene expression was compared between 289 PFC samples obtained from 171 living participants (LIV) and 243 PFC samples from 246 post-mortem donors (PM).
PM samples were matched to LIV samples based on sex and age. The majority of participants had PD, which was determined using DBS.
All samples were subjected to RNA extraction, complement DNA (cDNA) library preparation, and RNA sequencing. Subsequently, raw nucleotide sequences were aligned to the reference transcriptome and normalized for each reference gene.
The expression of every gene associated with the trait of interest was analyzed using differential expression (DE) analysis. For a particular gene, the regression model beta captured both the magnitude and direction of the gene-trait association. Gene traits were collectively referred to as DE signatures of the trait.
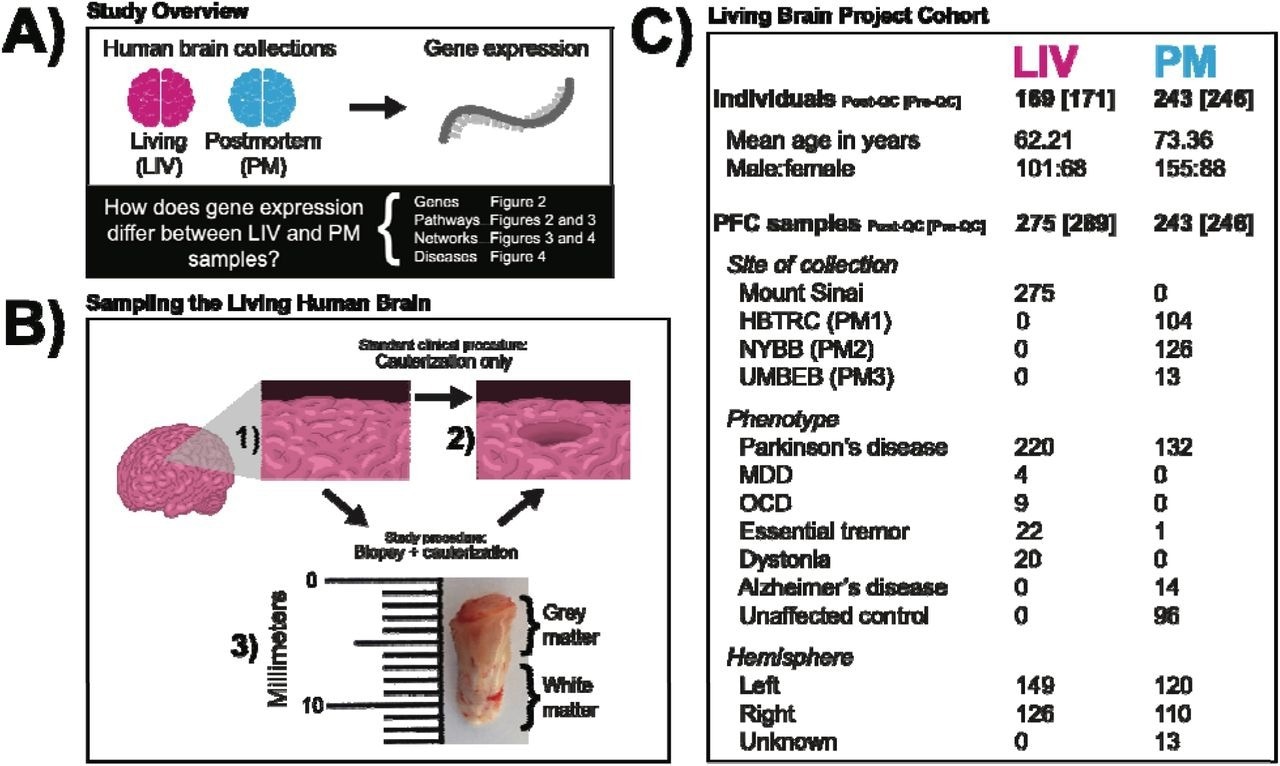 (A) Study Overview. The pink and blue colors represent LIV samples and PM samples, respectively, throughout all subsequent figures. (B) Sampling the Living Human Brain. The schematic illustrates that the standard clinical procedure and the modified study procedure amount to the same effective PFC volume loss. In 1) the state of the PFC at baseline is depicted. In 2) the final state of the PFC is depicted (i.e., the inner cylinder of tissue removed). The arrow and associated labels indicate how the final state of preparation is achieved in the standard clinical procedure (cauterization only) and the LBP procedure (biopsy followed by cauterization). Shown in 3) is a photograph of a PFC biopsy obtained for the LBP that i representative of the samples studied in this report. The top of the image is the anterior surface of the PFC. (C) Living Brain Project Cohort. Numbers refer to sample size (i.e., individuals or samples) except for age. The individual and sample numbers are identical for the PM cohort because only one sample was obtained per individual. Sample sizes inside and outside of the square brackets indicate counts prior to and after the application of quality control filters, respectively. [PFC = prefrontal cortex; QC = quality control; HBTRC (PM1) = Harvard Brain and Tissue Resource Center; NYBB (PM2) = New York Brain Bank at Columbia University; UMBEB (PM3) = University of Miami Brain Endowment Brain; MDD = major depressive disorder; OCD = obsessive-compulsive disorder]
Study findings
Gene expression levels significantly varied for about 80% of genes. However, these differential expressions were not related to cell type composition, age, ribonucleic acid (RNA) quality, post-mortem interval, morbidity, medication, tissue pathology, symptom severity, sample handling, or computational methods utilized.
Generated data were compared with previous research on the analysis of post-mortem brain tissues. This comparative analysis revealed that post-mortem brain gene expression signatures of neurological and mental illnesses, as well as normal traits like aging, may not be accurate representations of gene expression signatures in the living brain.
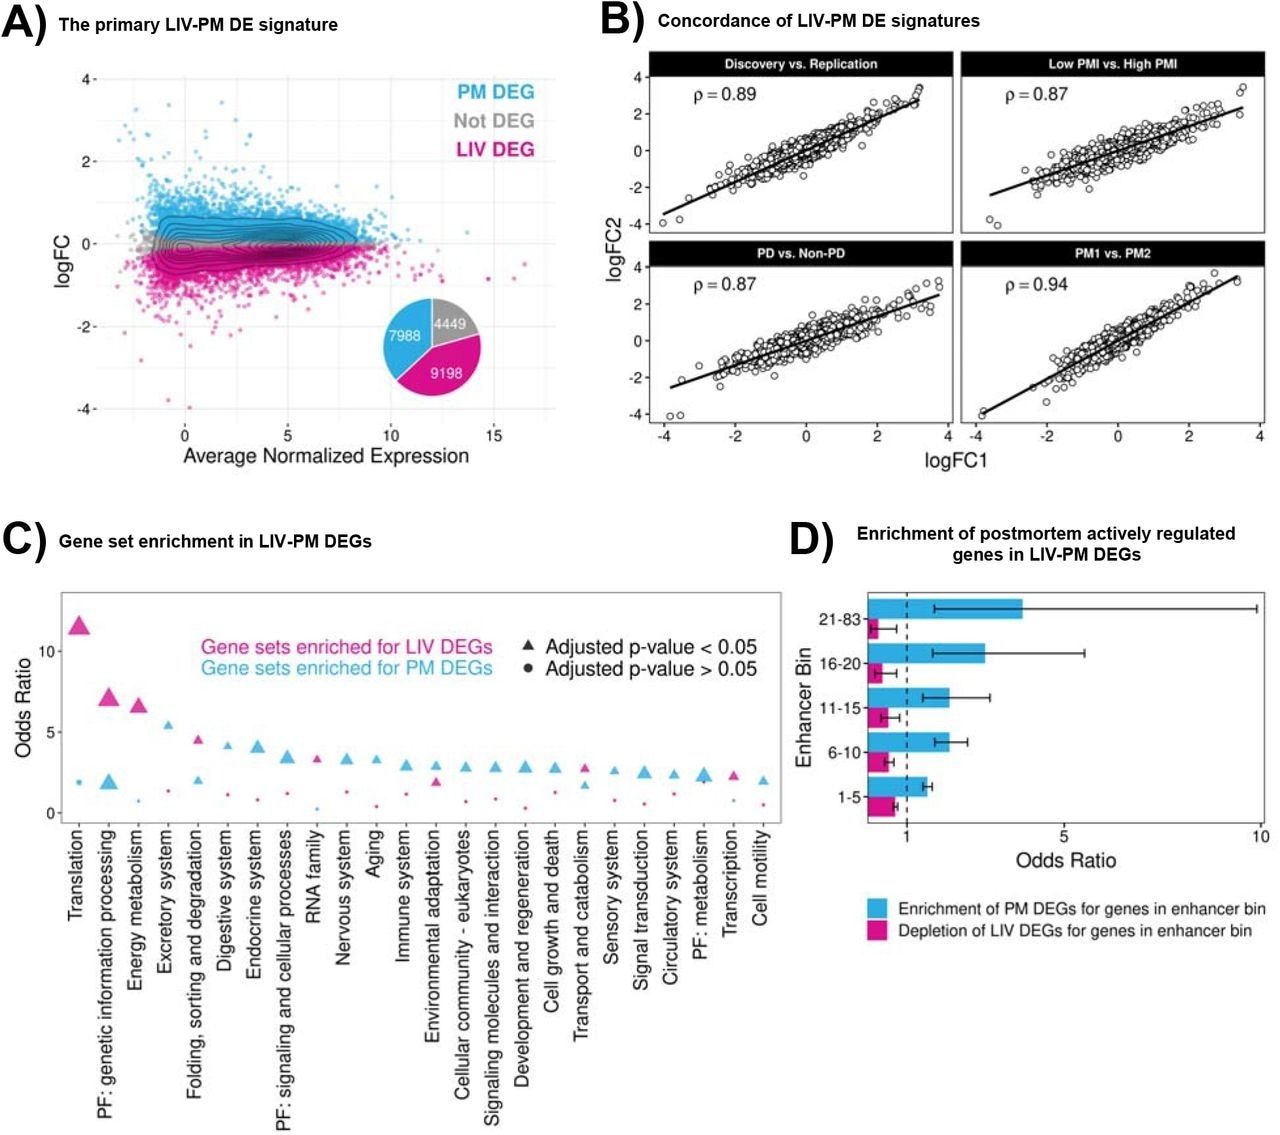 (A) LIV-PM DE results in the full LBP cohort. The scatterplot has one point for each of the 21,635 genes expressed in the full LBP cohort (275 LIV samples and 243 PM samples). The x-axis of the scatterplot is the average normalized expression level for each gene. The y-axis of the scatterplot is the LIV-PM DE regression model beta (by convention, the “logFC”) for each gene. Blue points represent DEGs upregulated in PM samples relative to LIV samples and pink points represent DEGs upregulated in LIV samples relative to PM samples. Grey points represent genes that were not differentially expressed between LIV samples and PM samples. The pie chart shows the fraction of scatterplot points that are blue, pink, and grey. The numbers in the pie chart indicate the number of LIV DEGs, PM DEGs, and Not DEGs. (B) LIV-PM DE Signature Comparisons. Each of the four scatterplots depict the relationship between LIV-PM DE signatures generated from independent subsets of LBP samples. X- and y-axes are the logFC values of the two LIV-PM DE signatures being compared in the plot. The Spearman’s correlation coefficient (ρ) between the two LIV-PM DE signatures is shown. The LIV-PM DE signatures compared in each plot are indicated by the plot title and fully described in the main text. For the “Low PMI vs High PMI” panel, only PM1 is depicted. (C) Gene set enrichment in LIV-PM DEGs. Each circle or triangle is a KEGG gene set tested for enrichment in LIV DEGs (pink circles and triangles) and PM DEGs (blue circles and triangles). The x-axis is the parent category of the gene set in the KEGG database. The y-axis is the Fisher’s Exact Test odds ratio for enrichment of a KEGG gene set in LIV DEGs and PM DEGs. Only parent categories with >=1 significant enrichment in either LIV DEGs or PM DEGs are included in the figure. For a given parent category, the KEGG gene set with the smallest p-value in LIV DEGs and PM DEGs is plotted. Triangles indicate that the enrichment test result is significant after p-value adjustment and circles indicate that the enrichment test result is not significant. The size of the triangles and circles corresponds to the -log10(p-value) of the Fisher’s Exact Test, meaning larger sizes are more statistically significant. The full KEGG gene set enrichment results for LIV DEGs and PM DEGs are provided in Supplementary Table 2 with a column indicating the gene sets depicted in this figure. (D) Enrichment of postmortem actively regulated genes in LIV-PM DEGs. Each of the 3,852 actively regulated genes expressed in the full LBP cohort was assigned to one of five sequential “enhancer bins” based on the number of high-confidence active enhancers linked to the gene (i.e., 1-5, 6-10, 11-15, 16-20, or 21-83). The x-axis is the Fisher’s Exact Test odds ratio for the overlap of enhancer bin genes with LIV DEGs (pink bars) or PM DEGs (blue bars). The y-axis indicated the enhancer bin.
Strengths and limitations
A key strength of the current study is its design, which included a large sample size and the use of next-generation sequencing technology to measure every gene expressed in the brain. When possible, the study results were validated using external data sources. Furthermore, all findings of this study have been shared publicly so that the scientific community can analyze and utilize the findings.
Some notable limitations include the lack of PFC samples from living healthy controls, living SCZ patients, living ALZ patients, and living bipolar disorder (BD) cases. The lack of this type of data prevents the comparison between gene expression signatures of diseases identified in living human brains and post-mortem human brains.
Conclusions
LBP provides a safe and scalable methodology for living human PFC tissue sampling. Additionally, LBP samples allow researchers to acquire substantial evidence confirming that gene expression in post-mortem human brain tissue may not accurately represent gene expression in living human brain tissue.
The study findings also demonstrate that post-mortem brain gene expression markers of neurological and mental illnesses are not always accurate representations of the gene expression markers in the living brain.
*Important notice: medRxiv publishes preliminary scientific reports that are not peer-reviewed and, therefore, should not be regarded as conclusive, guide clinical practice/health-related behavior, or treated as established information.
 First-in-the-world gene therapy delivers missing gene directly to infant’s brain, marking historic milestone in precision medicine