Brett Hale1*, Caroline Obert2, Kyle Metcalfe2, , Andrew Boddicker2, Marielle Krivet2 , Junhua Zhao2, Tuval Ben-Yehezkel2, Pranav Patel3, Yann Jouvenot3 , Wes Austin3, Gagneet Kaur3
16S sequencing is used to detect and examine bacteria according to the 16S ribosomal RNA (rRNA) gene present in prokaryotic organisms. Amplifying and sequencing this gene can help researchers contrast sequences with databases and calculate the composition of microbial communities within species. This approach is often used in microbiome research, clinical diagnostics, and environmental monitoring.
Metagenomic samples are some of the most difficult samples for NGS analysis because of the significant variability and quantity of genomic material sources:
- High mass fecal samples
- Dilute genomic material from wastewater
- Low percentage of bacterial vs. host DNA mass ratio
- Inhibitor contaminants carryover
Over- and under-amplification can significantly affect the data quality of well-characterized PCR artifacts such as chimeras, false positives, and negatives. It can also complicate analysis, affecting the accuracy of results.
These challenges are made worse by the low read depth needed per sample, increasing the sample multiplexing level needed to efficiently optimize sequencing output.
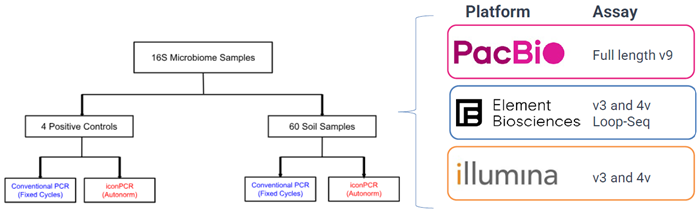
Here, n6 presents two studies that showcase workflow and data quality enhancements:
- Study 1: “Kitchen Sink” 16S profiling across fecal, soil, and human samples
- Study 2: Extensive soil metagenomics using different sequencing platforms
Study 1: Significant soil metagenomics using different sequencing platforms
Details: Comparison of Standard vs. iconPCR AutoNormalization
- 1500 bp full-length v9 16S PacBio sequencing
- Short read v3 and v4 amplicons on Illumina and Element
- Loop-Seq long read on short read sequencing
- ZymoBIOMICS Community DNA Standard
Data is Excerpt from Full Publication Results from Below Publication: The use of iconPCR for 16S library preparation improves data quality and workflow. Image Credit: Jouvenot, et al, BioRxIV doi: https://doi.org/10.1101/2024.12.18.629279

Image Credit: n6
Study 2: “Kitchen Sink” 16S profiling carried out on fecal, soil, and human samples
Details:
- Zymo Quick 16S Full Length Library Prep Kit
- 1500 bp full-length 16S PacBio sequencing
- Dilution series of ZymoBIOMICS Community DNA Standard (D6306)
- 16 Fecal
- 16 Soil
- Eight Skin
- Three Vaginal
- Two Buccal
- Three Hand
Study 1: Extensive soil metagenomics using different sequencing platforms
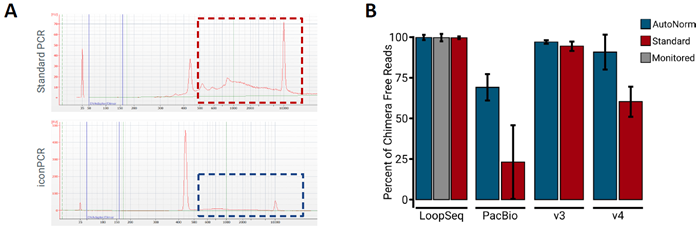
Figure 1. iconPCR Produces Significantly Less Artifacts than Standard PCR. Image Credit: n6
A) The top panel depicts the the V4 Standard PCR pool, showing various peaks greater than 500 bp, with only 19 % of the total pool in the expected region. By comparison,the V4 iconPCR pool (lower panel), generated using AutoNormalization, only displays one peak around the expected size (~440 bp). B) Percent of chimera free reads from each sequencing method. Use of AutoNormalization (blue bars) shows an increase in the amount of chimera free reads as compared to Standard PCR (red bars).
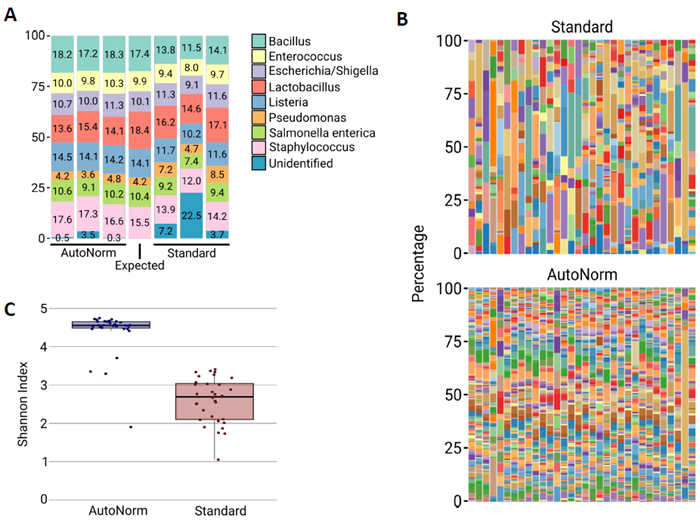
Figure 2. Increased Species Diversity and Accuracy with iconPCR. Image Credit: n6
A) Relative microbial abundance of the ZymoBIOMICS Microbial Community DNA Standard using either Standard PCR or AutoNormalization. Three replicates are shown for each. Using standard classification analysis, the Standard PCR process generated considerably more sequences that were classified as 16S amplicons. These false positive sequences (Unidentified), were not present in the actual sample, instead being created through PCR artifacts.
B) Barplots showing the microbial diversity of each soil sample sequenced on PacBio. Samples sequenced following AutoNormalization show an increase in the number of detected species. C) Box and whiskers plot for the Shannon diversity index of the soil samples sequenced on PacBio. Samples sequenced following AutoNormalization showed an increase in the diversity of the species detected.
Table 1. Long Read Molecules and Detected ASVs by Treatment. Comparison of read length and detected amplicon sequence variants (ASVs) for LoopSeq and
PacBio Sequencing. Use of iconPCR increases the percentage of ASVs compared to standard PCR. Source: n6
| Treatment |
Samples Evaluated |
Total Full-Length
Molecules (bp) |
Avg. Molecule
Length (bp) |
Full-Length
Molecules Between 1276
-1726 bps (%) |
Unique
ASVs
(%) |
ASVs without
Singletons (%) |
ASVs without
Doubletons (%) |
LoopSeq
iconPCR |
85 |
253,102 |
1474 ± 111 |
250,223
(98.9 %) |
234,023
(92.5 %) |
7,349
(2.9 %) |
3,220
(1.3 %) |
LoopSeq
Monitored PCR |
85 |
v421,512 |
1471 ± 104 |
414,866
(98.4 %) |
412,518
(97.9 %) |
3,386
(0.80 %) |
1,409
(0.33 %) |
LoopSeq
Standard PCR |
85 |
150,059 |
1052 ± 552 |
92,629
(61.7 %) |
87,653
(58.4 %) |
1,472
(0.98 %) |
434
(0.29 %) |
PacBio
iconPCR |
33 |
1,681,760 |
1490 ± 26 |
1,679,763
(99.8 %) |
991,488
(59.0 %) |
NA |
NA |
PacBio
Standard PCR |
33 |
780,585 |
1495 ± 26 |
779,049
(99.8 %) |
188,342
(24.1 %) |
NA |
NA |
Study 2: “Kitchen Sink” 16S profiling carried out on fecal, soil, and human samples
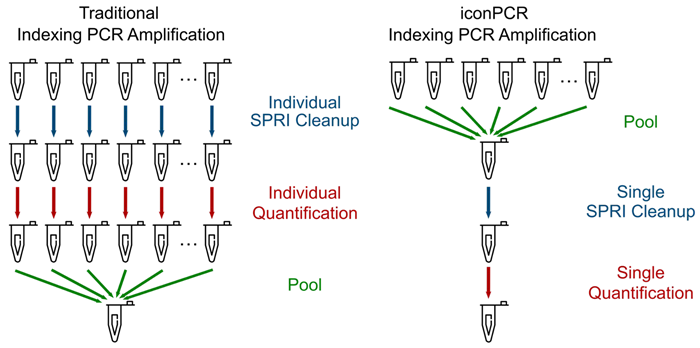
Figure 1. Simplified Workflow Using AutoNormalization. Image Credit: n6
Following index PCR, traditional workflows involve purifying each sample individually, followed by quantification. Samples can then be normalized to the same molar amount and pooled together. With AutoNormalization, the samples are normalized during the PCR process, allowing for an equal volume of each to be pooled together immediately following PCR. The single pool can then be cleaned, quantified, and loaded onto the sequencer. iconPCR simplifies the workflow by reducing hands-on time as well as reducing cleanup and QC costs.
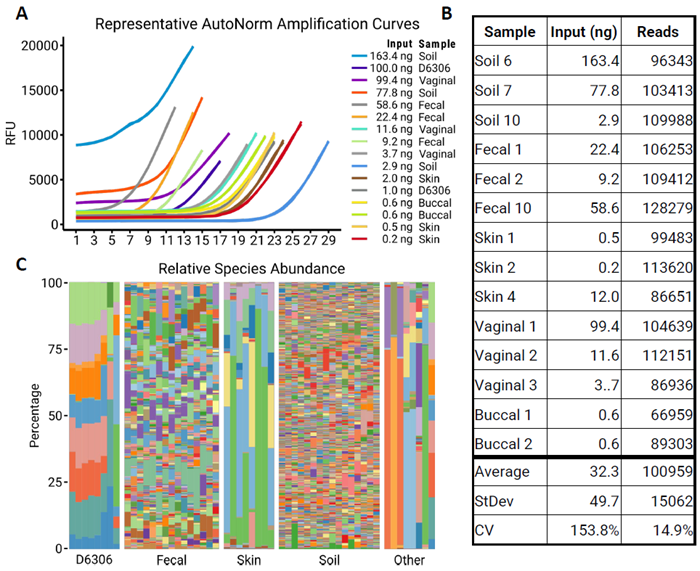
Figure 2. Effective Normalization of Libraries with AutoNormalization. Image Credit: n6
A) Representative amplification profiles of samples following iconPCR. Samples were normalized using the slope method, and cycling was stopped when the slope reached its maximum value. It’s important to note that input does not always correlate with the number of cycles. B) Following iconPCR, five μL of each sample was pooled, cleaned, and sequenced.
The table shows the representative samples and their associated read counts. AutoNormalization effectively normalized the output of all of the samples. C) Barplots show the relative abundance of each species for all samples tested. IconPCR allows for an efficient workflow of complex sample mixes.
Special Thank You and Authorship Credit to the Following: Brett Hale, AgriGro, Inc, Doniphan, MO, USA Carolyn Obert, Tuval Ben-Yehezkel, Junhua Zhao, Marielle Krivet, Kyle Metcalfe, Andrew Boddicker, Shawn Levy from Element Biosciences, San Diego, CA Yann Jouvenot, Pranav Patel, Gagneet Kaur, n6, Pleasanton, CA
About n6
n6 proudly introduces iconPCR, a pioneering advancement in the genomics field with the world’s first real-time thermocycler with 96 individually controlled wells. This breakthrough technology promises to revolutionize DNA amplification and sequencing by offering unmatched simplicity and flexibility, setting a new standard for genomic research and diagnostics.
Sponsored Content Policy: News-Medical.net publishes articles and related content that may be derived from sources where we have existing commercial relationships, provided such content adds value to the core editorial ethos of News-Medical.Net which is to educate and inform site visitors interested in medical research, science, medical devices and treatments.