Overview
Traditional PCR systems require users to set a specified number of cycles according to the assay and the input amount. As a result, input material must be quantified, and samples of varying inputs must be split across multiple PCR runs.
Optimal cycling of RNA-Seq libraries is crucial, as excessive or too little library cycling may generate changes to gene expression. Further challenges emerge when using samples of different quality, such as FFPE, where similar input amounts might not follow similar amplification profiles.
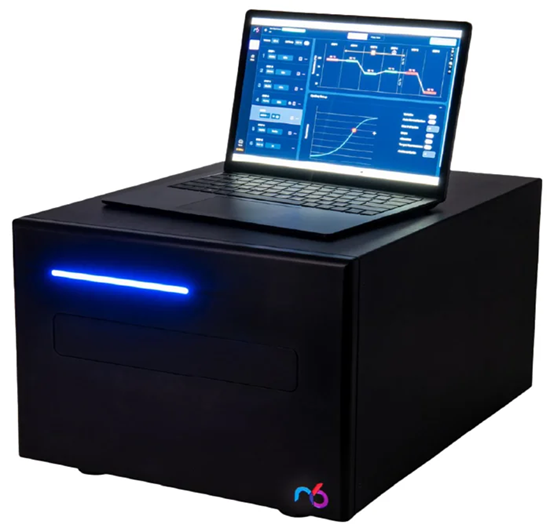
Figure 1. iconPCR, the world’s first real-time thermocycler with 96 individually controlled wells. Image Credit: n6
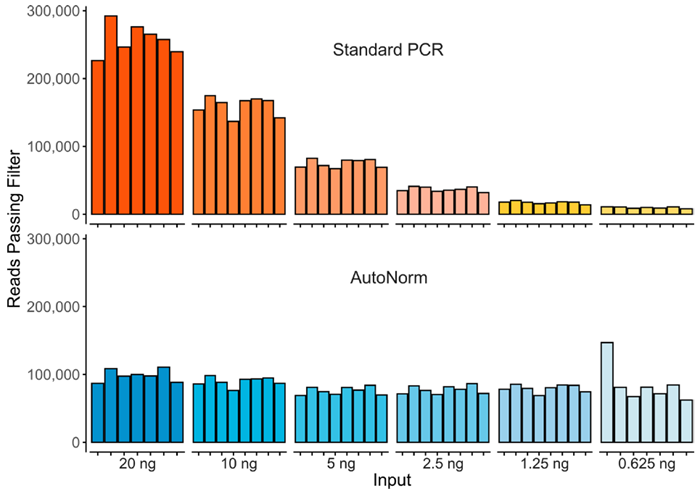
Figure 2. Here we show the significant yield variance when using a single PCR instrument with a fixed number of PCR cycles, compared to where each sample is amplified to similar levels. Image Credit: n6
n6’s iconPCR introduces a new approach to PCR. With AutoNorm™, every reaction is tracked in real time and stopped at the right fluorescence level, eliminating guesswork and delivering consistently well-amplified libraries.
To assess performance, n6 prepared RNASeq libraries using FFPE samples at different cycle numbers and thus demonstrated that overamplification of RNA-Seq libraries reduces data quality. Moreover, the use of AutoNorm staves off overamplification, which restores data quality while simplifying the processing of a large sample set.
Effect of PCR cycles on RNA-Seq
Data Quality 50 ng from a single FFPE sample was used as input for RNA-Seq library preparation over a broad spectrum of PCR cycles. After sequencing and down-sampling to normalize read counts, sequencing metrics were contrasted across different cycle numbers.
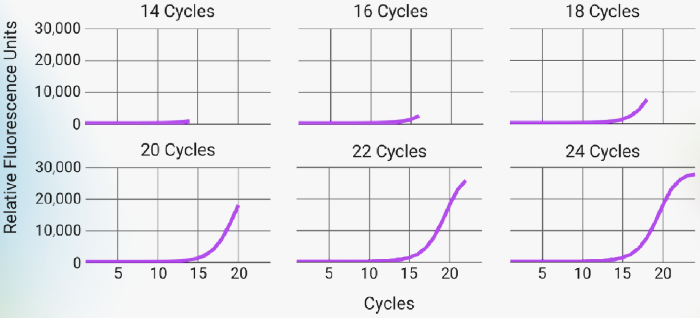
Figure 3. PCR amplification curves across differing cycle numbers. Plots depict where along the PCR amplification curve each condition was stopped. The conditions tested represent those from the early exponential phase (14 cycles) up the the establishment of the plateau (24 cycles) in 2 cycle increments. Image Credit: n6
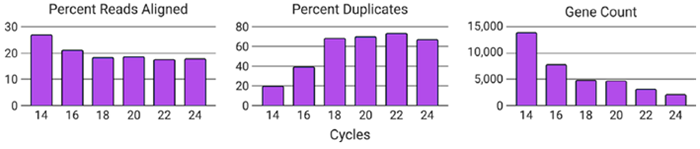
Figure 4. Increasing PCR cycles decreases data quality. Each condition was downsampled to 1M reads passing filter and subsequently aligned to the human reference genome. As the number of PCR cycles increased, the percentage of aligned reads decreased, and the percentage of PCR duplicates identified increased. Combined, this led to decreased the total number of genes detected. Image Credit: n6
Maximized RNA-Seq workflows
To show how iconPCR can enhance RNA-Seq workflows, RNA-Seq libraries were produced from four different FFPE samples of one, 10, or 100 ng inputs using standard PCR conditions or iconPCR with AutoNorm.
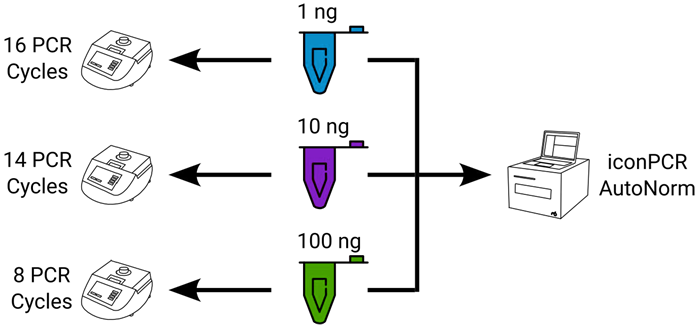
Figure 5. Experimental design showing sample distribution across workflows. For each sample tested, one ng, 10 ng, or 100 ng of RNA was used as input. For standard PCR, each input amount was used with a fixed number of PCR cycles, requiring three separate thermocycler runs. For iconPCR with AutoNorm, all samples were run simultaneously on a single instrument. Image Credit: n6
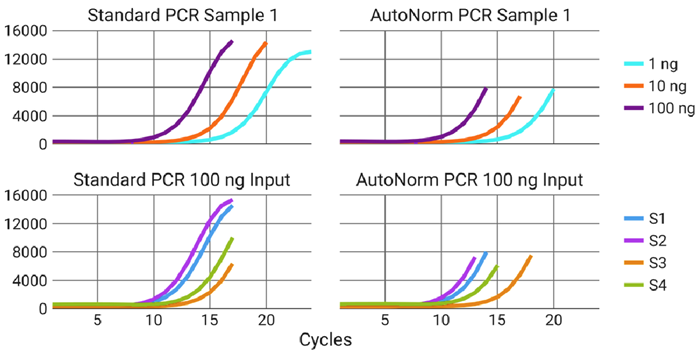
Figure 6. iconPCR allows for simultaneous processing of samples across a range of inputs while ensuring proper amplification is achieved. Different sample inputs require different numbers of PCR cycles to achieve optimal amplification (top), but even across the same input, samples can dramatically differ in the number of required cycles (bottom). iconPCR allows for all samples to be run simultaneously, while ensuring that each receives the proper amplification level. Image Credit: n6
Optimized RNA-Seq workflows, continued
Table 1. AutoNormalization dynamically controls cycle numbers. The table shows the stop cycle for each sample in the study. The use of iconPCR with AutoNorm allows each sample to stop at a different number of cycles, ensuring that each sample is properly amplified, all within a single PCR run. Source: n6
|
1 ng |
10 ng |
100 ng |
| Sample |
Standard |
AN |
Standard |
AN |
Standard |
AN |
| Sample 1 |
24 |
20 |
20 |
17 |
17 |
14 |
| Sample 2 |
19 |
16 |
13 |
| Sample 3 |
19 |
19 |
18 |
| Sample 4 |
20 |
18 |
15 |
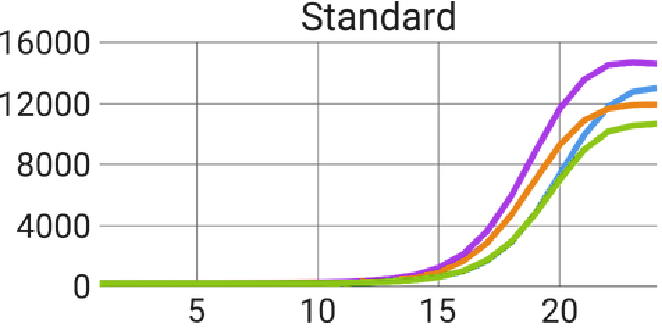
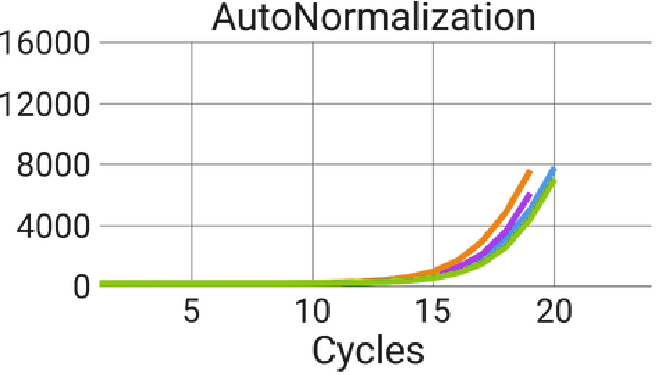
Figure 7. AutoNorm stops overamplification of samples. Using the standard PCR cycling conditions with a one ng input, all samples reached the plateau of the amplification curve. AutoNorm prevents samples from reaching the plateau. Image Credit: n6
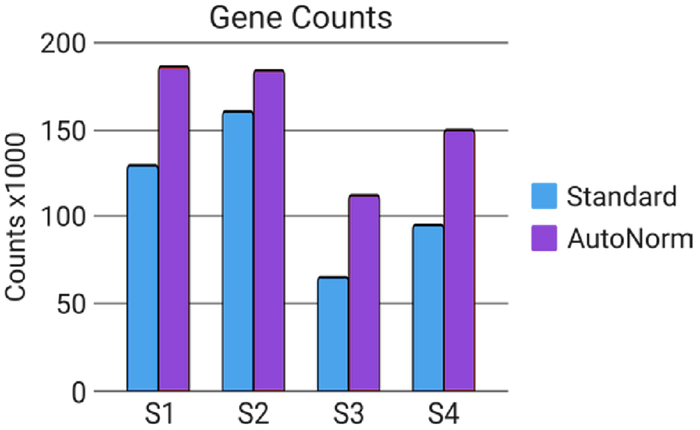
Figure 8. Overamplification results in decreased data quality. Gene counts were lower in the one ng input samples from Standard PCR conditions than samples that had undergone AutoNorm, where amplification was stopped in the linear phase. Image Credit: n6
Benefits of iconPCR
Source: n6
| Conventional PCR |
iconPCR (with AutoNorm) |
| Fixed cycle count (e.g., 30 cycles) |
Real-time fluorescence monitoring |
| One-size-fits-all amplification |
Per-well cycle control based on signal, not guesswork |
| Under/over-amplification common |
Optimal amplification per sample |
| High chimera rates |
Reduced chimera formation |
| Variable library quality |
Uniform library quality across all wells |
| Manual quant and normalization required |
Automated normalization (no post-PCR quant) |
| More hands-on time |
40–60 % reduction in hands-on time |
| Increased reagent waste |
Lower reagent waste, fewer failed libraries |
| Extra QC and rerun costs |
Faster turnaround, minimal QC/rescue steps |
Conclusion
By overcoming the constraints of standard PCR, iconPCR simplifies library preparation. With AutoNorm™ technology, each well is tracked and amplified to its precise cycle requirement, producing consistent workflows and improved RNA-Seq library quality.
About n6
n6 proudly introduces iconPCR, a pioneering advancement in the genomics field with the world’s first real-time thermocycler with 96 individually controlled wells. This breakthrough technology promises to revolutionize DNA amplification and sequencing by offering unmatched simplicity and flexibility, setting a new standard for genomic research and diagnostics.
Sponsored Content Policy: News-Medical.net publishes articles and related content that may be derived from sources where we have existing commercial relationships, provided such content adds value to the core editorial ethos of News-Medical.Net which is to educate and inform site visitors interested in medical research, science, medical devices and treatments.