Hair K.1 , Austin W.2 , Alfrey J.2 , Patel P.2 , Jouvenot Y.2
1. Penn State Genomics Core Facility, University Park, PA 16802
2. n6, Pleasanton CA 94566
Indexes vary greatly and perform differently in different conditions. Some designs are predisposed to dimerization, while others are optimized at certain concentrations, and some will not be optimized at the right temperature. Variations in index performance can impact NGS libraries and sequencing results alike.
Using iconPCR for index PCR reveals differences in performance, but can also help remedy them. For example, the AutoNorm™ function allows users to form a condition that, once arrived at, triggers the well to stop cycling. Additionally, iconPCR’s abilities (variable cycling, with up to 96 different temperatures for each gradient) facilitate experimental design for maximizing future results.
Index variation
Next Generation Sequencing (NGS) index primers have a critical role in multiplexing samples by attaching unique sequence tags, also known as indices, to DNA fragments. These index primers are built to enable pooling of multiple samples in a single sequencing run, significantly reducing costs and increasing throughput.
However, their performance may vary according to the primer’s design. Variances in amplification efficiency, including differences in primer affinity, sequence context, or length, can affect the overall accuracy and sensitivity of sequencing results.
Some index primers may amplify some sequences preferentially, which can lead to biased representation of samples. Others might not bind efficiently, resulting in incomplete or diminished coverage.
Such performance disparities can be affected by factors like the GC content of the primers, secondary structures, or interactions with adapter sequences. Maximizing index primer design and PCR conditions is thus essential for reducing these amplification biases and guaranteeing reliable, high-quality NGS data.
As the figures below demonstrate, testing No Template Controls (NTC) shows that some sets of indexes are more likely than others to yield a signal (typically primer dimers) at early cycles.
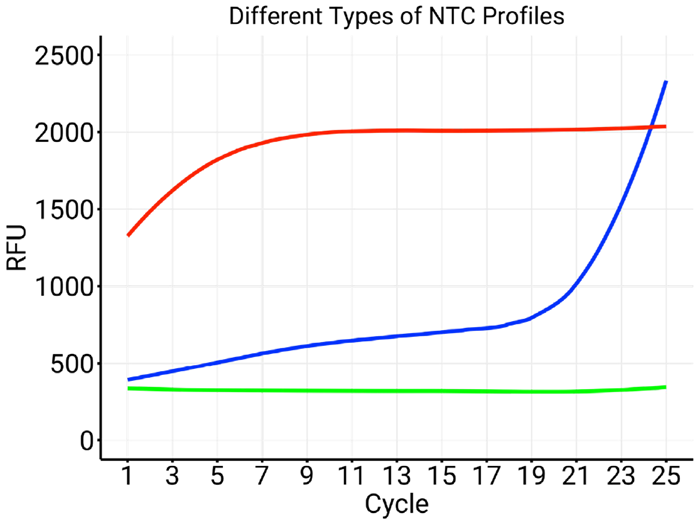
Figure 1. Three different types of NTC profiles. The green trace reflects an NTC that remains negative over the full 25 cycles. The blue trace highlights a set of indexes that generates dimers (especially after cycle 20). The red trace is characteristic of a set of indexes where one oligo is disproportionately abundant in comparison with the other. Image Credit: n6
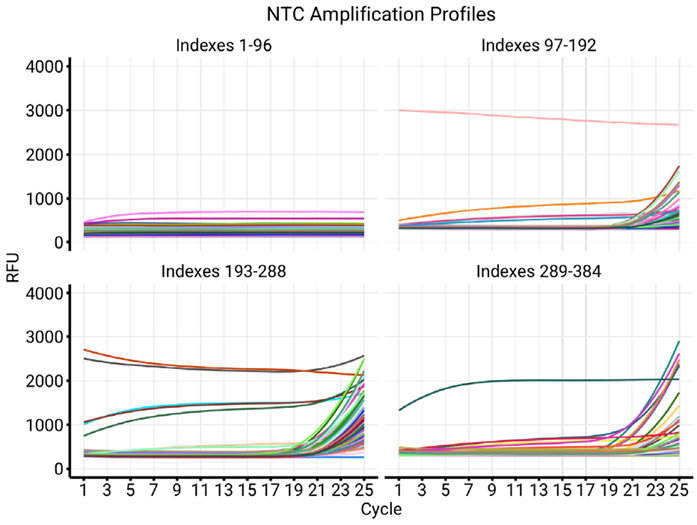
Figure 2. Testing of NTC in four 96-well plates of indexes. Illustrates the differences in quality between different sets of indexes. While Plate 1 displays no dimer amplification over 25 cycles, nearly all sets in plate 3 seem to produce dimer signal by cycle 20. Plates 2, 3, and 4 also display several traces typically associated with high concentration of one of the indexes (above baseline of 1000 RFU). Image Credit: n6
Index variances can impact library generation
The amplification of the same library with eight different indexes (Figure 3) demonstrates the effect of index variability during amplification.
Because standard protocols omit intercalant chemistry in index PCR, variations in amplification and efficiency often go unnoticed. IconPCR helps reveal these differences and normalize libraries, reducing their effect.
In a different experiment, 96 indexes were used in AutoNorm libraries (see Figure 4). Various samples were observed to have premature terminations alongside extremely elevated baseline fluorescence values (A9, B1, B8, and H5, seen separately in Figure 5a). Compared to wells with premature terminations, wells A2, C2, E2, and F2 displayed low background fluorescence alongside a successful AutoNorm (Figure 5b).
To examine whether the early termination resulted from the samples or the indexes, the same samples from Figure 5a were tested with indexes from Figure 5b, which generated proper amplification profiles (Figure 5c). Carrying out the inverse experiment of taking the samples from Figure 5b and testing them with the indexes from Figure 5a led to abnormal amplification profiles and premature terminations (Figure 5d).
Combined, this test shows that the quality of some indexes may impact amplification quality in different libraries, and thus on the NGS data resulting from their sequencing. Distinguishing part of such indexes should help guarantee the quality of high-throughput NGS workflows.
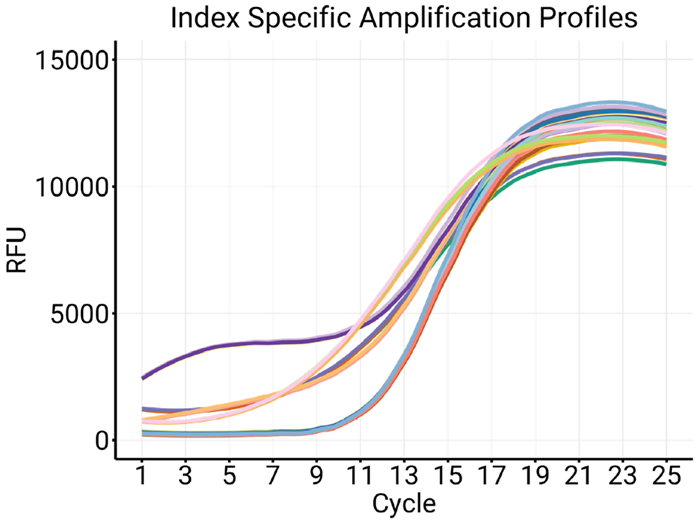
Figure 3. Amplification profiles for the same library amplified with eight different indexes. Image Credit: n6
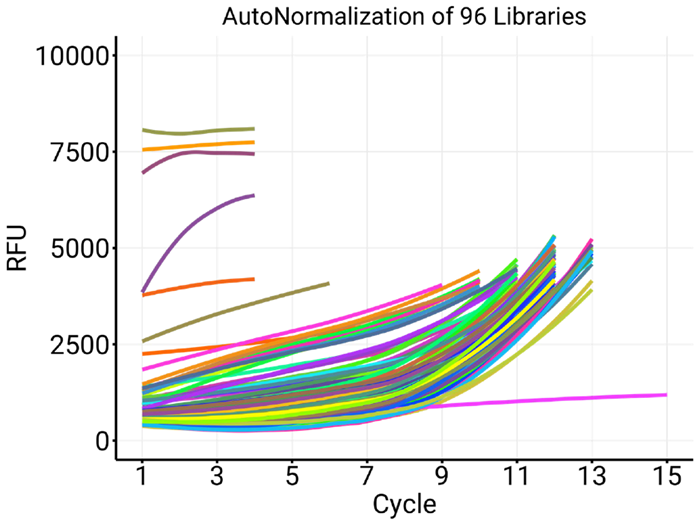
Figure 4. AutoNorm experiment using 96 libraries (Target Fluorescence mode). The samples used here were first-round amplicon products provided by Sagan Friant and Christian Herrera, Penn State University. Image Credit: n6
Index concentration will impact the amplification profile
Primer concentration in a real-time PCR assay greatly impacts the amplification profile and the reaction’s overall efficiency. If the primer concentration is too low, there may not be enough primer-template binding, resulting in inefficient amplification and potentially no detectable signal.
At the same time, too much primer concentration may lead to non-specific binding, resulting in the formation of primer-dimer products or unintended amplification of non-target sequences. This can then distort the amplification curve and diminish the quantification accuracy.
Maximizing primer concentration is key to achieving a balance wherein enough target-specific amplification takes place while reducing the formation of non-specific products. This ensures reliable and reproducible real-time PCR results. Proper primer concentration optimization aids in maintaining a consistent amplification profile, which is critical for NGS library indexing.
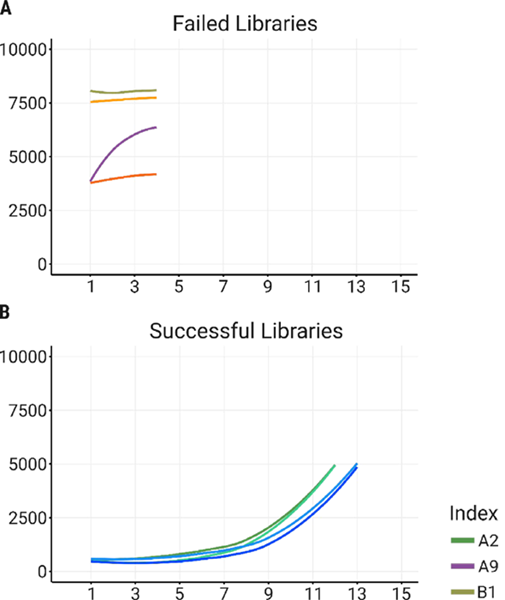
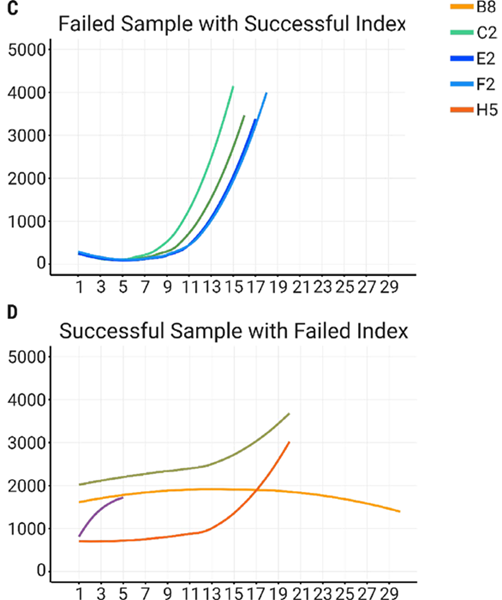
Figure 5a. Examples of premature termination profiles, seen during AutoNorm of samples 1-4 with indexes A9, B1, B8, and H5. Fig 5b. Examples of successful AutoNorm using samples 5-8 with indexes A2, C2, E2, and F2. Fig 5c. AutoNorm of samples 1-4 with indexes previously known to produce successful libraries (A2, C2, E2, and F2). Fig 5d. AutoNorm of samples 5-8 with indexes that led to abnormal profiles (A9, B1, B8, and H5). Image Credit: n6
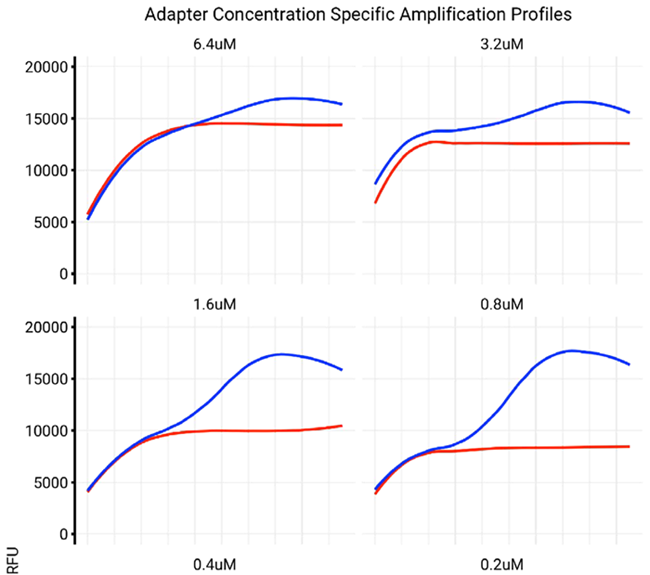
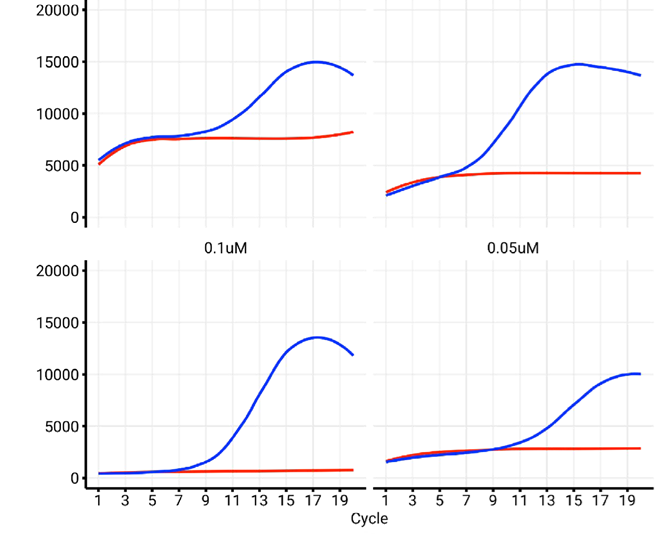
Figure 6. Influence of index concentration on library amplification profile. We observe that decreasing the concentration of indexes in the reaction restores a negative NTC profile (red trace), while also reestablishing a normal amplification profile for the positive control (blue trace). Image Credit: n6
Influence of annealing temperature and reaction mix on PCR profiles
Although oligonucleotide concentration is a key parameter for PCR amplification, it is not the only one. Reaction temperature, enzyme, and buffer conditions also affect PCR reaction efficiency and specificity. Figure 7 demonstrates how differences in annealing temperature and amplification supermix impact NGS library amplification with an otherwise suboptimal index set.
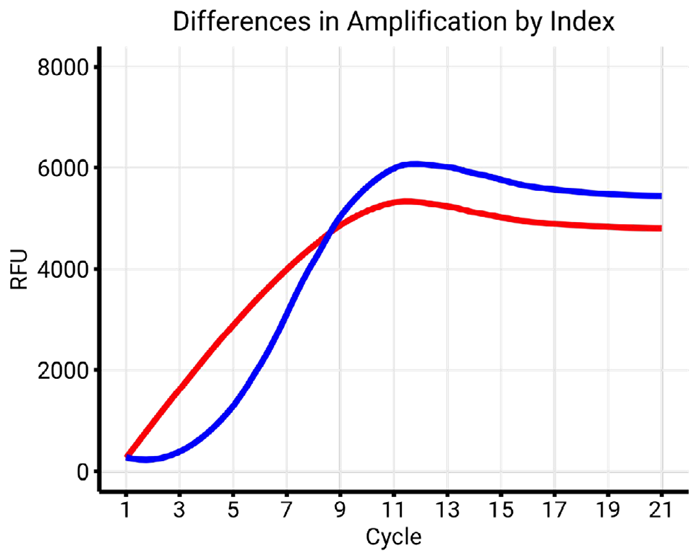
Figure 7a. Examples of different library amplification profiles. Comparison of index A (red) and index B (blue) with similar conditions (55 °C, Buffer X). Index A showcases an atypical amplification profile, as opposed to the classical S-shape displayed by index B. Image Credit: n6
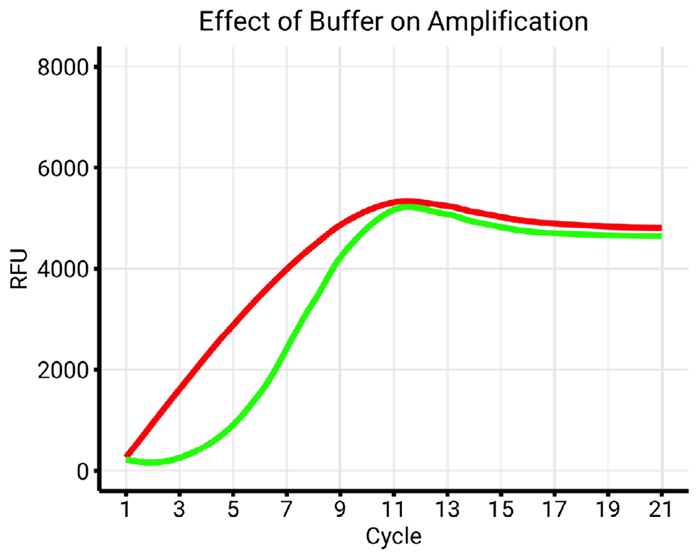
Figure 7b. Comparison of Buffer X (red) and Buffer Y (green) with similar conditions (55 °C, index A). Using buffer Y restores the amplification profile of index A to a standard S-shape curve. Image Credit: n6
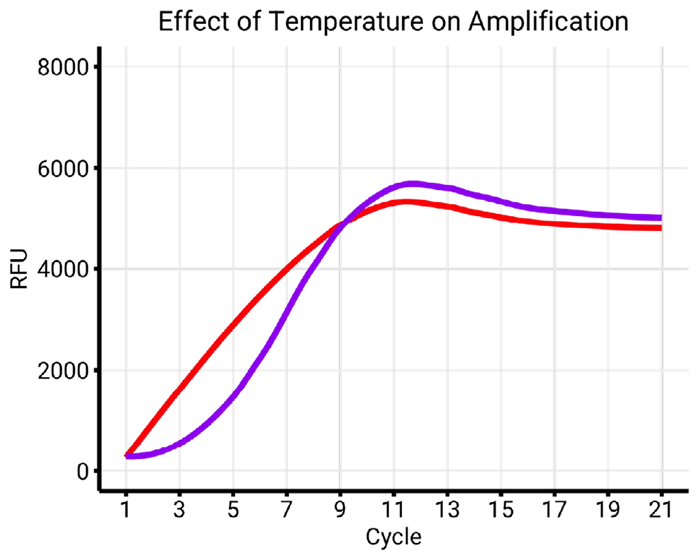
Figure 7c. Comparison of annealing temperatures, 55 °C (red) and 63 °C (purple), with similar conditions (buffer X, index A). The increase of annealing temperature to 63 ° Crestores the amplification profile of index A to a normal S-shape curve. Image Credit: n6
Conclusion
NGS indexes have a critical role in multiplexing samples. However, they can also lead to performance variations owing to variations in primer design and synthesis. Differences in index performance may affect NGS library generation and sequencing outcomes, resulting in biased representation and incomplete coverage.
Factors like primer concentration, annealing temperature, and reaction mix conditions can affect index amplification profiles. Maximizing index primer design and PCR conditions reduces amplification biases and guarantees reliable, high-quality NGS data.
iconPCR can be utilized to reveal and relieve differences in index performance. Using AutoNorm, libraries can overcome differences in PCR efficiency and enable users to bring all libraries to the same levels by tracking how much DNA synthesis is carried out (intercalant dye fluorescence) instead of applying identical cycle quantities to all libraries.
About n6
n6 proudly introduces iconPCR, a pioneering advancement in the genomics field with the world’s first real-time thermocycler with 96 individually controlled wells. This breakthrough technology promises to revolutionize DNA amplification and sequencing by offering unmatched simplicity and flexibility, setting a new standard for genomic research and diagnostics.
Sponsored Content Policy: News-Medical.net publishes articles and related content that may be derived from sources where we have existing commercial relationships, provided such content adds value to the core editorial ethos of News-Medical.Net which is to educate and inform site visitors interested in medical research, science, medical devices and treatments.