The SARS-CoV-2 virus causing the COVID-19 pandemic is a single-stranded RNA virus. The virus is thought to have been transmitted from animals, though there is no evidence yet of direct transmission.
Apart from studying the molecular and biological mechanisms of viral infection on human cells, several studies have focused on animals such as ferrets, hamsters, cats, and monkeys to determine their susceptibility and their suitability as animal models.
Detecting and imaging SARS-CoV-2 in tissues has mainly been done using conventional immunohistochemistry methods. However, since these are based only on thin sections of tissues, they do not provide a complete spatial picture of the infection.
Advances in tissue optical clearing (TOC) methods have allowed large intact tissues to be made optically clear. This does away with the need for physical sectioning and provides a 3D image using optical sectioning.
Two studies have previously reported using 3D imaging of SARS-CoV-2-infected lung tissue. One study used phase-contrast tomography to study unstained lung tissue. The other study reported fluorescent H&E-analog stains to obtain 3D pseudo-histological imaging.

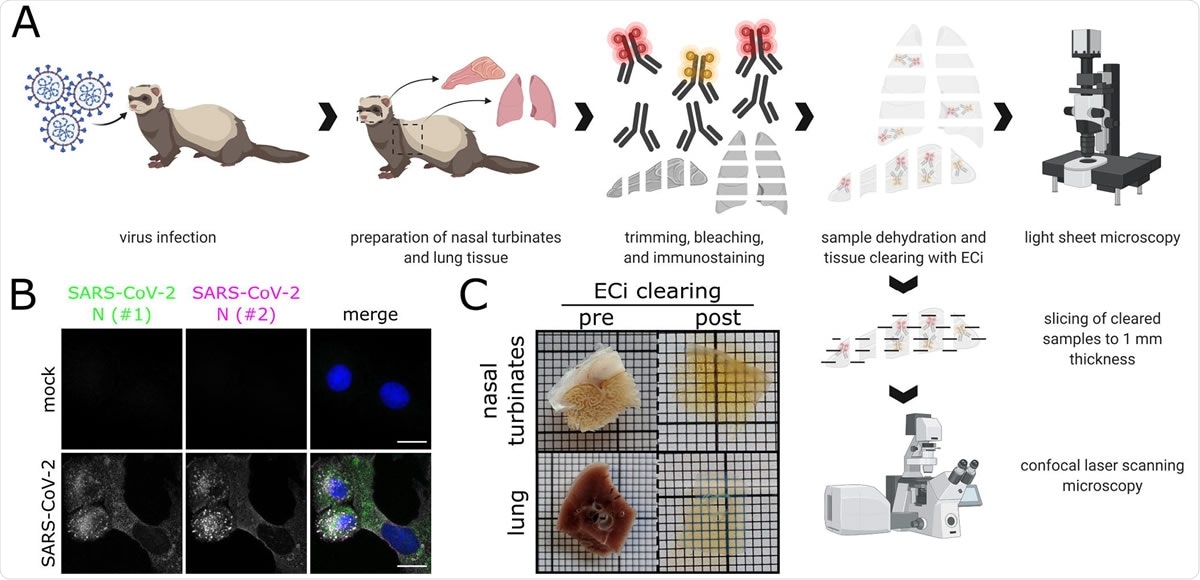
Workflow for correlative LSFM-CLSM of SARS-CoV-2-infected ferret tissues. (A) Nasal conchae and lungs tissue from SARS-CoV-2-infected ferrets were collected, trimmed, and immunostained against SARS-CoV-2 N protein. Fully dehydrated and optically transparent samples were acquired in toto with a light sheet microscope and subsequently subsectioned to 1 mm-thick sections for correlative confocal laser-scanning microscopy. (B) Representative immunostaining for SARS450 CoV-2 N in infected VeroE6 cells using a commercially available polyclonal anti SARS-CoV N serum (#1, green) and a monoclonal anti-SARS-CoV N mix (#2, magenta) confirms antibody specificity. Blue: Hoechst33342. Scale bars = 15 µm. (C) Representative ferret respiratory tract samples before (left) and after (right) immunostaining and ECi-based optical clearing. The photographs from the lung sections (bottom) show two independent samples. Edge length of grid square: 1 mm.

 This news article was a review of a preliminary scientific report that had not undergone peer-review at the time of publication. Since its initial publication, the scientific report has now been peer reviewed and accepted for publication in a Scientific Journal. Links to the preliminary and peer-reviewed reports are available in the Sources section at the bottom of this article. View Sources
3D imaging of thick tissue samples
Researchers, in a new study, have shown a complete 3D image of the SARS-CoV-2 infection in a ferret. The team collected nasal, trachea, and lung tissue samples from infected ferrets, euthanized four days after infection, after ensuring the virus was inactivated.
They then added antibodies and stained the viral nucleocapsid protein to ensure fluorescence was seen only from the SARS-CoV-2 virus cells. After making the tissue samples optically clear using an ethyl cinnamate-based protocol, they imaged them using light-sheet fluorescence microscopy. They also sliced the tissue samples into thin sections and imaged them using confocal laser-scanning microscopy.
Using light-sheet fluorescence microscopy, the authors were able to image 4-mm thick tissue samples. They found several infection spots in the upper respiratory tract.

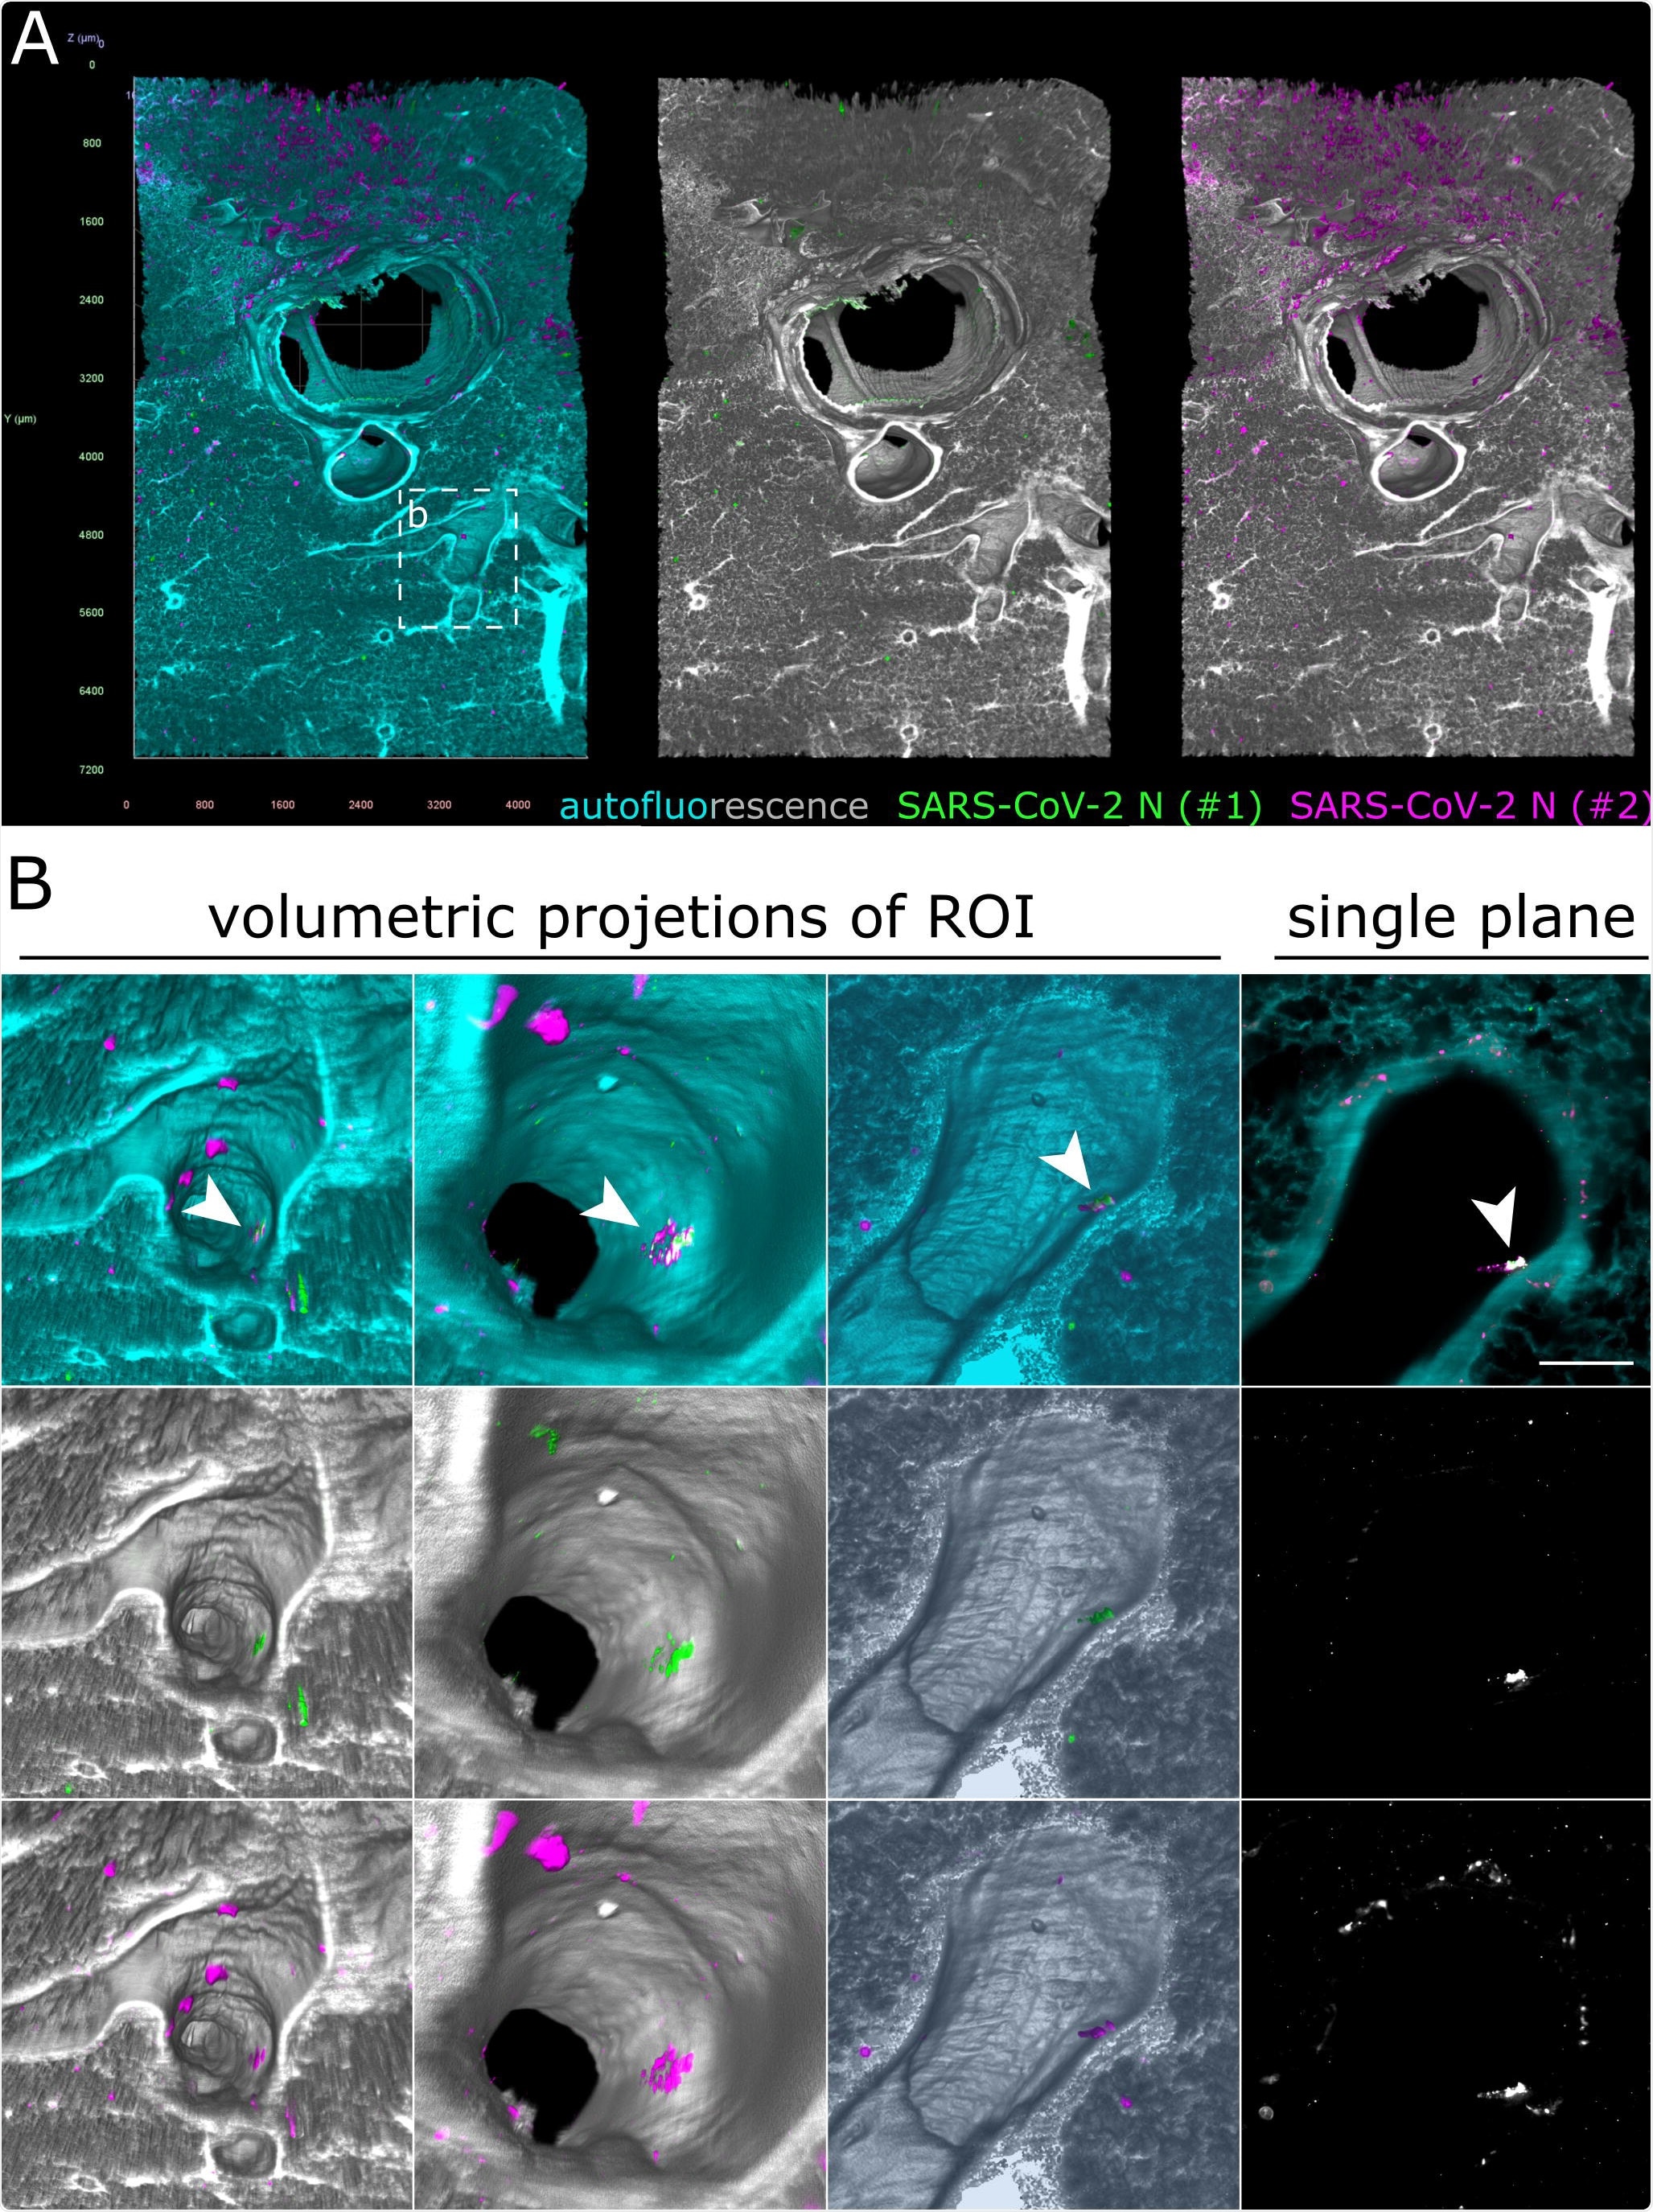
Only debris-associated SARS-CoV-2 antigen was detectable in ferret lung tissue at 4 days post-infection. (A) Volumetric projection of a large lung tissue section. While some background staining is detectable for the monoclonal antibody mix (#2, magenta), no signal overlap with the polyclonal antibody (#1, green) is visible. Cyan/grayscale = autofluorescence. Edge length of grid squares = 800 µm. Total magnification = 1.6x. (B) Alternate viewing angles reveal a spot inside an airway where both signals colocalize (white box in (A)). Contrary to the SARS-CoV-2- associated foci in Figures 2 and 3, the overlapping signal is detected lying on top the epithelial layer, suggesting that it is most likely cell debris inhaled from the URT.
Upon imaging with an increased magnification of 8x and virtually traveling through an image stack, the team found distinguishable virus infection points marked with clear boundaries.
The images provided a broad overview of the infection in the upper respiratory tract and provided details of individual infection hot spots like their area and distances between them.
The authors also performed image analysis on the obtained images, which allowed them to get quantitative parameters from the images. This represents a pronounced advantage of 3D immunofluorescence imaging over traditional immunohistochemical analysis, write the authors.
In addition to 3D imaging, the authors also sliced the tissues into thin sections and imaged the infection hotspots using confocal microscopy to obtain subcellular details. They were able to resolve individual SARS-CoV-2 infected cells and saw them in both ciliated and non-ciliated cells. The nucleocapsid protein accumulated more on the apical side of the ciliated cells.
Infection location in respiratory tract
The authors also imaged the lower respiratory tract of the ferrets. They found some unspecified fluorescence signals in the lungs trachea tissues. Upon closer inspection, they found a 172 µm by 102 µm large infection spot hidden in the lung tissue airway.
Contrary to the infection spot in the ferret's nasal passage tissue, the infection was localized above the epithelial cell layer. These may be because of virus debris, which was likely inhaled from localized infection spots in the upper respiratory tract.
Previous studies on ferrets did not find any antigens in the lower respiratory tract, only a small amount of viral RNA. This suggests the SARS-CoV-2 preferentially infects the upper respiratory tract. But, there may also be some overlooked infection in the lower respiratory tract.
Contrary to infection in humans, where the infection is seen in both the upper and lower respiratory tract, infection in ferrets is mainly seen in the upper respiratory tract. These principles used in this study could be used for other animal models that more closely represent human infection patterns.
In a 200-mm3 section of the nasal passage tissue, the authors saw only four infected spots, three of which were at a maximum distance of 1.3 mm from each other. The limited degree is infection is interesting compared to the amounts of infectious virus that can be isolated from ferrets.
This observation may also be important when collecting samples from animal models. Nasal swabs may provide better results than nasal washes in ferrets.
However, more studies may be required to substantiate the clustering and focal patterns of the SARS-CoV-2 infection. The combination of confocal fluorescence microscopy and light-sheet fluorescence microscopy may allow in vivo studies of subcellular SARS-CoV-2 infection processes.

 This news article was a review of a preliminary scientific report that had not undergone peer-review at the time of publication. Since its initial publication, the scientific report has now been peer reviewed and accepted for publication in a Scientific Journal. Links to the preliminary and peer-reviewed reports are available in the Sources section at the bottom of this article. View Sources
Journal references:
- Preliminary scientific report.
Zaeck, L. M. et al. (2020) 3D reconstruction of SARS-CoV-2 infection in ferrets emphasizes focal infection pattern in the upper respiratory tract. bioRxiv. https://doi.org/10.1101/2020.10.17.339051, https://www.biorxiv.org/content/10.1101/2020.10.17.339051v1
- Peer reviewed and published scientific report.
Zaeck, Luca M., David Scheibner, Julia Sehl, Martin Müller, Donata Hoffmann, Martin Beer, Elsayed M. Abdelwhab, Thomas C. Mettenleiter, Angele Breithaupt, and Stefan Finke. 2021. “Light Sheet Microscopy-Assisted 3D Analysis of SARS-CoV-2 Infection in the Respiratory Tract of the Ferret Model.” Viruses 13 (3): 529. https://doi.org/10.3390/v13030529. https://www.mdpi.com/1999-4915/13/3/529.