Sponsored Content by SCIEXReviewed by Olivia FrostNov 4 2026
This article outlines the use of the novel novus V55 mass spectrometer in the application of EPA Method 1633A. Robust quantitative performance is demonstrated at the limit of quantitation (LOQ), with the majority of PFAS exhibiting ±10% accuracy on the quantifier ion and overall accuracies ranging from 80% to 129% (Figure 1).
LOQ ion ratios were also found to consistently meet the ±30% acceptance criteria defined in the EPA level 5 standard.
Method performance was further highlighted by the achievement of LLOPR recoveries (2x LOQ) ranging from 90% to 110% for the majority of analytes and precision values <20% CV, confidently within the criteria set by EPA 1633A quality control (QC).
Resolution of the bile acid interferences from PFOS was achieved by leveraging chromatographic separation using the Phenomenex Luna Omega PS C18 column. It was also possible to achieve sufficient retention and symmetrical peaks for early-eluting PFAS.
The method was also successfully applied to the analysis of real-world environmental water samples, highlighting its suitability for routine environmental workflows and monitoring applications.
Notable advantages of PFAS analysis using EPA Method 1633A with the SCIEX novus V55 system include:
- Good LOQ quantitative performance: Accuracies were typically within ±10% for the quantifier ion at the LOQ, ranging from 80% to 129% considering all PFAS. LOQ ion ratios were also determined to be within ±30% of the level 5 standard ion ratio.
- LLOPR recovery within EPA 1633A QC criteria: Method spikes at 2x LOQ reveal mean recovery from 90% to 110% for the majority of PFAS, with mean precision from 4.4% to 20%.
- Excellent chromatographic performance with the Phenomenex Luna Omega PS C18 column: The system delivers successful separation of bile acid interferences from PFOS and symmetrical peak shape and good retention for early eluting PFAS.
- Successful application to real-world environmental water samples: It successfully detects C5-C9 PFCAs and C4, C6, and C8 PFSAs in two monitoring wells and three groundwater samples, and detects PFBA and 6:2 FTS in monitoring well samples.
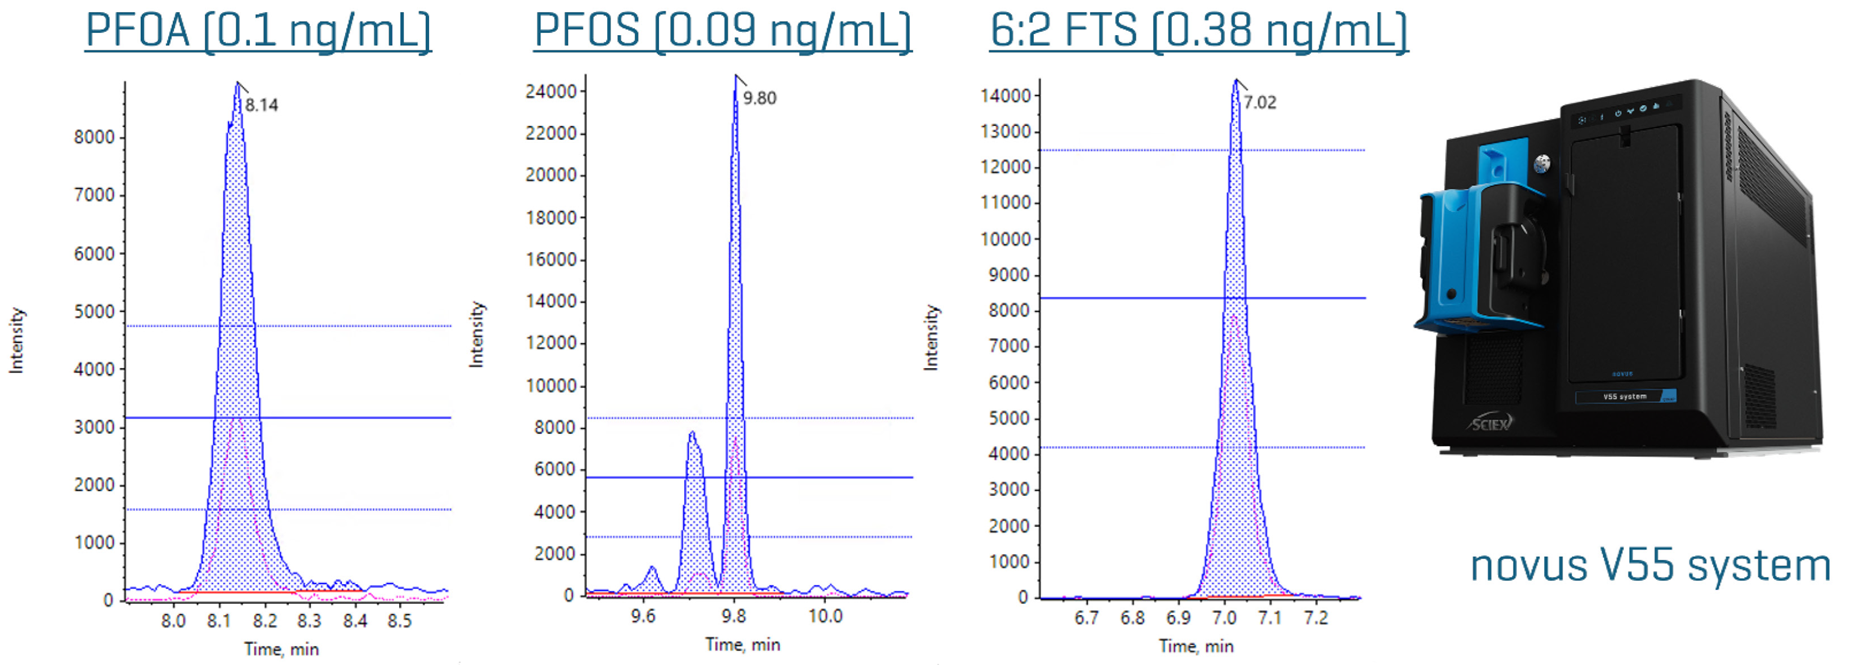
Figure 1. Extracted ion chromatograms (XICs) for PFOA (0.1 ng/mL), PFOS (0.09 ng/mL), and 6:2 FTS (0.38 ng/mL) in the LOQ calibration standard. Image Credit: SCIEX
The isotope dilution LC-MS/MS method, EPA Method 1633A, builds on existing EPA drinking water methods (Methods 533 and 537.1), extending their applicability to a wider range of environmental matrices, including solids, biosolids, non-potable water samples, and biological tissues.1,2
The method also expands the target compound list to accommodate perfluoroctane sulfonamides (FOSAs), long-chain perfluoro-substituted sulfonic acids (PFNS, PFDS, PFDoS), x:3 fluorotelomer carboxylic acids (FTCAs), and perfluoroctane sulfonamide ethanols (FOSEs).
Method 1633A differs from earlier EPA PFAS methods in that it mandates the acquisition of two fragment ions, where appropriate, offering overall data robustness and enhanced compound confirmation.
This article explores PFAS quantitation in environmental samples using EPA Method 1633A on the SCIEX novus V55 system.
The novus V55 system offers full triple-quadrupole quantitative performance in the most compact mass spectrometer in its class, which is 35% smaller than the SCIEX 5500+. The system’s improved energy efficiency reduces heat output and related lab cooling requirements by up to 40% versus the 5500+ system.
Experimental methods
Sample preparation
The full method is detailed in the EPA Method 1633A document.2
A clean sand-based matrix was used for the ongoing precision and recovery (OPR) samples. Samples were initially spiked with the EIS mixture before being extracted three times with 0.3% (v/v) methanolic ammonium hydroxide. Combined supernatants were then reduced under nitrogen gas, with interferences removed using WAX/GCB SPE cartridges.
The method was applied to a range of real-world aqueous samples, including monitoring groundwater, well water, and surface water.
Samples were spiked with the extracted internal standard (EIS) mixture for these aqueous matrices, normalizing the pH to 6.5 where required. The sample was then extracted by utilizing WAX/GCB solid phase extraction (SPE) cartridges.
WAX/GCB extraction and cleanup procedures for each sample matrix were performed using Phenomenex WAX/GCB stacked SPE cartridges (P/N: CSO-9207, 200 mg WAX/50 mg GCB, 6 mL).
Next, 1% (v/v) methanolic ammonium hydroxide was used to condition the cartridges, followed by 0.3 M formic acid. Cartridges were washed with water after sample loading, followed by 1:1 (v/v) 0.1 M formic acid/methanol. Cartridges were eluted with 1% (v/v) methanolic ammonium hydroxide. The final eluant was spiked with the non-extracted internal standard (NIS) mix.
Liquid chromatography
Chromatography was conducted on an ExionLC AE system with the Phenomenex Gemini C18 (50 x 3 mm, 3 μm, P/N: 00B-4439-Y0) and Phenomenex Luna Omega PS C18 (100 x 2.1 mm, 3 μm, P/N: 00D-4758-AN) as the delay and analytical columns, respectively.
The mobile phases were comprised of 95:5 (v/v) water/acetonitrile with 2 mM ammonium acetate (“A”) and acetonitrile (“B”).
The LC was controlled using the gradient program (Table 1) with a flow rate of 0.4 mL per minute and a total runtime of 18 minutes. The column oven was set to 40 °C, and the injection volume was 2 μL.
Table 1. Gradient program for the analysis of PFAS in aqueous, solid, biosolid, and tissue samples using EPA method 1633A with the novus V55 system. Source: SCIEX
| Time (min) |
Mobile phase A (%) |
Mobile phase B (%) |
| 0.0 |
98 |
2 |
| 0.2 |
98 |
2 |
| 1.0 |
75 |
25 |
| 7.2 |
65 |
35 |
| 9.0 |
25 |
75 |
| 12 |
5 |
95 |
| 13 |
5 |
95 |
| 13.1 |
98 |
2 |
| 18 |
98 |
2 |
Mass spectrometry
The novus V55 system with the OptiFlow source was used to analyze samples under negative mode electrospray ionization.
Data was captured using scheduled multiple reaction monitoring mode (sMRM). This involved two transitions per compound except for N-MeFOSE, N-EtFOSE, PFBA, PFMPA, and PFMBA. These compounds do not have stable secondary transitions, meaning they can be exempted by the EPA Method 1633A criteria. The target cycle time was 0.4 seconds.
Data analysis
The SCIEX OS software (version 5.0) was employed in both data acquisition and processing.
Table 2. Source and gas conditions for the analysis of PFAS in aqueous, solid, biosolid and tissue samples using EPA method 1633A with the novus V55 system. Source: SCIEX
| Parameter |
Value |
| Polarity |
Negative |
| Ion source gas 1 |
45 psi |
| Ion source gas 2 |
65 psi |
| Curtain gas |
45 psi |
| Source temperature |
400 °C |
| Ion spray voltage |
-3000 V |
| CAD gas |
10 |
Chromatographic separation of bile acid interferences
Taurodeoxycholic acid (TDCA), taurochenodeoxycholic acid (TCDCA), tauroursodeoxycholic acid (TUDCA), and other taurine-conjugated bile acids are known interferences for PFOS analysis in biological tissues.
These compounds have a Q1 precursor mass when analyzed using nominal-mass instrumentation. This precursor mass is indistinguishable from PFOS and shares the [SO3]- fragment ion with PFOS.
The [FSO3]- fragment is generally monitored to ensure good quantitation for PFOS and minimize false positives, but chromatographic separation is key to monitoring for ion-ratio tolerances and enabling confirmation using two MRM transitions.
The method’s combined use of optimized mobile phase composition, the Phenomenex Luna Omega PS C18 column, and gradient conditions was found to achieve excellent chromatographic resolution between PFOS and the taurocholic acids. TDCA was separated from PFOS by around 3.2 minutes using this approach (Figure 2).
TCDCA (RT = 4.3 minutes) and TUDCA (RT = 6.1 minutes) were also determined to be well resolved from PFOS, achieving adequate retention time differences for both confident detection and accurate quantitation.
The method performance was found to significantly exceed the EPA 1633A requirement for chromatographic separation of one minute.
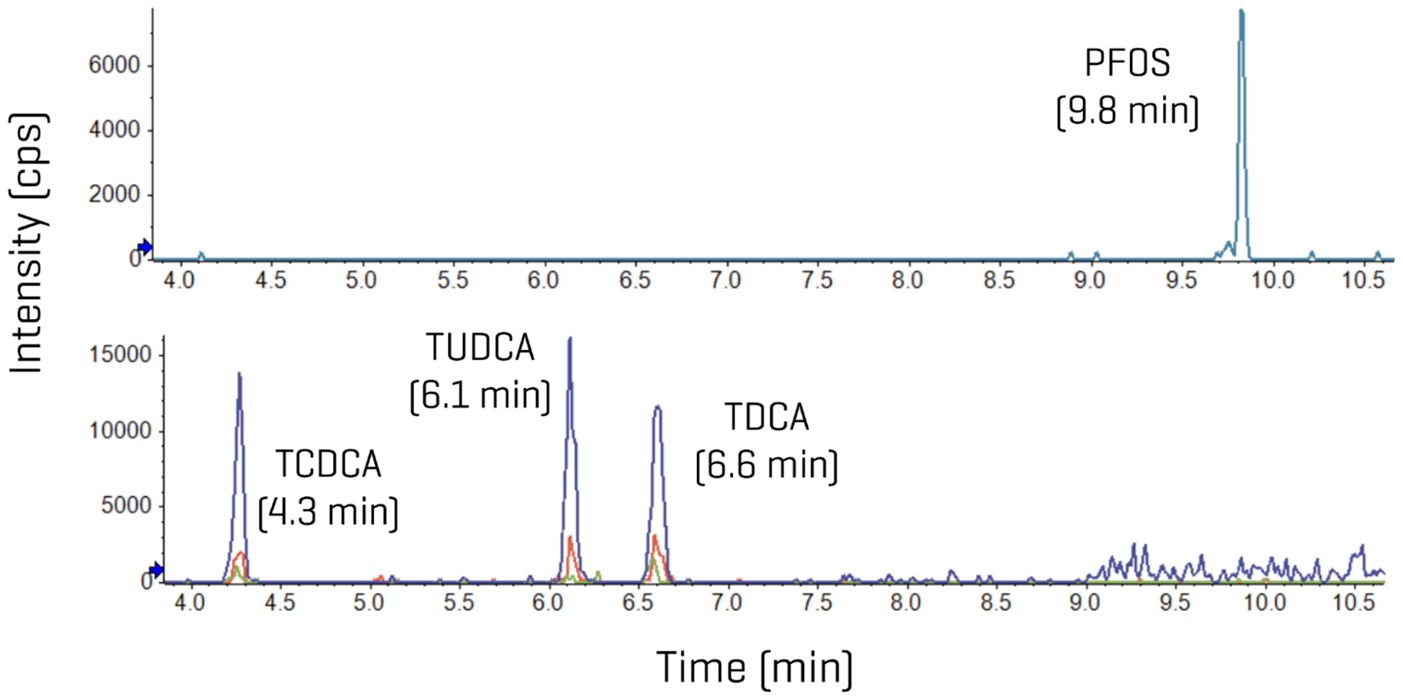
Figure 2. Extracted ion chromatograms (XICs) for PFOS (top panel) and TCDCA, TUDCA and TDCA (bottom panel) showing the chromatographic separation of taurocholic acid interferences from PFOS using the Phenomenex Luna Omega PS C18 column. PFOS is shown by the m/z 499 >99 transition; the bile acids are shown by the overlaid m/z 498 > 80, m/z 498.9 > 107, and m/z 498 > 124 transitions. Image Credit: SCIEX
Chromatographic retention and peak shape for early eluting PFAS
Early-eluting polar analytes typically exhibit poor chromatographic performance on traditional reversed-phase LC columns. This is evidenced by the presence of asymmetric or fronting peak shapes. This behavior risks compromising overall data quality and quantitative accuracy.
The Phenomenex Luna Omega PS C18 column’s positive surface charge characteristics and solvent vial composition were found to produce well-defined, symmetrical peaks using this method. Figure 3 shows extracted ion chromatograms for the early eluting compounds in the mid-level (L5) calibration standard, including 3:3 FTCA, PFBA, PFMPA, and PFPeA.
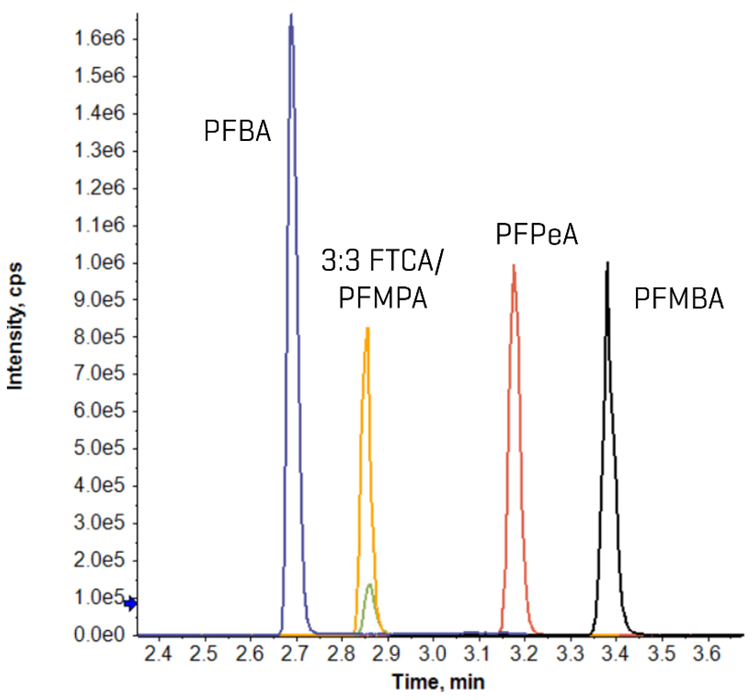
Figure 3. Overlaid XICs for PFBA, 3:3 FTCA, PFMPA, PFPeA, and PFMBA in the mid-level (L5) calibration standard showing good chromatographic retention and peak shape using the Phenomenex Luna Omega PS C18 column. Image Credit: SCIEX
Calibration standard performance: Sensitivity, accuracy, ion ratio, and linear dynamic range
The quantitative performance of the solvent-based calibration standards was found to exceed the EPA 1633A criteria (Table 3). Limits of quantitation (LOQs) for sulfonic acids (PFSAs), perfluoroalkyl carboxylic acids (PFCAs), sulfonamides, sulfonamide acids, and fluorinated ether acids ranged from around 0.1 to 0.4 ng/mL (in vial) across the different chain lengths.
The sulfonamide ethanols (N-MeFOSE and N-EtFOSE) and x:3 fluorotelomer carboxylic acids (FTCAs) exhibited reduced sensitivity in the ESI source, demonstrating higher LOQs from 1 ng/mL to 2.5 ng/mL.
The method successfully achieved LOQs around two times lower than the LOQs specified in EPA 1633A, highlighting the V55 system’s ability to exceed the sensitivity requirements of the method.
The LOQ for this method was defined as analytes demonstrating ±30% accuracy and the ion-ratio tolerance within ±30% of the level 5 calibration standard.
LOQ standard accuracies were typically within ±10%, ranging between 80% and 129% when taking into account the quantifier ion for all analytes (Table 3). LOQ ion ratios were also found to be within ±30% of the level 5 ion ratio, exceeding the ±50% criteria in EPA Method 1633A.
Ion ratios were not calculated for N-MeFOSE, N-EtFOSE, PFBA, PFPeA, PFMPA, and PFMBA because these analytes have a single stable MRM transition.
The calibration curve also showed three orders of linear dynamic range, except in the case of 9Cl-PF3ONS and 11Cl-PF3OUdS, which showed detector saturation in the high-level standard.
EPA Method 1633A specifies that it is not permitted to use the correlation coefficient (r) and coefficient of determination (r2) to confirm linearity; the relative standard deviation (RSD) of the response ratio must be ≤20% instead. All analytes met this criterion (Table 3).
Table 3. Quantitative performance of the solvent-based calibration standards showing the in-vial LOQ (ng/mL), accuracy (%) and ion ratio in the LOQ standard, ion ratio in the L5 calibration standard, calibration range and response ratio RSD (%). Results are shown for the quantifier ion. Source: SCIEX
| Compound |
LOQ (ng/mL),
in-vial |
Accuracy (%)
at LOQ |
Ion
ratio
at LOQ |
Ion ratio in L5
cal. std. |
Calibration
range (ng/mL) |
Response ratio
RSD (%) |
| PFBA |
0.4 |
102 |
n/a |
n/a |
0.2–200 |
8.0 |
| PFPeA |
0.2 |
104 |
n/a |
n/a |
0.1–100 |
7.9 |
| PFHxA |
0.1 |
107 |
11.9 |
15.9 |
0.05–50 |
9.6 |
| PFHpA |
0.1 |
104 |
2.6 |
2.8 |
0.05–50 |
6.0 |
| PFOA |
0.1 |
110 |
2.9 |
2.9 |
0.05–50 |
12 |
| PFNA |
0.1 |
118 |
2.3 |
2.1 |
0.05–50 |
9.6 |
| PFDA |
0.1 |
119 |
5.1 |
4.5 |
0.05–50 |
13 |
| PFUnA |
0.1 |
91.7 |
5.3 |
5.5 |
0.05–50 |
7.2 |
| PFDoA |
0.1 |
101 |
8.1 |
7.9 |
0.05–50 |
7.2 |
| PFTrDA |
0.1 |
67.2 |
6.3 |
6.5 |
0.05–50 |
20 |
| PFTeDA |
0.1 |
99.8 |
5.8 |
5.7 |
0.05–50 |
12 |
| PFBS |
0.09 |
108 |
2.8 |
2.9 |
0.044–44.4 |
9.5 |
| PFPeS |
0.09 |
109 |
4.0 |
3.8 |
0.047–47.0 |
7.1 |
| PFHxS |
0.09 |
102 |
3.3 |
3.1 |
0.046–45.6 |
16 |
| PFHpS |
0.1 |
101 |
4.2 |
3.5 |
0.048–47.6 |
7.2 |
| PFOS |
0.09 |
107 |
4.2 |
4.4 |
0.093–46.4 |
14 |
| PFNS |
0.1 |
111 |
3.9 |
3.9 |
0.048–48.0 |
8.1 |
| PFDS |
0.1 |
99.5 |
3.7 |
3.8 |
0.048–48.2 |
11 |
| PFDoS |
0.1 |
107 |
4.4 |
4.1 |
0.048–48.4 |
11 |
| 4:2 FTS |
0.38 |
104 |
2.0 |
1.9 |
0.19–188 |
13 |
| 6:2 FTS |
0.38 |
94.6 |
1.7 |
1.7 |
0.19–190 |
11 |
| 8:2 FTS |
0.38 |
92.0 |
1.4 |
1.4 |
0.19–192 |
12 |
| PFOSA |
0.1 |
118 |
32.3 |
47.6 |
0.05–50 |
6.6 |
| N-MeFOSA |
0.1 |
106 |
0.8 |
0.8 |
0.05–50 |
8.3 |
| N-EtFOSA |
0.1 |
113 |
0.8 |
0.8 |
0.05–50 |
9.4 |
| N-MeFOSAA |
0.1 |
126 |
1.5 |
1.8 |
0.05–50 |
21 |
| N-EtFOSAA |
0.1 |
99.5 |
1.3 |
1.3 |
0.05–50 |
11 |
| N-MeFOSE |
1 |
98.4 |
n/a |
n/a |
0.5–500 |
6.5 |
| N-EtFOSE |
1 |
111 |
n/a |
n/a |
0.5–500 |
10 |
| HFPO-DA |
0.4 |
102 |
3.5 |
3.0 |
0.2–200 |
9.3 |
| ADONA |
0.38 |
105 |
2.3 |
2.2 |
0.19–189 |
8.3 |
| PFMPA |
0.2 |
112 |
n/a |
n/a |
0.1–100 |
7.1 |
| PFMBA |
0.2 |
110 |
n/a |
n/a |
0.1–100 |
5.3 |
| NFDHA |
0.2 |
90.1 |
1.9 |
1.6 |
0.1–100 |
10 |
| 9Cl-PF3ONS |
0.37 |
74.7 |
3.2 |
3.1 |
0.19–93 |
18 |
| 11Cl-PF3OUdS |
0.38 |
84.7 |
3.0 |
3.2 |
0.19–94 |
20 |
| PFEESA |
0.18 |
102 |
12.2 |
12.2 |
0.089–89 |
12 |
| 3:3 FTCA |
0.5 |
111 |
1.5 |
1.6 |
0.25–250 |
6.7 |
| 5:3 FTCA |
2.5 |
114 |
1.1 |
1.0 |
1.25–1250 |
7.2 |
| 7:3 FTCA |
2.5 |
105 |
0.9 |
0.9 |
1.25–1250 |
9.2 |
Method performance evaluation: Blanks and ongoing precision and recovery samples (OPR)
Evaluations of quantitative performance were conducted using method blanks and OPR samples in a clean sand-based matrix.
These samples represent method spikes conducted at both the low-level (LLOPR), corresponding to 2× LOQ, and the mid-level, corresponding to 25× LOQ (n=7 per level).
The mean LLOPR recovery for the quantifier ion was primarily between 90% and 110% (Figure 4). Lower recovery of 78% was observed for 11Cl-PF3OUdS, with recoveries of 74% observed for 5:3 FTCA and 69% for 7:3 FTCA. These low recoveries were likely due to the lack of exact mass-labeled surrogates for these compounds.
EPA 1633A specifies flexible recovery acceptance limits, however, depending on the analyte and matrix. These limits range from 40% to 160%.
All analytes were determined to be well within the EPA 1663A recovery criteria for solid matrices, with the mean LLOPR precision of 4.4% to 20% also within the EPA criteria. Similar trends were noted in mid-level OPR samples.
The majority of analytes remained undetected in the method blanks (n=7). PFHxS and PFOS were exceptions, with area counts <1/3 of the L1 standard.
These results demonstrate that accurate, precise quantitative data for EPA Method 1633A is achievable using the sample preparation method and the novus V55 system, with low background contamination.
XICs for PFOA, HFPO-DA, and 6:2 FTS in a representative method blank and LLOPR sample are shown in Figure 5.
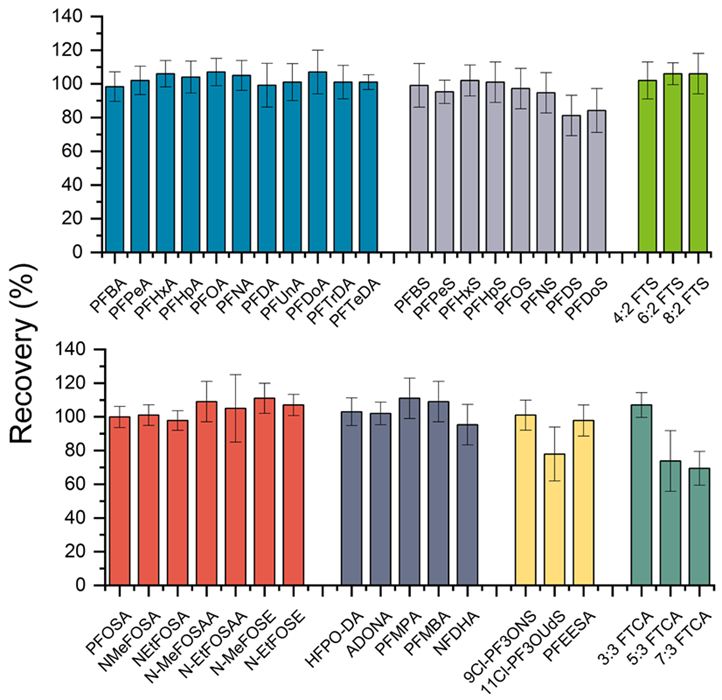
Figure 4. Mean recovery (%) and precision (%CV) for the LLOPR samples (n=7) in a clean sand-based matrix for the analysis of EPA Method 1633A using the novus V55 system. Results are shown for the quantifier ion transition. Image Credit: SCIEX
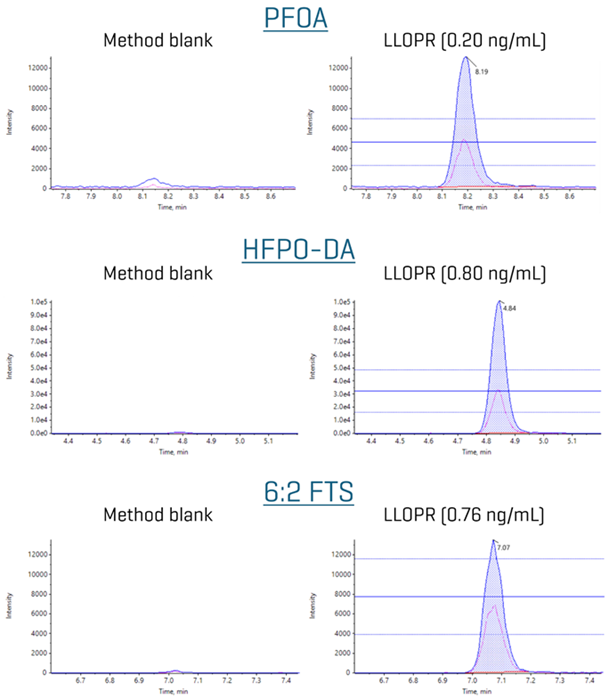
Figure 5. Extracted ion chromatograms (XICs) for PFOA, HFPO-DA and 6:2 FTS in the method blanks and LLOPR samples in a clean sand-based matrix using EPA Method 1633A on the novus V55 system. XICs show the quantified MRM (blue trace) and qualifier MRM (pink trace); dashed lines show the 50% ion-ratio tolerance lines. Image Credit: SCIEX
Application to real-world water samples
The EPA Method 1633A was applied to seven real-world water samples: three groundwater, three surface water, and two monitoring well samples. Only the C4–C9 PFCAs and C4, C6, and C8 PFSAs were detected in the three groundwater and two monitoring well samples (Table 4).
PFBA and the 6:2 FTS were also detected in the monitoring well samples. It should also be noted that in the three surface water samples, none of the targeted analytes were detected above the LOQ concentration.
The 4:2 and 8:2 FTS, fluorotelomer carboxylic acids, sulfonamidoacetic acids, perfluorooctane sulfonamides, sulfonamide ethanols, and ether carboxylic and sulfonic acids were not detected in any sample.
PFAS concentrations were typically higher in monitoring wells than in groundwater samples, with monitoring well #1 exhibiting the highest levels for most compounds. The PFAS profile within the monitoring well samples was dominated by PFHxA, PFPeA, and 6:2 FTS. PFAS patterns were found to be more uniform in the groundwater samples.
Figure 6 features quantifier XICs for PFPeA, PFHxA, PFBA, and PFHpA in the monitoring well #1 sample. The PFHxA and PFHpA XICs also display the qualifier MRMs (pink trace) and ±50% ion-ratio tolerance lines. A single transition was monitored for PFPeA and PFBA.
Table 4. PFAS concentrations (ng/L) in real-world water samples analyzed using EPA Method 1663A with the novus V55 system. Results are shown for the quantifier ion. “< MDL” refers to compounds that were detected above the LOQ but below the method detection limit. Source: SCIEX
| Compound |
Monitoring well #1 |
Monitoring well #2 |
Ground water #1 |
Ground water #2 |
Ground water #3 |
| PFBA |
35 |
9.1 |
<MDL |
<MDL |
<MDL |
| PFPeA |
144 |
32 |
6.3 |
7.4 |
10.6 |
| PFHxA |
80 |
17 |
5.4 |
5.0 |
9.4 |
| PFHpA |
28 |
5.5 |
3.0 |
2.9 |
3.9 |
| PFOA |
33 |
6.5 |
8.4 |
13.0 |
13.2 |
| PFNA |
2.5 |
<MDL |
1.3 |
<MDL |
<MDL |
| PFBS |
6.5 |
3.7 |
10 |
4.3 |
4.5 |
| PFHxS |
48 |
3.0 |
4.2 |
2.3 |
2.1 |
| PFOS |
50 |
7.4 |
8.2 |
7.1 |
5.9 |
| 6:2 FTS |
124 |
40 |
<MDL |
<MDL |
<MDL |
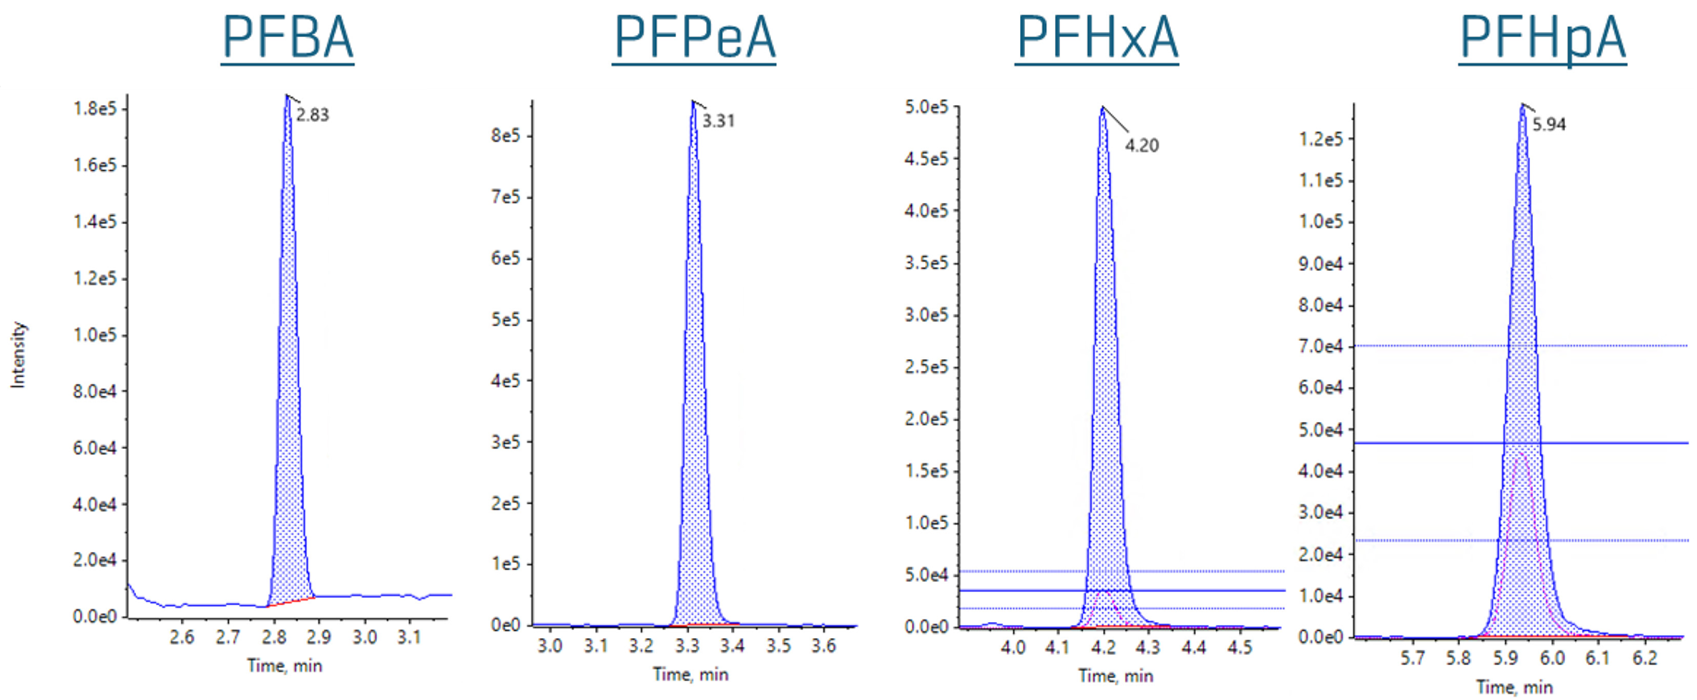
Figure 6. XICs for PFBA, PFPeA, PFHxA, and PFHpA in the monitoring well #1 sample analyzed using EPA Method 1633A with the novus V55 system. The quantifier MRM is shown for all compounds. The PFHxA and PFHpA XICs show the qualifier MRM (pink trace) and 50% ion-ratio tolerance lines. Image Credit: SCIEX
Conclusions
This article explored the application of EPA Method 1633A to the novus V55 mass spectrometer system. This system was able to achieve a range of QC criteria, including:
- Good quantitative sensitivity, with calibration standard LOQ accuracies typically found to be within ±10% for quantifier ions
- Full compliance with EPA Method 1633A ion-ratio criteria across the entire PFAS panel
- Excellent low-level method performance, with LLOPR recoveries surpassing EPA QC criteria
- Good precision when analyzing method spikes at 2x LOQ
Chromatographic performance was also excellent using the Phenomenex Luna Omega PS C18 column, with well-retained, symmetrical peaks for early-eluting PFAS and effective separation of PFOS from bile acid interferences.
Successful application to real-world environmental water samples was also demonstrated, with detection of multiple PFSAs, PFCAs, and the 6:2 FTS achieved in groundwater and monitoring well samples.
References and further reading
- Rosenblum, A. and S.C. Wendelken. (2019). Method 533: Determination of per- and polyfluoroalkyl substances in drinking water by isotope dilution anion exchange solid phase extraction and liquid chromatography/tandem mass spectrometry. [Analytical method] U.S. Environmental Protection Agency (EPA). Available at: https://www.epa.gov/sites/production/files/2019-12/documents/method-533-815b19020.pdf.
- U.S. Environmental Protection Agency (EPA). Method 1633, revision a analysis of per-and polyfluoroalkyl substances (PFAS) in aqueous, solid, biosolids, and tissue samples by LC-MS/MS. (2024). Available at: https://www.epa.gov/system/files/documents/2024-12/method-1633a-december-5-2024-508-compliant.pdf.
Acknowledgments
Produced from materials originally authored by Craig M. Butt, Holly Lee, Phil Bassignani, and Nathan Sorelle from ABB Sciex.
About SCIEX
SCIEX mission is to deliver solutions for the precision detection and quantitation of molecules, empowering their customers to protect and advance the wellness and safety of all.
SCIEX has led the field of mass spectrometry for 50 years. From the moment we launched the first ever commercially successful triple quad in 1981, they have developed groundbreaking technologies and solutions that influence life-changing research and outcomes.
Today, as part of the Danaher family of global life science and technology innovators, they continue to pioneer robust solutions in mass spectrometry and capillary electrophoresis. But they don’t just develop products. It is what they do together with their customers that sets them apart. That’s why thousands of life science experts around the world choose SCIEX to get the answers they can trust to better inform critical decisions. Decisions that positively impact lives.
They proudly stand behind our tagline: The Power of Precision.
Sponsored Content Policy: News-Medical.net publishes articles and related content that may be derived from sources where we have existing commercial relationships, provided such content adds value to the core editorial ethos of News-Medical.net, which is to educate and inform site visitors interested in medical research, science, medical devices and treatments.