The huge challenge often faced by modern-day plant and food metabolomics scientists is to determine the structure of secondary metabolites. An important step in the biological interpretation of changes observed in metabolite profiles is to identify the compounds of interest.
Moreover, it is essential to rapidly tag the compounds that have been characterized earlier. Considerable time is saved by this so-called de-replication process, which might otherwise be wasted in repeatedly annotating already known compounds.
| Keywords |
Technology and Software |
| Metabolomics |
impact II |
| Structure elucidation |
MetaboScape |
| Structure confirmation |
CompoundCrawler |
| in-silico fragmentation |
SmartFormula3D |
| Library search |
MetFrag |
| de-replication |
|
| unknown ID |
|
| Food |
|
| Profiling |
|
In this study, a part of the data obtained for the showcase study of the “Metabolomics 2015 - 11th International Conference of the Metabolomics Society” organized by the local conference hosts based at the University of California, Davis has been re-evaluated.
Three different food plates were prepared by performing choices based on large differences in dietary components, representing a California food plate (based on USDA MyPlate dietary recommendations), a fast food meal (coined “USA” food plate), and a “Davis” food plate, inspired by Korean cuisine. In 2015, Bruker Daltonics used complementary methods such as high-resolution accurate mass LC-QTOF-MS/MS and GC-APCI-QTOF-MS/MS for performing a comprehensive analysis of food metabolites and natural products contained in the three different food plates. The main focus of data evaluation was to identify and annotate characteristic, that is, differentiating, small molecules contained in the food samples.
In this study, the data obtained through LC-QTOF-MS/MS in ESI positive ionization mode were re-investigated and presented in the MetaboScape 2.0 software solution, enabling the identification of natural products. Then, the information can be used to develop thoroughly characterized MS/MS libraries, facilitating a rapid de-replication for known compounds. The MetaboScape software has the ability to overcome difficulties in identifying unknowns and allows confident assignment of known target compounds, both of which are crucial steps in converting raw MS data into knowledge.
Experiment
Organizers of the Metabolomics 2015 showcase study reported that an industrial-grade food service blender was used for homogenizing the food plates, which were then lyophilized under vacuum (except for volatile profiling) and stored in a −80 °C freezer before being shipped.
In the Bruker Daltonics lab, three replicates of USA, California, and Davis food plate samples were dissolved in 100-µL of 80% methanol. Analyses of 5 µL of each sample were performed in two technical replicates, each using UHPLC-QTOF-MS/MS, leading to 18 runs in total, except for quality control and blank samples.
A Dionex RSLC system (Thermo Fisher Scientific) with a 100 x 2 mm Acclaim RSLC 120 C18 column was used to perform chromatographic separation, at a 0.3 mL/minute flow rate, Solvent A: Water + 0.1% HCOOH, Solvent B: Acetonitrile + 0.1% HCOOH, at the following gradient: 0–2 minutes 1% B; 2–17 minutes linear gradient from 1% to 99% B; 17–20 minutes 99% B; 20.1 minutes 1% B, total run time of 30 minutes. A Bruker impact II Qq-TOF mass spectrometer was employed for carrying out MS detection. In order to obtain full scan MS and MS/MS data with the help of the InstantExpertiseTM routine, the instrument was run in ESI positive mode.
The FindMolecularFeatures (FMF) algorithm was used for processing the resulting data, which was then clustered in a bucket table using the ProfileAnalysis 2.3 software. Tools incorporated in the MetaboScape 2.0 software were used for carrying out subsequent data analysis and compound identification workflow: Combined assessment of isotopic patterns, mass accuracy, fragment information, and adduct was performed using the SmartFormula3D software™ to perform automatic molecular formula determination. The same data were used for achieving statistical data evaluation as well as structure identification including MetFrag-based in-silico fragmentation. The spectral Library Editor provided in MetaboScape 2.0 was used for the storage of MS/MS spectra of confirmed compounds.
Results
Data Pre-Processing for Statistical Analysis
In the non-targeted metabolomics workflow described in this article, a crucial initial step in performing data pre-processing before statistical analysis was the detection of compounds using the FindMolecularFeatures (FMF) peak finder. The FMF algorithm combines ions that belong to one compound such as isotopes, common adducts (for example, +K, +Na, +NH4), charge states, and fragments that originate from neutral losses to a single FMF compound. As part of a further bucketing process, the features extracted from the different samples were aligned over all samples and integrated into a so-called bucket table.
In this article, a bucket table including 18 samples from the USA, California, and Davis food plates was calculated, and in total, 1163 features were assigned through all the samples. Once the bucket table is imported to the client-server-based MetaboScape 2.0 software, an automated assignment of high-resolution accurate mass (HRAM) MS/MS spectra to the corresponding buckets facilitated subsequent confident de-replication of known compounds and elucidation of the structure of unknown compounds.
Confident, Automatic De-Replication
The extracted features information contained in the bucket table included accurate mass, retention time, and isotopic pattern (TIPTM - True Isotopic Pattern) of precursor and fragment spectra; thus, compounds could be automatically annotated at different confidence levels:
- The use of a custom “Analyte List” allowed confident annotation of the compounds in the bucket table. This list of known target compounds included name of the metabolite, molecular formula, information related to the retention time obtained from the applied C18 reversed phase chromatography, and MS/MS library spectra. The confidence level for each annotation could be readily derived using the graphical Annotation Quality “AQ” representation (
 ), based on user-definable levels for matching of retention time, accurate mass, MS/MS library score, and isotopic fidelity (Figure 1).
- Buckets that were not annotated with the Analyte List were queried against two complementary MS/MS spectral libraries: The “Bruker MetaboBASE Personal Library” and the “Bruker HMDB Metabolite Library.” This enabled the features to be assigned based on spectral similarity. As retention time information is not assessed for this workflow, compound identification is regarded to be “tentative.”
- Molecular formulas were automatically computed by the SmartFormula3D software for those buckets that were not annotated using the first two strategies. The algorithm used takes isotopic pattern information in MS and MS/MS spectra and accurate mass into consideration. Moreover, information from neutral losses and adducts, and also from additional filters for elemental compositions,[2, 3] were used to minimize the list of conceivable molecular formulas for biologically relevant candidates.
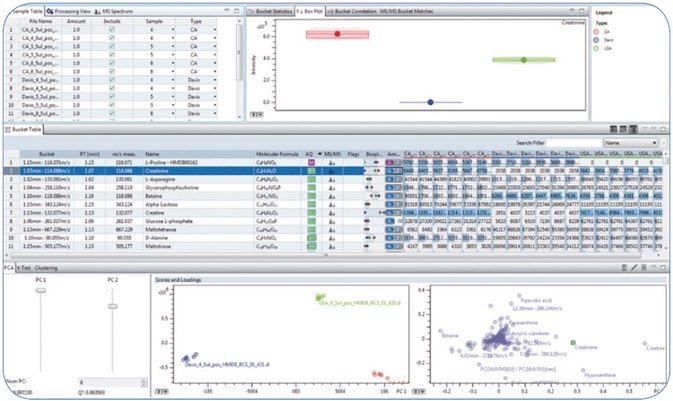
Figure 1. Overview perspective in MetaboScape 2.0
Identification of Soyasaponin I as a Characteristic Compound for “Davis” Samples - SmartFormula3D, CompoundCrawler, and In-Silico Fragmentation with MetFrag
Following statistical evaluation using PCA and ANOVA in MetaboScape software, it was found that a characteristic compound with 943.525 m/z eluting at 10.86 minutes was considerably more abundant in “Davis” food platter samples than the “CA” and “USA” samples (Figure 2). This compound, which was not annotated through the MS/MS spectral library query or by the Analyte List, was selected for further characterization owing to its relevance as a differentiating feature. The correct molecular formula was the first critical information that enabled the identification of this metabolite.
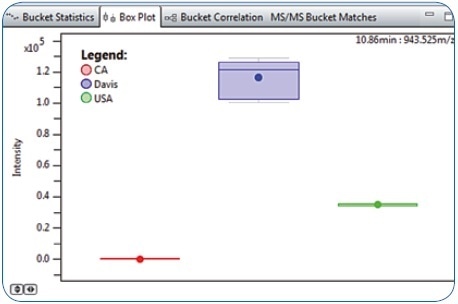
Figure 2. Box Plot representation for Bucket 10.86 minutes: 943.525 m/z revealing higher abundance in Davis compared to CA and USA food platter samples.
Through an evaluation using the SmartFormula 3D software, the molecular formula C48H78O19 could be readily assigned to the precursor with high confidence (Figure 3), with an mSigma value of 2.71 and a mass accuracy of 0.94 ppm for the [M + H]+ (the mSigma value is inversely proportional to the fit between simulated and measured isotopic pattern; scale ranges from 0 to 1000). Moreover, the [M + Na]+ adduct included in the extracted feature signaled to this molecular formula comprising of just the C, H, and O atoms.
Further confidence in this molecular formula was extracted from 80 MS/MS fragment peaks, for which it was possible to assign formulas, covering 92% of the fragment peak intensity.
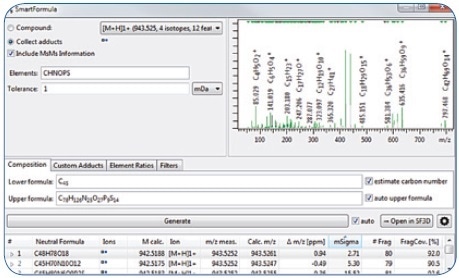
Figure 3. Assignment of elemental composition via SmartFormula3D.
It is possible to derive dozens of candidate formulas in a mass accuracy window of 1 mDa, on the basis of the precursor m/z information. Apart from mass accuracy, SmartFormula3D took the MS/MS fragment information and True Isotopic Pattern into account and returned the molecular formula C48H78O18 as the most probable candidate. Confidence in this outcome is not just predicated on the 0.94 ppm mass accuracy and outstanding isotopic pattern fit (2.71 mSigma value), it is also supported by 80 fragment ions, forming 92% of the MS/MS spectral intensity, where it is possible to assign an unambiguous molecular formula for each of these.
While exploring public databases for this molecular formula using the integrated CompoundCrawler software functionality, multiple hits for possible structures were obtained. Soyasaponin I was presented as the compound with the ideal MetFrag score following in-silico fragmentation of the chosen candidates using the fully integrated MetFrag algorithm (Figure 4A). This structural hypothesis is confirmed by the characteristic aglycon fragment with 441.373 m/z highlighted in Figure 4A as well as additional in-silico generated structures (Figure 4B) that match the measured fragment ion peaks.
![(A) Searching online compound databases with CompoundCrawler for C48H78O18 returned multiple candidate structures from the online compound databases. In-silico fragmentation of selected candidates using the MetFrag[1] algorithm generated scores for the likelihood of the structures to match the MS/MS fragment peaks. The best candidate molecule was Soyasaponin I. The characteristic aglycon fragment with 441.373 m/z highlighted on the Soyasaponin I molecule substantiated this structural hyposesis.](https://www.news-medical.net/image-handler/picture/2019/3/Job_6039_Art8_Pic5.jpg)
Figure 4. (A) Searching online compound databases with CompoundCrawler for C48H78O18 returned multiple candidate structures from the online compound databases. In-silico fragmentation of selected candidates using the MetFrag[1] algorithm generated scores for the likelihood of the structures to match the MS/MS fragment peaks. The best candidate molecule was Soyasaponin I. The characteristic aglycon fragment with 441.373 m/z highlighted on the Soyasaponin I molecule substantiated this structural hyposesis.
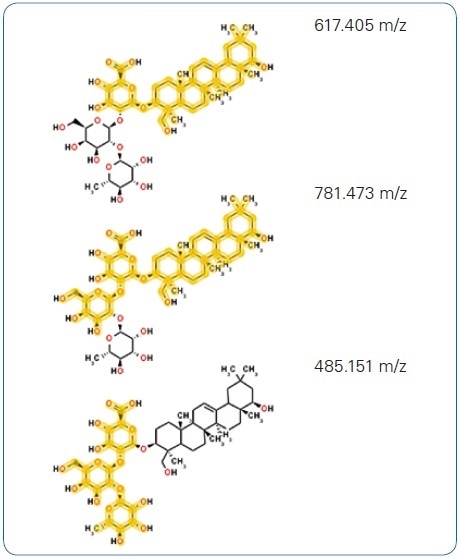
Figure 4. (B) Further, in-silico generated fragment structures matching measured fragment ion peaks added to the annotation confidence.
Confirmation of Soyasaponin I with a Reference Standard
In order to confirm the identity of the compound, the reference standard of Soyasaponin I can be measured and MS/MS spectra and retention time can be compared (Figure 5A and 5B). Data for the reference compound were obtained about 12 months following the analysis of the original showcase samples by employing the same general setup, and not the identical LC-MS/MS system.
By re-dissolving a replicate of a Davis sample that was not analyzed in the initial study and analyzing it on the new setup, the reproducibility and transferability from one setup to another were demonstrated. The MS/MS spectra and retention time of the candidate bucket obtained in 2015 were found to match with the data obtained in 2016 (Figure 5B and 5C).
Due to the fact that the Davis food platter was based on Korean cuisine, the Soyasaponin I identification is in accordance with the “biological” context: The organizers of the showcase sample revealed that the Davis food platter included bean sprouts and those were reported to contain Soyasaponin I even earlier.[4]
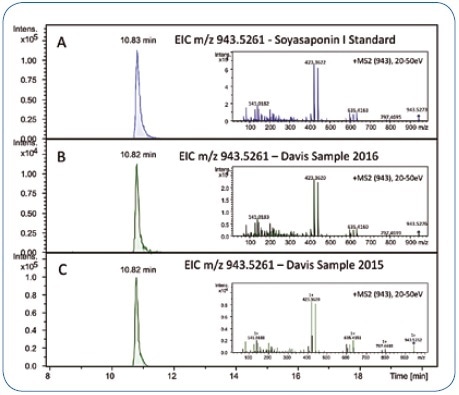
Figure 5. Retention time and MS/MS spectrum of the Soyasaponin I reference standard (A) match the chromatographic signal in the Davis food study samples reanalyzed in 2016 (B) and the corresponding data acquired in 2015 (approximately 12 months before) (C).
Identification of Further Soyasaponins by MS/MS Spectral Similarity Search
Apart from Soyasaponin I, various other soyasaponins have been reported in black beans.[4] Due to the fact that chemically related compounds usually exhibit similar MS/MS fragmentation patterns, an MS/MS spectral similarity search was carried out with the purpose of finding out further soyasaponins within the existing data set.
The result of an MS/MS similarity match between the identified Soyasaponin I’s MS/MS spectrum and all the other MS/MS spectra of buckets included in the bucket table is illustrated in Figure 6. Much like a characteristic MS/MS spectral library query, a matching score is calculated by comparing a query spectrum with other MS/MS spectra. The similarity matching differs by the fact that the MS/MS query spectra are not matched against a spectral library of known compounds; rather, they are matched against other MS/MS spectra included in the same bucket table.
The result returned was two buckets with similar MS/MS spectra - 11.16 minutes: 797.468 m/z with a score of 899; and 10.69 minutes: 959.520 m/z with a score of 917. Performing the same workflow as reported for Soyasaponin I - generating molecular formula, performing database searches for candidate structures, and carrying out in-silico fragmentation - led to the tentative identification of Soyasaponin III and Soyasaponin V.
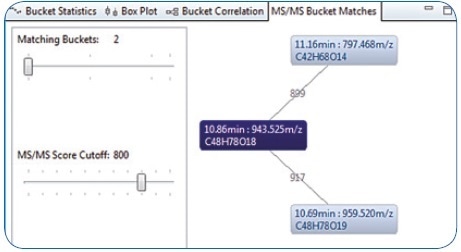
Figure 6. MS/MS Bucket matches: Three connected buckets based on similar HRAM MS/MS spectra - the similarity indicates these analytes to be related to Soyasaponin.
Conclusions
The Full Sensitivity Resolution (FSR) mode of the Bruker impact II series of Q-TOF MS instruments offers an unwavering combination of dynamic range, mass accuracy, sensitivity, isotopic fidelity, MS/MS performance, and resolution - an important prerequisite for the analysis of extremely complex samples. A confident and automated de-replication of known target compounds could be performed based on quantifiable confidence levels for isotopic fidelity, mass accuracy, MS/MS score, and retention time by making full use of this high-quality data through the innovative MetaboScape 2.0 software.
Moreover, SmartFormula 3DTM and MetFrag software - the combined structure elucidation solutions - allowed a secondary metabolite with m/z > 900 to be identified as a typical compound for the Davis food platter samples.
Specifically, successful identification of Soyasaponin I was achieved by unambiguously assigning the molecular formula to the precursor ion and then performing in-silico fragmentation of a candidate structure acquired from public database queries. The Davis food platter sample, based on Korean cuisine, included bean sprouts, apart from other ingredients, which are known to include soyasaponins as the predominant saponin.
The tentative annotation of two additional Soyasaponins - Soyasaponin III and Soyasaponin V - was enabled by a subsequent search for MS/MS spectral similarity. It is now possible to add these three target compounds to a custom MS/MS library in the MetaboScape software, thus widening the list of “known knowns,” and along with an expanded Analyte List, it would be possible to rapidly identify these compounds in other metabolite extracts.
Acknowledgments
Produced from materials originally authored by Frederik Walter, Marcus Persicke, Jörn Kalinowski from Bielefeld University, Bielefeld, Germany and Nikolas Kessler, Stephan Mävers, Matthias Szesny, Aiko Barsch, Heiko Neuweger from Bruker Daltonics, 28359 Bremen, Germany
Food study samples were provided by Arpana Vaniya (Fiehn laboratory) from University of California Davis and Nancy Keim (USDA team at Davis, California) as part of the Metabolomics 2015 conference show case study. Bruker also thanks Steffen Neumann and his team at the IPB in Halle, Germany for helpful discussions and for providing the source code of the MetFrag algorithm.
References
- Wolf et al. BMC Bioinformatics 2010, 11:148.
- Kind T. and Fiehn O. BMC Bioinformatics. 2007, 8:105.
- Kessler, N. et al. PLOS One 2014 26; 9(11):e113909.
- Lee MR et al. J Mass Spectrom. 1999 34(8):804-12.
About Bruker Daltonics
Empowering Science – Improving Life
Bruker Daltonics delivers cutting-edge mass spectrometry solutions and workflows that help scientists and industry leaders tackle real-world challenges and make new discoveries. From life sciences and pharmaceutical research to food and contaminant analysis, environmental monitoring, forensics, and industrial quality control, our technologies and instruments provide the precision and reliability you need to make confident decisions.
Our innovative platforms - such as timsTOF, scimaX, neofleX, and DART-TQ - combined with advanced software like SCiLS™ Lab, MetaboScape®, and Biopharma Compass®, transform complex data into actionable insights. Breakthrough innovations like Trapped Ion Mobility (TIMS), Omnitrap®, and dual ionization GC-HRMS are redefining what’s possible in mass spectrometry.
Trusted by leading research institutes, universities, government agencies, and industrial partners worldwide, Bruker Daltonics is committed to driving scientific progress and delivering solutions that matter.
(For Research Use Only. Not for use in clinical diagnostic procedures).
Sponsored Content Policy: News-Medical.net publishes articles and related content that may be derived from sources where we have existing commercial relationships, provided such content adds value to the core editorial ethos of News-Medical.net, which is to educate and inform site visitors interested in medical research, science, medical devices and treatments.