The inimitable adaptability of MALDI-TOF/TOF systems enables tissue imaging of intact proteins, as well as of tryptic peptides brought about by on-tissue digestion.
Although intact protein imaging can offer data on the diverse nature of proteoforms, the on-tissue digestion technique enjoys the advantages of the considerably greater mass resolution and accuracy that can be attained for tryptic peptides in reflector operation mode, in addition to the added specificity delivered by MS/MS analysis.
There has been a recent surge of interest in MALDI mass spectrometry imaging (MSI) across the field of clinical research, compelled by MALDI-TOF/TOF systems which deliver an unparalleled level of adaptability in relation to tissue imaging applications.
MALDI-TOF mass spectrometers are fundamentally capable of analyzing ions over a broad m/z range and, thus, facilitate imaging of a broad range of molecules, extending from small drug compounds up to intact proteins of ca. 20-25 kDa.
MALDI-MSI has been proven to be proficient in the differentiation of subtypes of tissues, such as tissues representative of different stages of cancer, through the evaluation of their particular protein signatures [1].
MALDI-MSI of proteins can be carried out with a variety of methods. The study of intact proteins can uncover the spatial distribution of individual proteoforms, for example, of specific modification states that could be related to particular biological pathways.
To illustrate, histones are recognized as appearing in numerous, differentially regulated levels of site-specific methylation and acetylation, generally known as the “histone code.” Lahiri et al. neatly demonstrated the ability of MALDI-TOF imaging as a way to examine the spatial distribution of histones in rodent brains [2].
Bottom-up imaging of tryptic peptides collected from on-tissue digested proteins works well alongside intact protein imaging in the sense that it can offer access to proteins of greater size that may be troublesome to detect in intact form.
Furthermore, analysis of digested peptides enjoys the advantages of the considerably greater mass resolution and precision at which peptides can be studied in reflector MALDI-TOF operation mode.
Lastly, on-tissue MS/MS can offer greater specificity in peptide imaging. This study highlights these capacities of MALDI imaging for proteins in fresh-frozen mouse brain tissue, using both the top-down and bottom-up workflows.
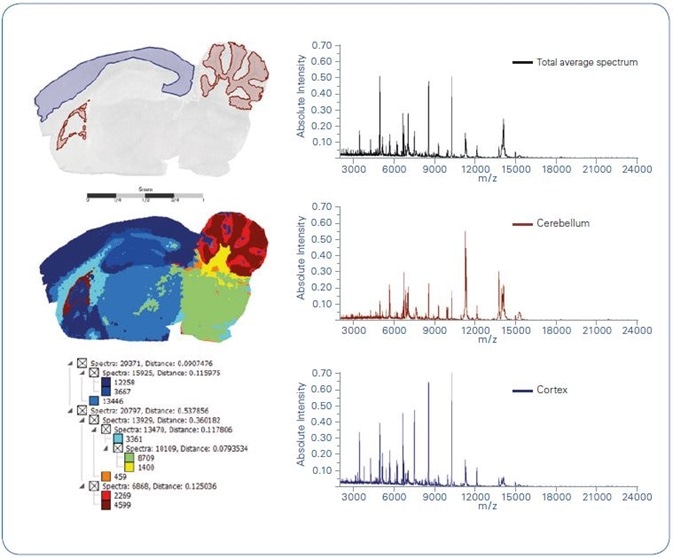
Figure 1. Spatial segmentation of intact protein MALDI imaging data acquired from a sagittal mouse brain section. Left-hand side: Optical image overlayed with 2 distinct regions as obtained from spatial segmentation (top); segmentation map (center); segmentation tree (bottom). Right-hand side: Average spectra representing total measurement region (top), cerebellum (center) and cortex (bottom) as yielded by spatial segmentation
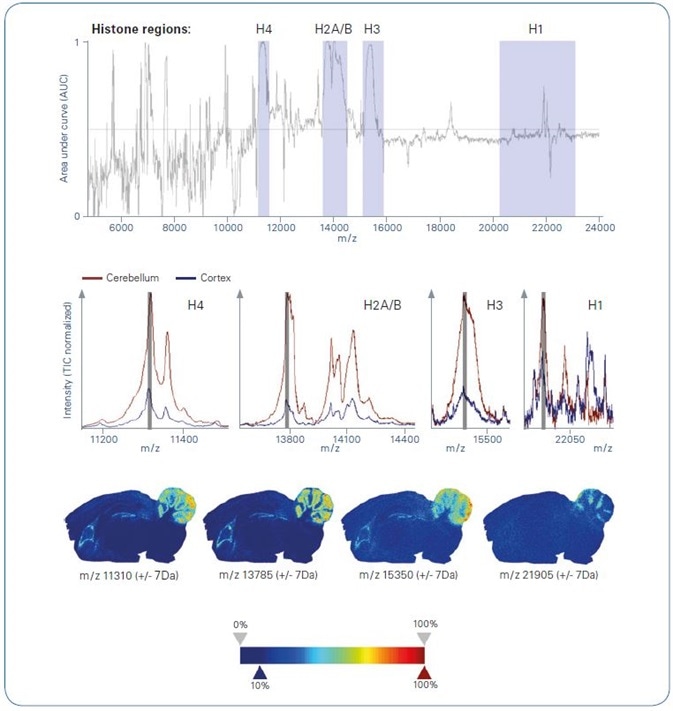
Figure 2. ROC analysis of intact protein MALDI imaging data , comparing cerebellum with cortex as obtained from segmentation analysis. Top: ROC plot. Grey-colored m/z ranges indicate histone regions; Center: Overlayed average spectra representing cerebellum (brown) and cortex (blue) zoomed into histone-specific m/z regions; Bottom: Ion images of example m/z features representing various histone m/z region
Experimental
Samples
Sagittal segments of fresh-frozen mouse brain tissue (10 µm thickness) were produced using a Leica CM 1900 UV cryotome. Segments were thaw-mounted on Bruker conductive slides and dehydrated further under vacuum for 30 minutes. Slides for intact protein analysis were pre-coated with polylysine before mounting tissue sections.
Sample Preparation
Intact Protein Analysis
Each slide-mounted tissue section was washed, according to the Carnoy protocol. This consisted of the following steps: 70% ethanol (30 s); 100% ethanol (30 s); Carnoy buffer (ethanol : chloroform : acetic acid 6:3:1; 2 min); 100% ethanol (30 s); 0.2% TFA in water (30 s); 100% ethanol (30 s).
Washed sections were then dehydrated under vacuum for 30 minutes.
Deposition of MALDI matrix sinapinic acid (SA) was carried out with the use of a HTX TM-sprayer (HTX Technologies, LLC) linked to an isocratic LC pump, applying the below technique parameters:
SA solution 10 mg/ml in ACN:H2 O 50:50, 0.1% TFA; nozzle height 40 mm; nitrogen pressure 10 psi; nozzle temperature 75 °C; flow rate 0.15 ml/min; z-arm velocity 1,000 mm/min; number of passes 6; moving pattern HH; track spacing 2 mm; drying time 0 s.
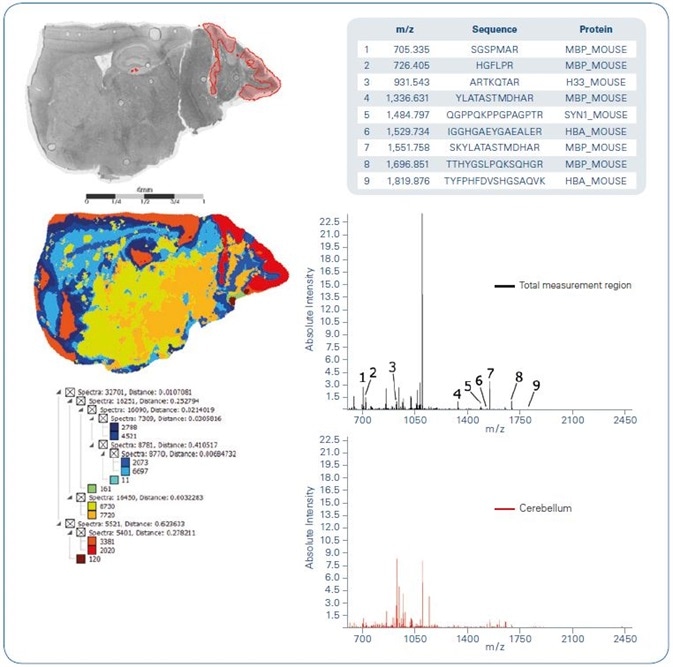
Figure 3. Spatial segmentation of tryptic on-tissue digest MALDI imaging data obtained from a sagittal mouse brain section. Left-hand side: Optical image overlayed with cerebellum region extracted from segmentation result (top); segmentation map (center); segmentation tree (bottom). Right-hand side: Average spectra representing total measurement region (top) and cerebellum as yielded from segmentation (bottom). Inset lists peptides that were identified by MS/MS from tissue directly.
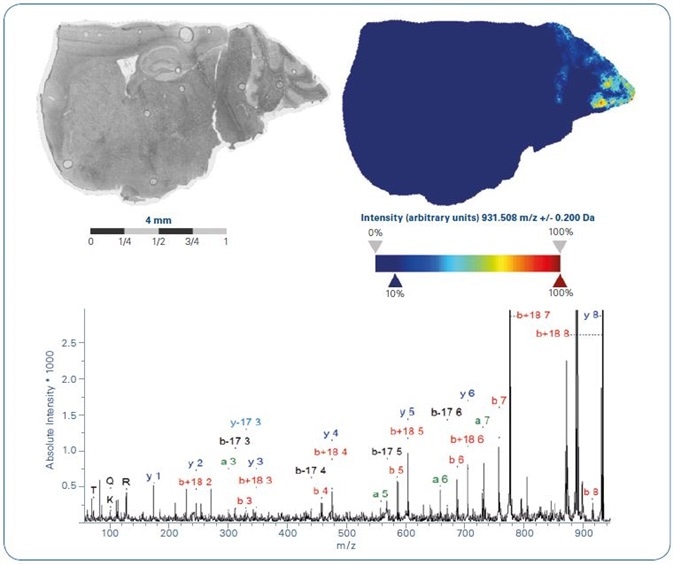
Figure 4. MALDI-MS ion image of tryptic peptide m/z 931.5 +/- 0.2Da (top). MALDI-MS/MS acquired from tissue directly from the region of highest local abundance allowed to identify peptide sequence ARTKQTAR from Histone 3.3 (bottom).
On-Tissue Tryptic Digestion
Deposition of trypsin (porcine sequencing grade; Promega) was carried out with a HTX TM-sprayer linked to a syringe pump for enzyme supply.
The deposition technique applied the following parameters: trypsin solution 25 ng/µl in 20 mM ammonium bicarbonate buffer; nozzle height 40 mm; nitrogen pressure 10 psi; nozzle temperature 30 °C; flow rate 0.03 ml/min; z-arm velocity 750 mm/min; number of passes 8; moving pattern CC; track spacing 2 mm; drying time 0 s.
Sections treated with trypsin were incubated for 2 hours at 50 °C under humidity saturated atmosphere. Following incubation, slides were dehydrated under vacuum for 30 minutes.
Deposition of HCCA matrix was carried on a HTX TM-sprayer linked to an isocratic LC pump with the following technique parameters:
HCCA solution 10 mg/ml in ACN:H2O 70:30, 1% TFA; nozzle height 40 mm; nitrogen pressure 10 psi; nozzle temperature 75 °C; flow rate 0.12 ml/min; z-arm velocity 1200 mm/min; number of passes 4; moving pattern HH; track spacing 3 mm; drying time 0 s.
Data Acquisition
Optical Images
Cleansed tissue sections, mounted on slides, were scanned using a Reflecta MF-5000 medium format slide scanner at a resolution of 3,200 dpi before applying matrix.
MALDI-MS Imaging
All MALDI-MS imaging data was collected using a Bruker rapifleX TOF/TOF system. Intact protein spectra from m/z 2,000 up to m/z 24,000 were gathered in positive linear TOF mode.
A pixel size of 30 µm, devoid of oversampling, was achieved by running the smartbeam 3D laser in “Single” mode (i.e. 5 µm beam focus) with a beam scan of 30 µm in both x and y dimension. Discrete pixel spectra were amassed from 600 laser shots.
MS imaging data from m/z 600 up to m/z 2,400 was gathered from digested tissue segments in positive reflector TOF mode. The pixel size (30 µm) and laser operation mode (Single) mirrored the settings applied in intact protein analysis. Each spectrum was made up of 400 laser shots.
Fragment spectra of certain peptides were gathered on-tissue in positive MS/MS mode without the application of collision gas. The quantity of laser shots accrued for each spectrum differed according to signal to noise ratios attained for individual peptides.
MS/MS imaging of particular precursor peptides was carried out at identical settings to those above, i.e. a pixel size of 30 µm. Fragment spectra were accrued from 400 laser shots for each pixel.
Data Analysis
SCiLS Lab software was used to carry out all imaging data analysis. Total Ion Count (TIC) was used as normalization method for all datasets.
Results and Discussion
Results gathered from intact protein imaging of mouse brain can be seen in Figures 1 and 2. As an initial data analysis stage, the dataset was subjected to spatial segmentation with an unsupervised multivariate statistical analysis technique [3].
The ensuing segmentation map, as seen in Figure 1, reveals the molecular likeness within varied anatomical sections in the mouse brain, for example, cerebellum, cortex and others. Figure 1 also shows area-specific protein profiles (TIC normalized) from a number of mouse brain regions.
Two discrete clusters that emerged following spatial segmentation analysis, representing mouse brain cortex and cerebellum, were analyzed in more detail by supervised univariate statistics, i.e. Receiver Operating Characteristics (ROC), to determine which proteins most significantly discriminate between cortex and cerebellum. Figure 2 shows these results.
A plot of area under curve (AUC) versus m/z (Figure 2, top) uncovers features at m/z positions that are equal to various histones, signifying substantial variations in the expression level of these proteins between cortex and cerebellum.
![MALDI-MS/MS imaging of precursor m/z 931.5 representing tryptic peptide ARTKQTAR from Histone 3.3. The red-colored arrow inserted in the annotated MS/MS spectrum (top) indicates the most abundant fragment ion [b+18]7 utilized for generation of the MS/MS ion image (bottom).](https://www.news-medical.net/image-handler/picture/2019/3/5-2.jpg)
Figure 5. MALDI-MS/MS imaging of precursor m/z 931.5 representing tryptic peptide
ARTKQTAR from Histone 3.3. The red-colored arrow inserted in the annotated MS/MS spectrum (top) indicates the most abundant fragment ion [b+18]7 utilized for generation of the MS/MS
ion image (bottom).
The variances in the spatial distribution of histones perceived by ROC analysis are demonstrated in more detail when overlaying the analogous TIC normalized mean spectra of the two regions representing either cerebellum or cortex (Figure 2, center).
The cerebellum mean spectrum signifies considerably greater quantities of the respective histones in comparison to the cortex mean spectrum.
It is worth noting the fact that the partially resolved fine structure of the MS signals denotes the histones´ tissue-specific modification profile, which exemplifies a matchless result performed by the top-down MALDI-TOF imaging technique.
A single example m/z channel has been selected from each of the four histone regions, and the corresponding ion images have been produced (Figure 2, bottom). These images reiterate the ROC result and point towards the clear co-localization of these protein species in the cerebellum region.
The top-down protein imaging findings shown here correlate entirely with the data stated earlier by Lahiri et al. [2], who carried out the study using a Bruker Ultraflex III instrument.
Nonetheless, through the employment of a rapifleX MALDITOF/TOF system, it was possible to carry out the analysis at almost twice the pixel resolution (30 µm on rapifleX versus 50 µm on ultraflex) and, simultaneously, at radically increased acquisition speed, i.e. around 14 times faster.
Figures 3-5 offer a summary of the results gathered from peptide imaging of a fresh-frozen mouse brain section following tryptic digestion. Spatial segmentation of the peptide dataset indicates spectral similarity reflecting the anatomical structures existent in the mouse brain (Figure 3).
Specifically, the cluster shaded red in the segmentation map plainly signifies the cerebellum region (which has been only partially covered when preparing this tissue section). For various indiscriminately chosen m/z features detected in the MS imaging data, TOF/TOF analysis was carried out directly from tissue.
The peptide sequences recognized by MASCOT ion search are marked up in Figure 3. One of the known peptides, m/z 931.54, ARTKQTAR, is derived from histone 3.3 (Mus musculus).
The MS ion image of this peptide (+/- 0.2 Da) is provided in Figure 4, alongside its marked up MS/MS spectrum, gathered directly from tissue from an area of the peptide´s greatest abundance.
The localization of this histone 3.3 peptide within the cerebellum area shows great consistency with the spatial distribution seen in the H3 histones in the intact protein imaging study outlined earlier.
To further verify these results, an MS/MS image was collected in which precursor m/z 931.54 was isolated and the spatial distribution of its most plentiful fragment ([b+18]7, m/z 775.4) can be seen in Figure 5.
The ensuing MS/MS image once more demonstrates a distinct localization of this specific histone 3.3 peptide to the cerebellum region, which is well in agreement with the intact protein, in addition to peptide MS imaging data detailed earlier.
Conclusions
The rapifleX MALDI-TOF/TOF instrument embodies a matchlessly adaptable platform, supporting MALDI tissue imaging of proteins at several stages:
- Top-down intact protein imaging
- Bottom-up MS based peptide imaging following trypsin digestion with ensuing identification of peptides by direct on-tissue MS/MS
- Bottom-up MS/MS based fragment imaging of specified tryptic peptides.
These workflows can work in conjunction to deliver complementary data. While the top-down approach boasts the inimitable ability to observe individual proteoforms, bottom-up MS and MS/MS imaging of on-tissue digested peptides offer further magnitudes of specificity and enable the resolution of overlapping isobaric or almost isobaric peptides via MS/MS.
The competences of the rapifleX for each of these MALDI imaging techniques have been demonstrated here through analysis of the spatial distribution of histones and additional proteins in mouse brain tissue.
In combination with the HTX TM-sprayer, and advanced tools for data analysis, i.e. SCiLS Lab software, the rapifleX exemplifies the definitive system for rapid and high-definition MALDI tissue imaging.
Acknowledgments
Thanks are offered to Dr. Shibojyoti Lahiri and Prof. Axel Imhof, Protein Analysis Unit (ZfP), Biomedical Center (BMC), Ludwig Maximilians University Munich, for providing the mouse brain sections used for intact protein imaging.
References
- S. Rauser, C. Marquardt, B. Balluff, S.-O. Deininger, C. Albers, E. Belau, R. Hartmer, D. Sukau, K. Specht, M.P. Ebert, M. Schmitt, M. Aubele, H. Höfler, A. Walch, J. Proteome Res., 2010, 9 (4), 1854–1863
- S. Lahiri, N. Sun, V. Solis-Mezarino, A. Fedisch, J. Ninkovic, A. Feuchtinger, M. Götz, A. Walch, A. Imhof, Proteomics, 2016, 16, 437-447
- T. Alexandrov, M. Becker, S.-O. Deininger, G. Ernst, L. Wehder, M. Grasmair, F. von Eggeling, H. Thiele, P. Maass, J. Proteome Res., 2010, 9 (12), 6535–6546
About Bruker Daltonics
Empowering Science – Improving Life
Bruker Daltonics delivers cutting-edge mass spectrometry solutions and workflows that help scientists and industry leaders tackle real-world challenges and make new discoveries. From life sciences and pharmaceutical research to food and contaminant analysis, environmental monitoring, forensics, and industrial quality control, our technologies and instruments provide the precision and reliability you need to make confident decisions.
Our innovative platforms - such as timsTOF, scimaX, neofleX, and DART-TQ - combined with advanced software like SCiLS™ Lab, MetaboScape®, and Biopharma Compass®, transform complex data into actionable insights. Breakthrough innovations like Trapped Ion Mobility (TIMS), Omnitrap®, and dual ionization GC-HRMS are redefining what’s possible in mass spectrometry.
Trusted by leading research institutes, universities, government agencies, and industrial partners worldwide, Bruker Daltonics is committed to driving scientific progress and delivering solutions that matter.
(For Research Use Only. Not for use in clinical diagnostic procedures).
Sponsored Content Policy: News-Medical.net publishes articles and related content that may be derived from sources where we have existing commercial relationships, provided such content adds value to the core editorial ethos of News-Medical.net, which is to educate and inform site visitors interested in medical research, science, medical devices and treatments.