These methods pledge to provide complete and reproducible quantitation of peptides and proteins amid pools of samples that will allow for improved characterization of the dynamics of the proteome.
The success of DIA approaches relies on both significant instrumental abilities (DIA calls for the recurrent procurement of full-scan MS/MS, in which resolution, sensitivity, accuracy and dynamic range should preferably be maintained at a very rapid speed) and on the ensuing analysis of this data.
The impact II’s UltraHigh Resolution Q-TOF’s inimitable blend of speed, resolution, sensitivity and high dynamic range is the ideal solution for these needs. A typical sample set and workflow that facilitates inter-laboratory comparison and intra-laboratory instrument performance characterization and corroboration has recently been outlined [1].
The workflow outlined in reference 1 was employed so as to add to the continued development and testing of such workflows, as well as to benchmark the performance of the DIA solution with the nanoElute LC and impact II QTOF.
In short, the instrument was tested by blending three proteomes in diverse ratios, according to reference 1, procuring the data in DIA mode and processing it using the Spectronaut™ software suite.
Results
Sample
Two distinct experiments were undertaken in order to evaluate the quantitative capabilities of the impact II Q-TOF instrument using a DIA approach. Each of these experiments consisted of tryptic digests of human, yeast, and E.coli cell lysates (Figure 1).
The trio of proteomes were blended in specified ratios (according to [1])., either with high (HYE110: 1:1 (A/B) for human, 10:1 (A/B) for yeast, 1:10 (A/B) for E.coli) or moderate fold changes (HYE124: 1:1 (A/B) for human, 2:1 (A/B) for yeast, 1:4 (A/B) for E.coli), with human proteins acting as the background proteome for both experiments.
Separation
Chromatographic separation was carried out on a nanoElute nano-UHPLC system. A 120 minute curved gradient was employed. Solvents were 0.1% formic acid in water (A) and 0.1% formic acid in acetonitrile (B). The temperature of the separation column was preserved at 50 °C and the flow rate was set to 400 nL/min value.
| Chromatography (Bruker nanoElute nano-UHPLC) |
| Elution time |
0 min |
Composition B |
2% B |
| 75 min |
15% B |
| 105 min |
25% B |
| 120 min |
35% B |
| 130 min |
95% B |
| 140 min |
95% B |
Acquisition
For each sample, five technical replicates were measured. The DIA method, adjusted for peak compatibility with the impact II, used 28 cycles to iterate through a 400-1,000 m/z precursor window range, while using a window size of 24 Da at a spectral acquisition rate of 14 Hz.
The end result of this is an overall cycle time of 2 seconds. Each cycle was launched with one MS1 survey scan.
It is simple to adapt the DIA method from the default DIA acquisition method when employing Bruker’s Q-TOF acquisition software: mass range; (variable) window size; acquisition rate; and optional inclusion of MS1 scans can all be chosen and adapted by the operator with great ease.
Additionally, depending on the precursor window mass range, collision energies are automatically adapted.
Processing
As a result of the complexity of the multiplexed spectra produced with DIA approaches, it is necessary to engage advanced data processing software solutions.
For this study, Spectronaut (Biognosys) was employed, alongside LFQbench (University Medical Center of Johannes Gutenberg University Mainz) software programs for data processing and evaluation respectively, with both solutions kept in default settings.
Spectronaut has been designed deliberately for use in DIA-based quantitative proteomics. The processing encompasses totally automatic in-run calibration, automatic interference correction, peak picking and automated quality control.
In addition to the use of iRT peptide, Biognosys’ reference spectral libraries were available for reference of peptide and protein identification, minimizing the effort required for method development, as there was no requirement for DDA runs to create reference libraries.
For the automatic analysis of label-free quantification performance, LFQbench was employed.
Qualitative Results: Identified and Quantified Peptides/Proteins
Over 31,000 peptides were identified over the two experiments, HYE110 and HYE124 (Table 1). HYE124 produced the identification of 3,654 proteins, while HYE110 produced 3,877.
For HYE124 and HYE110, respectively, 91% and 74% of those proteins were able to be reliably quantified with the aid of Spectronaut’s internal spectral database, which was formed from the assembly of another instrument type’s DDA analysis.
These results stand up well against those attained through other instrumental platforms [1], [6], especially in terms of the number of reliably quantified proteins.
Reproducibility of Proteome Measurements Using DIA
Confidence in the applied DIA approach can be determined by the reproducibility of peptide and protein quantitation. In order to assess the presented DIA method, the reproducibility between technical replicates and determined coefficients of variation (CV%) for both identified proteins and peptides was studied.
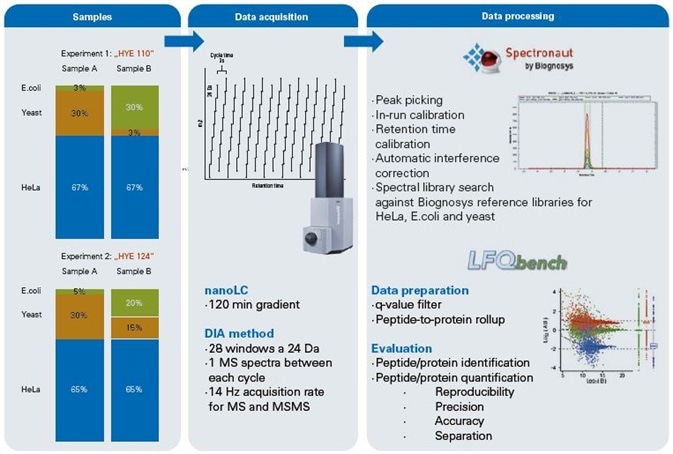
Figure 1. Workflow. Two experiments (HYE110 and HYE124) were prepared containing known quantities of human, yeast and E.coli peptide digests. Both samples differed in their ratios with sample HYE110 having higher ratios.Data acquisition was done using a nanoElute (Bruker Daltonics) nano flow UPLC coupled to an impact II Q-TOF instrument (Bruker Daltonics). Five technical replicates of each sample were analyzed in DIA acquisition mode using 24 Da window size. Data processing was done using Spectronaut software (Biognosys) for advanced peak picking and spectral library search. Subsequently LFQbench was used for in-depth data evaluation of peptide/protein identification and quantification.
Table 1. Qualitative results obtained from the HYE110 and HYE124 experiments. Identifications have been obtained by searching Spectronaut’s internal spectral library, from the 120 min gradient analyses.
| |
Sample |
Number of IDs |
Valid quantification ratios |
Median CV human* |
| Peptides |
HYE 124 |
33667 |
27431 |
0,08 |
| HYE 110 |
34857 |
23168 |
0,07 |
| Proteins |
HYE 124 |
3654 |
3320 |
0,0600 |
| HYE 110 |
3877 |
2848 |
0,0400 |
The calculation of R2 values enabled the quantification of reproducibility between single runs. Figure 2A shows a comparison of all single replicate runs for sample A of experiment HYE110, for each quantified signal. Extremely high R2 values have been observed for this complex sample on both the peptide and protein levels (Figure 2a and b).
For each of the sample sets, the median CV for background species among the replicate runs was significantly under 10%, on both the peptide and the protein level, demonstrating the exceptional reproducibility of the impact II’s MSMS level quantification (Figure 2 b).
In the analysis HYE110, 2,178 human proteins showed a median CV of 4%, while 18,423 peptides showed a median CV of 7%. For the HYE124 analysis, the median CV levels were of 5% for proteins (2,104 proteins), and 7% for peptides (17,998 peptides).
Figure 2. Reproducibility of DIA measurements. (a) Intensity correlation between all five technical replicates on peptide and protein level for Sample A (Experiment HYE124). (b) Summary of the reproducibility for the presented DIA measurements. R2 was calculated as average of all possible pairs for sample A, separately for both sample sets (HYE110 and HYE124). The “Median CV – human” represents the median CV for the background human species among the replicate runs.
| |
|
R2 value |
Median CV - human |
| Peptides |
HYE110 |
0.97 (±0.004) |
7% |
| HYE124 |
0.97 (±0.005) |
8% |
| Proteins |
HYE110 |
0.96 (±0.004) |
4% |
| HYE124 |
0.96 (±0.007) |
6% |
Accuracy of Proteome Quantification by DIA
The design of the analyzed proteomics samples facilitated the assessment of the quantitation accuracy of the applied DIA approach in conjunction with high-complexity protein mixtures. Background human proteins were spiked in equivalent quantities, leading to a theoretical ratio of 1:1.
HYE110 and HYE124 each demonstrated human proteins to be centered at a log2 ratio of sample A versus sample B of 0, which parallels the theoretical ratio of 1:1. This ratio could be observed over the whole dynamic range (Figure 3).
This leads to an exceptional overall precision (standard deviation of log ratios) of 0.27 for HYE110 and of 0.21 for HYE124, respectively. Experiment HYE124 offered greater overall accuracy for yeast and E.coli proteins and peptides than HYE110.
As a result of the higher fold change in HYE110, which forced ratio calculations from signals sometimes closer to noise threshold (Table 2), ratio determination in this experiment posed more difficulties. This outcome is in line with behavior witnessed on other instrument varieties for the described DIA approach [1].
Overall, over 33,000 peptides were reliably detected and quantified across the single experiments (both for HYE110 and for HYE124) easily covering five orders of magnitude for human proteins without any pre-fractionation.
As a result of the lower complexity of both proteomes (in comparison to the human proteome), as well as the lower quantities injected, the dynamic range covered for E. coli and yeast proteins was somewhat lower.
The findings confirm that the use of the described DIA technique on the impact II Q-TOF instrument results in excellent proteome coverage, reproducibility and accurate quantitation at the same time, in spite of the challenges posed by sample complexity, dynamic range and even by low-fold changes in concentration of a factor of two or four.
Methods
Samples preparation was undertaken for two separate experiments, HYE110 and HYE124. Each consisted of two different samples, generated through the mixing of three proteomes (Figure 1, “sample preparation”) in accordance with reference [1].
Figure 3. Protein level quantitative results for HYE110 and HYE124 sample analyzed after processing using LFQbench. Log-transformed ratios (log2(Sample A/ Sample B)) of yeast (orange), human (green) and E. coli (purple) proteins are plotted over log-transformed intensity for sample B (2834 proteins plotted for HYE110 and 3320 for HYE124). Colored dashed lines represent expected values.
Table 2. Qualitative results obtained from the HYE110 and HYE124 experiments. Identifications have been obtained by searching Spectronaut’s internal spectral library, from the 120 min gradient analyses.
| |
|
|
Human |
Yeast |
E.coli |
| Global Accuracy |
Protein level |
HYE110 |
0,0000 |
-0,5001 |
0,9535 |
| HYE124 |
0,0000 |
-0,1140 |
0,7298 |
| Peptide level |
HYE110 |
0,0000 |
-0,5024 |
0,8510 |
| HYE124 |
0,0000 |
-0,1217 |
0,7586 |
| Global Precision |
Protein level |
HYE110 |
0,2683 |
0,9665 |
1,6007 |
| HYE124 |
0,2137 |
0,3493 |
0,8649 |
| Peptide level |
HYE110 |
0,3353 |
0,9966 |
1,7651 |
| HYE124 |
0,2932 |
0,4224 |
1,0612 |
Human cell line and E.coli digest were prepared in accordance with ref [3]. Predigested yeast sample was re-suspended in 0.1% trifluoroacetic acid.
To produce samples for the study, HYE110 tryptic digests of the three proteomes were blended in the following ratios: sample A was made up of 67% w/w human, 30% w/w yeast, and 3% w/w E.coli proteins; sample B was made up of 67% w/w human, 3% w/w yeast, and 30% w/w E.coli proteins.
To produce samples for the study, HYE124 tryptic digests of the three proteomes were blended in the following ratios: sample A was made up of 65% w/w human, 30% w/w yeast, and 5% w/w E.coli proteins; sample B was made up of 65% w/w human, 15% w/w yeast, and 20% w/w E.coli proteins.
In every sample, the iRT retention time kit (Biognosys, Switzerland) was spiked at a concentration of 1:20 v/v. Advanced retention time calibration using iRT (indexed Retention Time) facilitates usage of more compact extraction windows and leads to greater precision of peptide quantification over multiple runs [4].
Peptides (1 µg/µl) were separated with a nanoLC column and then identified via a DIA approach on the impact II QTOF-MS (Bruker Daltonics). Every sample was measured in five technical replicates. Data processing was carried out with Spectronaut software (version 9, Biognosys) with default settings applied.
Normalization, as implemented in the software, was engaged to improve the precision of quantification, the interference detection algorithm and cross runs.
Reference libraries, as offered by Biognosys, were employed as spectral libraries (HeLa: 28674 unique peptide sequences, yeast: 19101 unique peptide sequences, E. coli: 13074 unique peptide sequences).
As described in [1], for data evaluation, peak picking results were then exported to LFQbench for additional processing. LFQbench (https://omictools.com/lfqbench-label-free-quantification-bench-tool) is an open-source R library for the automation analysis of label-free quantification results of hybrid proteome data sets [5].
| Settings nanoElute™ (Bruker Daltonics) |
| Column |
Nano Trap Column, 100 µm i.d. × 2 cm, packed with Acclaim PepMap100 C18, 5 µm, 100 Å, nanoViper and Acclaim PepMap RSLC C18, 2 µm, 100 Å, 75 µm i.d.×50 cm, nanoViper (Thermo Fisher Scientific) |
| Flow rate |
400 nL/min |
| Mobile phase |
A = water + 0.1% formic acid, B = acetonitrile + 0.1% formic acid |
| Gradient |
t = 0 min, 2% B; t = 2 min 5% B; t = 90 min, 35% B; t = 100 – 110 min 95% B; t =111 – 125 min 5% B |
| Source |
CaptiveSpray ionization source |
| Ionization: |
ESI(+) |
| Mode: |
DIA (details see Table 2) |
| Scan range: |
m/z 400–1000 |
| Window size: |
24 Da |
| Acquisition rate: |
14 Hz |
Table 3. Details about window placement used for described DIA method, including m/z ranges and collision energies.
| # |
m/z start |
m/z end |
Collision Energy |
# |
m/z start |
m/z end |
Collision Energy |
| MS |
|
|
7 |
MS |
|
|
7 |
| 1 |
400,4319 |
424,4428 |
27 |
27 |
388,4264 |
412,4374 |
27 |
| 2 |
424,4428 |
448,4537 |
27 |
28 |
412,4374 |
436,4483 |
27 |
| 3 |
448,4537 |
472,4646 |
27 |
29 |
436,4483 |
460,4592 |
27 |
| 4 |
472,4646 |
496,4756 |
27 |
30 |
460,4592 |
484,4701 |
27 |
| 5 |
496,4756 |
520,4865 |
27 |
31 |
484,4701 |
508,481 |
27 |
| 6 |
520,4865 |
544,4974 |
31 |
32 |
508,481 |
532,4919 |
31 |
| 7 |
544,4974 |
568,5083 |
31 |
33 |
532,4919 |
556,5028 |
31 |
| 8 |
568,5083 |
592,5192 |
31 |
34 |
556,5028 |
580,5138 |
31 |
| 9 |
592,5192 |
616,5301 |
31 |
35 |
580,5138 |
604,5247 |
31 |
| 10 |
616,5301 |
640,541 |
39 |
36 |
604,5247 |
628,5356 |
39 |
| 11 |
640,541 |
664,552 |
39 |
37 |
628,5356 |
652,5465 |
39 |
| 12 |
664,552 |
688,5629 |
39 |
38 |
652,5465 |
676,5574 |
39 |
| 13 |
688,5629 |
712,5738 |
39 |
39 |
676,5574 |
700,5683 |
39 |
| 14 |
712,5738 |
736,5847 |
42 |
40 |
700,5683 |
724,5792 |
42 |
| 15 |
736,5847 |
760,5956 |
42 |
41 |
724,5792 |
748,5902 |
42 |
| 16 |
760,5956 |
784,6065 |
42 |
42 |
748,5902 |
772,6011 |
42 |
| 17 |
784,6065 |
808,6174 |
42 |
43 |
772,6011 |
796,612 |
42 |
| 18 |
808,6174 |
832,6284 |
45 |
44 |
796,612 |
820,6229 |
45 |
| 19 |
832,6284 |
856,6393 |
45 |
45 |
820,6229 |
844,6338 |
45 |
| 20 |
856,6393 |
880,6502 |
45 |
46 |
844,6338 |
868,6447 |
45 |
| 21 |
880,6502 |
904,6611 |
45 |
47 |
868,6447 |
892,6556 |
45 |
| 22 |
904,6611 |
928,672 |
48 |
48 |
892,6556 |
916,6666 |
48 |
| 23 |
928,672 |
952,6829 |
48 |
49 |
916,6666 |
940,6775 |
48 |
| 24 |
952,6829 |
976,6938 |
48 |
50 |
940,6775 |
964,6884 |
48 |
| 25 |
976,6938 |
1.000,70 |
48 |
51 |
964,6884 |
988,6993 |
48 |
| 26 |
1.000,70 |
1.024,72 |
48 |
52 |
988,6993 |
1.012,71 |
48 |
Conclusions
The study shown demonstrates the advantages of the impact II’s matchless combination of speed, resolution and sensitivity which enable high DIA performance while working with standard sized windows.
The subsequent very brief cycle time ensures a good chromatographic resolution. In combination with the Chromatographic performance of the nanoElute, and the spray reproducibility offered by the CaptiveSpray nanoBooster, it produces cutting-edge performance for precise ratio determination.
Exceptionally high reproducibility of MS/MS quantitation, with CV levels significantly under 10%, facilitates the precise quantitation of both small and large fold changes.
The earlier maXis impact had already demonstrated major potential for targeted proteomics use, including DIA analysis [2]. The impact II/Spectronaut solution now extends these capacities further by allowing for direct DIA identification and the most accurate ratio determination from complex samples from the same acquisition.
Those results are absolutely comparable to what could be acquired from platforms designed for DIA acquisition, with no compromise made on the impact II’s flexibility for other applications, such as Glycoproteomics of Proteoform Profiling.
References
- Pedro Navarro, et al. (2016) A multicenter study benchmarks software tools for label-free proteome quantification. Nature Biotechnology 34, 1130-1136
- Application Note LC-MS89: High quantification efficiency in plasma targeted proteomics with a fullcapability discovery Q-TOF platform https://www.bruker.com/fileadmin/ user_upload/8-PDF-Docs/Separations_ MassSpectrometry/Literature/ ApplicationNotes/LCMS-89_Targeted_ Proteomics_ebook.pdf
- Wang, H., et al. (2005) Development and evaluation of a micro- and nanoscale proteomic sample preparation method. Journal of proteome research 4, 2397-2403
- Bruderer, R., et al. (2016) Highprecision iRT prediction in the targeted analysis of data-independent acquisition and its impact on identification and quantification. Proteomics 16, 2246- 2256
- Kuharev, J., et al. (2015) In-depth evaluation of software tools for data-independent acquisition based label-free quant
About Bruker Daltonics
Empowering Science – Improving Life
Bruker Daltonics delivers cutting-edge mass spectrometry solutions and workflows that help scientists and industry leaders tackle real-world challenges and make new discoveries. From life sciences and pharmaceutical research to food and contaminant analysis, environmental monitoring, forensics, and industrial quality control, our technologies and instruments provide the precision and reliability you need to make confident decisions.
Our innovative platforms - such as timsTOF, scimaX, neofleX, and DART-TQ - combined with advanced software like SCiLS™ Lab, MetaboScape®, and Biopharma Compass®, transform complex data into actionable insights. Breakthrough innovations like Trapped Ion Mobility (TIMS), Omnitrap®, and dual ionization GC-HRMS are redefining what’s possible in mass spectrometry.
Trusted by leading research institutes, universities, government agencies, and industrial partners worldwide, Bruker Daltonics is committed to driving scientific progress and delivering solutions that matter.
(For Research Use Only. Not for use in clinical diagnostic procedures).
Sponsored Content Policy: News-Medical.net publishes articles and related content that may be derived from sources where we have existing commercial relationships, provided such content adds value to the core editorial ethos of News-Medical.net, which is to educate and inform site visitors interested in medical research, science, medical devices and treatments.