There are many different scenarios in biopharmaceutical drug discovery and development that need fast, accurate and reliable analysis of antibodies by mass spectrometry, from innovator and biosimilar development to quality control of production.
BioPharma Compass software platform, which emphasizes the simplification and streamlining of automated data acquisition and processing for common analytical workflows, was developed in response to researcher expectations for rapid results with the lowest possible interaction effort.
To demonstrate the pace at which a sizeable quantity of valuable data can be produced and interpreted in BPC 2.0, the NIST reference antibody (1) was measured with the Bruker maXis ultra-high resolution QTOF mass spectrometer by means of a trio of complementary approaches that offered unique abilities for providing detailed information at great speed (Fig. 1).
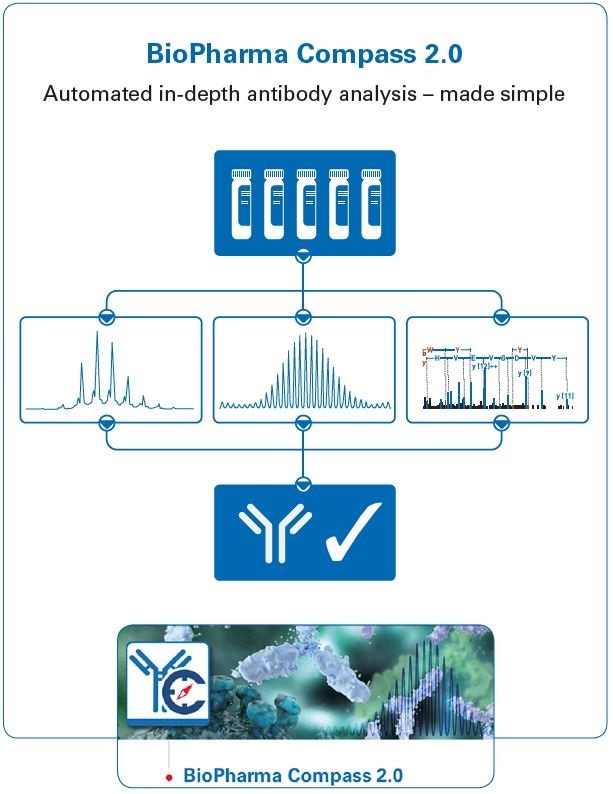
Figure 1. Graphical abstract, showing the use of BioPharma Compass 2.0 for automated antibody characterization using intact, subunit domain and bottom-up approaches. The software also contains other features not shown here, including workflows for MALDI and ETD, and a Regulatory Toolkit.
Results and Discussion
Intact Mass Screening
Valuable data relating to the major glycoforms present in the sample was produced through analysis of the intact NIST antibody by UHPLC-MS, with just a simple 1 minute desalting LC gradient (total run time 10 minutes).
For example, the key glycoforms G0F, G1F and G2F were marked up, lysine clipping could easily be identified for each glycoform, and even the aglycon was detected, signifying a good dynamic range of the analysis.
Each of these signals was routinely detected with a mass accuracy of < 2 Da, offering a confident impression of the quality and composition of the sample over a brief time frame (Fig. 2).
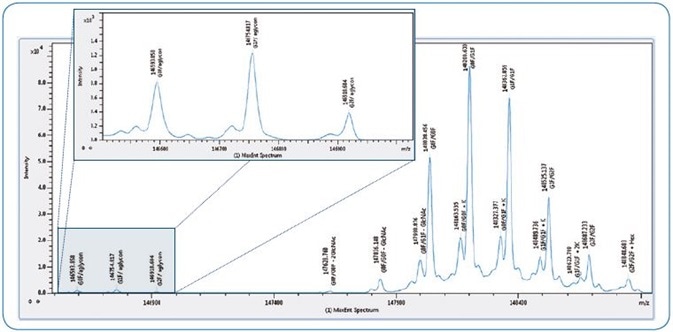
Figure 2. Intact mass screening of NIST antibody. Maximum entropy deconvoluted spectrum shows glycoforms detected across > 2 orders of magnitude. Insert shows low abundant aglycon forms in more detail.
| Experimental Details |
|
| Platform: |
BPC 2.0 software, maXis II UHR-QTOF, Standard flow UHPLC, BEH C4 2.1 x 100 mm 1.7 µm (Waters) or C18+ 2.1 x 100 mm 1.5 µm (Thermo) column (see below), Solvent A 0.1% FA in water, Solvent B 0.1% FA in acetonitrile. |
| Intact mass: |
1 µg injected on C4 column heated to 80 °C, 0.5 mL/min, 27-95% B gradient in 1 min, total run time 10 mins. |
| Middle-Down: |
Digestion with IdeS (FabRICATOR, Genovis) , followed by DTT reduction in guanidine-HCl. 1 µg injected on C4 column heated to 40 °C, 0.2 mL/min, 27-42% B gradient in 20 min after equilibration to waste for 20 min at 2% B to remove guanidine-HCl. |
| Bottom-Up: |
Digestion with Trypsin. 4 µg injected on C18 column heated to 40 °C, 0.2 mL/min, 2-40% B in 45 min, MS 2 Hz, MS/MS 2-5 Hz depending on precursor intensity. |
Subunit Domains
In the past, a domain-based approach has been used to study antibody intact mass inconsistencies stemming from sequence variants (2).
In this instance, it is employed for simple confirmation and relative quantitation of the modifications existent on the respective antibody subunit, for example, glycation on the LC and pyroglutamylation on the Fd subunit (Fig. 3).
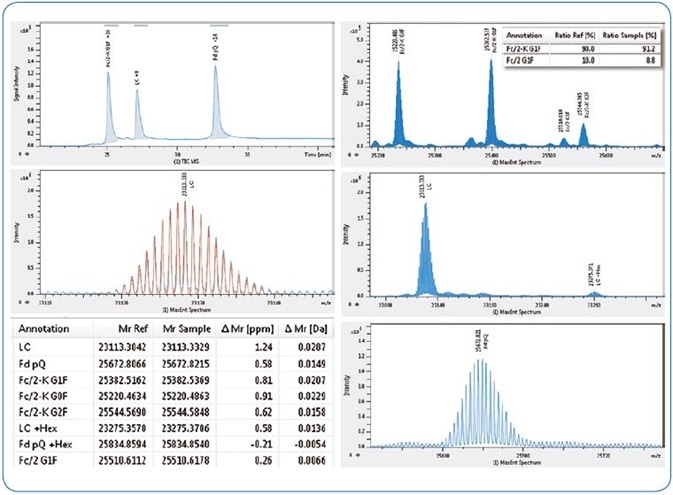
Figure 3. Subunit domain analysis of NIST antibody. Left from top, LC-MS TIC chromatogram, NIST LC acquired isotopic pattern (blue) overlaid with theoretical (red), table of results (abridged). Right from top, maximum entropy deconvoluted spectra for NIST Fc/2 (insert shows relative quantitation of lysine clipping), LC and Fd subunits.
Interestingly, the inlay in Fig. 3 illustrates that 91.2 % of the mAb, typified by the G1F glycoform, had experienced lysine clipping.
The major benefit of the subunit method is that Bruker’s SNAP algorithm determines monoisotopic molecular weights (in the majority of cases with sub ppm mass accuracy) from isotopic peaks with high isotopic fidelity (True Isotopic Pattern, or TIP™) that were resolved to the baseline (Table in Fig 3).
This allows for protein modifications to be quantified with ease and accuracy, and even facilitates the investigation of deamidation events on the domain level. Both anticipated and unanticipated protein modifications can be confidently assigned in BPC 2.0, and can be corroborated further by overlaying the theoretical isotope pattern.
Bottom-Up Analysis
Sequence validation of antibodies calls for the fragmentation of all available peptides, so as to attain near 100 % sequence coverage. The fragment spectra generated must also be of exceptional quality in order to deliver fragment peak evidence (fragment coverage) for every individual amino acid.
The NIST antibody was digested solely with trypsin, and the peptides were separated with a comparatively brief 45 minute gradient. Fragmentation was activated with an Instant Expertise™ auto MS/MS acquisition method and produced 99.5 % sequence coverage for the light chain (LC) in one experiment (Fig. 4).
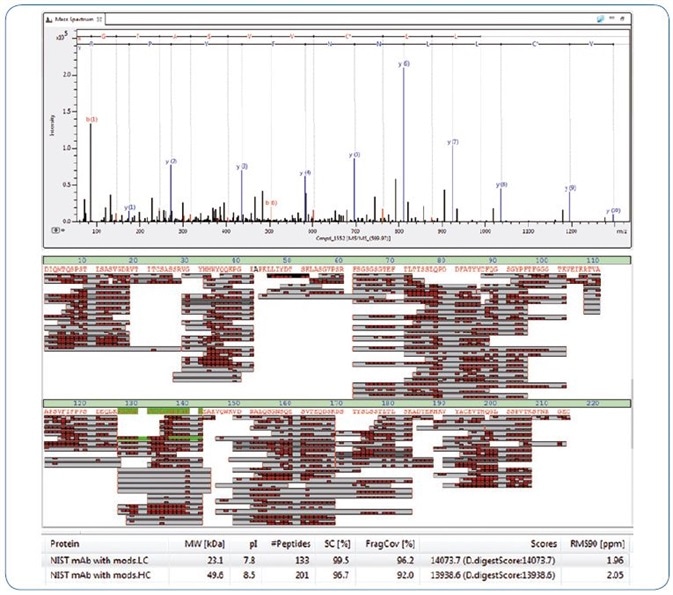
Figure 4. Bottom up analysis of NIST antibody showing near 100% sequence coverage. From top, example MS/MS spectrum, sequence coverage map and an excerpt from the BPC 2.0 results table.
This outcome was achieved with MS/MS fragment spectra that displayed outstanding detection of low and high mass fragments at the same time, which led to 96.2% fragment coverage of the NIST LC.
Conclusion
BioPharma Compass 2.0 and the maXis II were employed for the automated evaluation of the NIST antibody, using a trio of complementary approaches: intact, subunit domain and bottom-up. This grouping delivered rapid, precise and detailed data for antibody analysis using just one software platform.
BPC 2.0 was designed to be extremely simple to operate, while upholding the experimental flexibility necessary in the modern biopharmaceutical analytical laboratory. The software also facilitates 21 CFR Part 11 compliant work.
The specific benefits of each of the described approaches are:
Intact mass: Rapid screening for anticipated glycoforms, including low abundant species such as the aglycan and prompt detection of antibody processing artifacts.
Subunit domain: Precise mass analysis of antibody subunits on the sub ppm level, glycoform quantitation and additional localization of sequence deviations on the Fd, Fc/2 or LC domains (2).
Bottom up: Close to 100% sequence and fragment coverage for sequence validation from just one experiment.
References
- Formolo T et al. (2015), Determination of the NISTmAb Primary Structure, in: State-of-the-Art and Emerging Technologies for Therapeutic Monoclonal Antibody Characterization Volume 2. Biopharmaceutical Characterization: The NISTmAb Case Study, Chapter 1, pp 1–62, ACS Symposium Series, Vol. 1201; Chapter DOI: 10.1021/bk-2015-1201.ch001.
- Ayoub D et al. Correct primary structure assessment and extensive glyco-profiling of cetuximab by a combination of intact, middle-up, middle-down and bottom-up ESI and MALDI mass spectrometry techniques. MAbs. 2013;5(5):699-710. doi: 10.4161/ mabs.25423.
Some of the work reported here was undertaken as part of a project for the Consortium for Top-Down Proteomics: “Structural Analysis of Monoclonal Antibodies by Top-Down Mass Spectrometry: An Intra-Laboratory Study”.
About Bruker Daltonics
Empowering Science – Improving Life
Bruker Daltonics delivers cutting-edge mass spectrometry solutions and workflows that help scientists and industry leaders tackle real-world challenges and make new discoveries. From life sciences and pharmaceutical research to food and contaminant analysis, environmental monitoring, forensics, and industrial quality control, our technologies and instruments provide the precision and reliability you need to make confident decisions.
Our innovative platforms - such as timsTOF, scimaX, neofleX, and DART-TQ - combined with advanced software like SCiLS™ Lab, MetaboScape®, and Biopharma Compass®, transform complex data into actionable insights. Breakthrough innovations like Trapped Ion Mobility (TIMS), Omnitrap®, and dual ionization GC-HRMS are redefining what’s possible in mass spectrometry.
Trusted by leading research institutes, universities, government agencies, and industrial partners worldwide, Bruker Daltonics is committed to driving scientific progress and delivering solutions that matter.
(For Research Use Only. Not for use in clinical diagnostic procedures).
Sponsored Content Policy: News-Medical.net publishes articles and related content that may be derived from sources where we have existing commercial relationships, provided such content adds value to the core editorial ethos of News-Medical.net, which is to educate and inform site visitors interested in medical research, science, medical devices and treatments.